Table of contents

The global e-commerce analytics market is set to grow from $29.28 billion in 2025 to $60.59 billion by 2030, yet only 56% of organizations have fully adopted BI tools. These e-commerce marketing dashboard statistics reveal how top-performing brands use analytics platforms, KPI tracking, and real-time reporting to drive faster decisions, higher conversions, and measurable ROI improvements across every channel.
Key Takeaways
- The e-commerce analytics market is growing at 15.66% CAGR, projected to reach $60.59 billion by 2030
- 82% of e-commerce businesses use analytics for personalization, making it the top use case for customer data
- E-commerce conversion rates improve by 11% when brands implement dedicated analytics tools
- 75% of e-commerce businesses use BI for customer analytics, the highest adoption rate of any BI application
- GA4 full implementation boosts ROI attribution by 23% and reduces wasted ad spend by 17%
- Real-time analytics adoption reached 52% in enterprises, doubling from prior years
- Email marketing generates $42 for every $1 spent — a metric only visible in unified dashboards
E-Commerce Dashboard and Analytics Market Overview
| Metric | Value | Source |
|---|---|---|
| E-Commerce Analytics Market (2025) | $29.28 billion | Research and Markets |
| Projected Market Size (2030) | $60.59 billion | Research and Markets |
| Market CAGR (2025–2030) | 15.66% | Research and Markets |
| BI Tool Adoption Rate | 56% of organizations | Gitnux |
| E-Commerce BI for Customer Analytics | 75% | Gitnux |
| Real-Time Analytics Adoption | 52% in enterprises | Gitnux |
| Analytics-Driven Conversion Lift | +11% | Gitnux |
| Personalization Analytics Usage | 82% of e-commerce | Gitnux |
| GA4 ROI Attribution Improvement | +23% | Digital Applied |
| Email Marketing ROI | $42 per $1 spent | Empire325 |
Analytics and BI Adoption Across E-Commerce
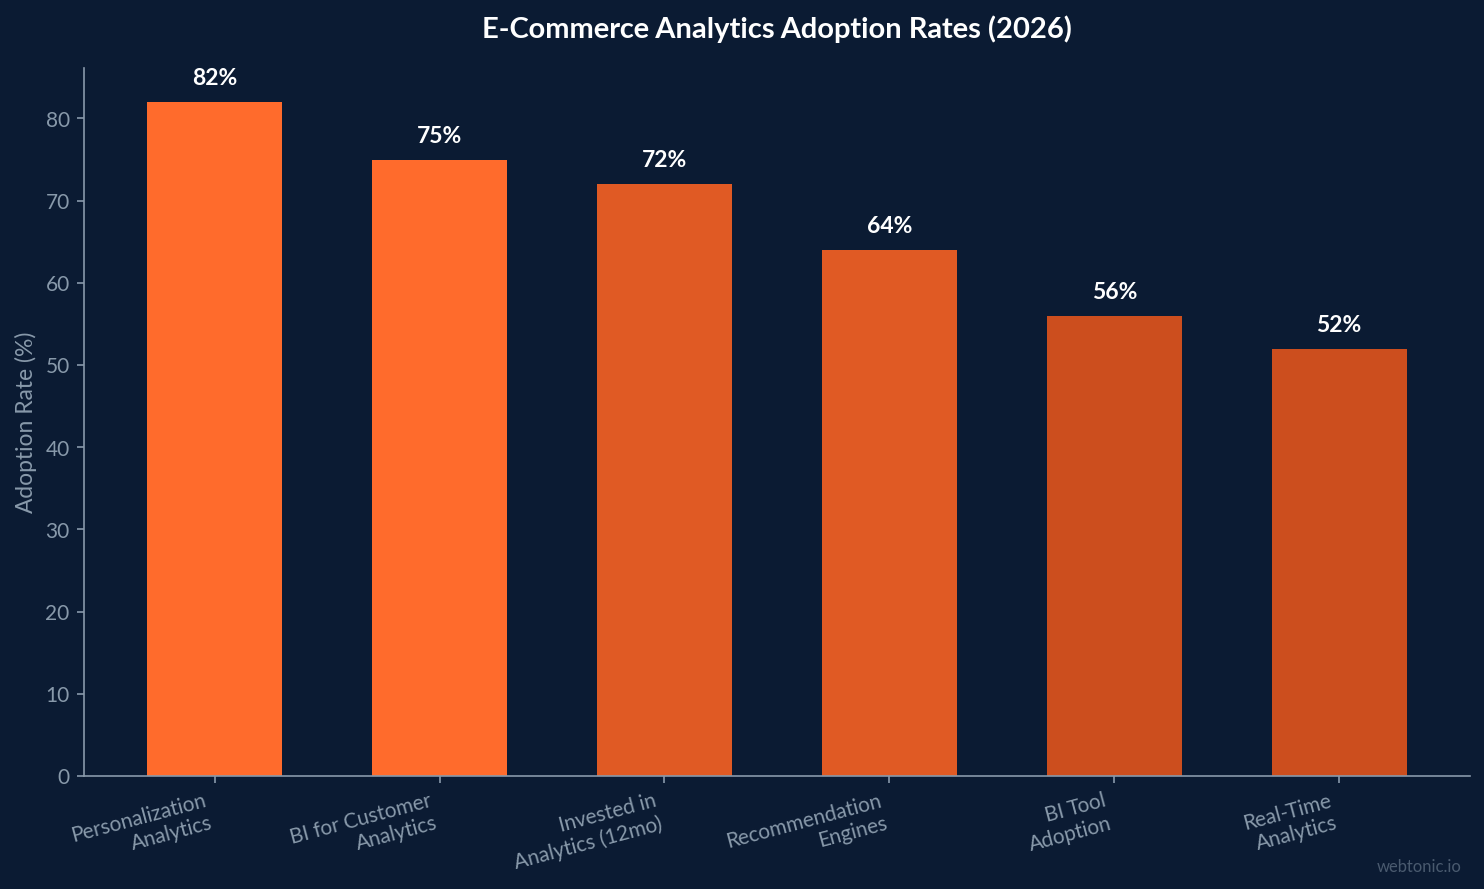
According to Gitnux, 56% of organizations have adopted BI tools, up from 48% in 2020 — a 17% increase in adoption in just three years. E-commerce leads this adoption curve significantly: 75% of e-commerce businesses use BI specifically for customer analytics, and 64% leverage recommendation analytics engines to personalize product suggestions, upsell opportunities, and post-purchase communications.
Business analytics research shows that 72% of organizations invested in analytics tools in the past 12 months, with e-commerce brands seeing an 11% lift in conversion rates from implementing dedicated analytics platforms. 82% of e-commerce businesses use customer analytics for personalization, making it the single most common application of data intelligence in online retail. These numbers demonstrate that analytics is no longer optional — it is the baseline requirement for competitive e-commerce operations.
Despite these high adoption rates, a significant implementation gap persists across the industry. While 72% of organizations purchased analytics tools, many use them at only a fraction of their capability. Only 9% of merchants leverage GA4 predictive audiences for remarketing, and just 22% export e-commerce data to BigQuery for custom attribution models. This gap between purchasing analytics tools and fully utilizing them represents one of the largest untapped competitive advantages in e-commerce today.
E-Commerce KPI Benchmarks for Marketing Dashboards
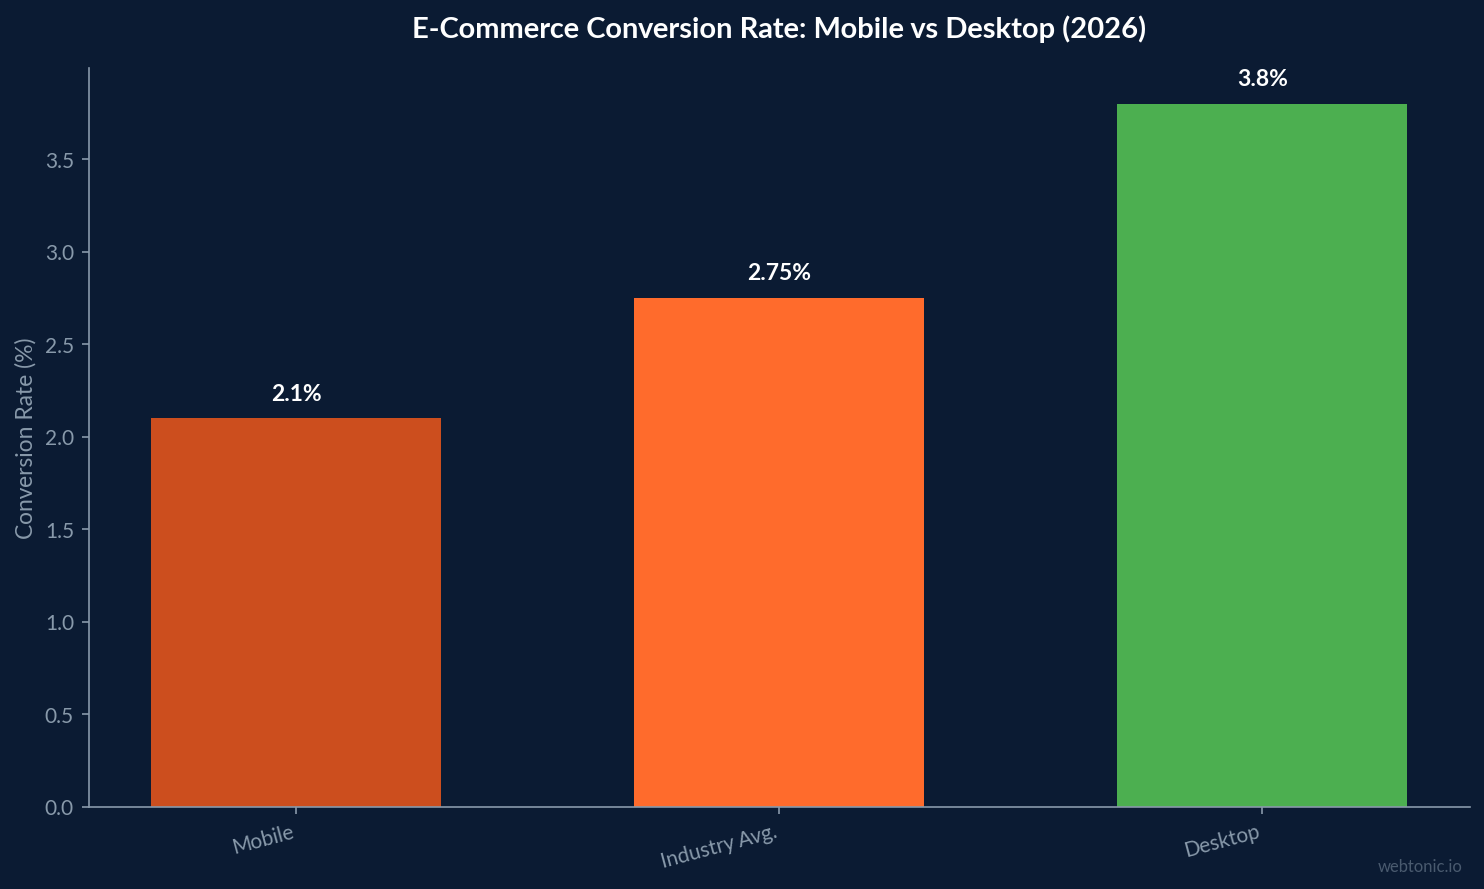
Effective dashboards track the right KPIs against industry benchmarks rather than arbitrary internal targets. CuFinder's 2026 benchmarks provide the baseline metrics that every e-commerce growth marketing dashboard should monitor. The gap between mobile and desktop performance is particularly important for informing budget allocation decisions and channel optimization strategies.
| KPI | Industry Avg. | Mobile | Desktop |
|---|---|---|---|
| Conversion Rate | 2.75% | 2.10% | 3.80% |
| Bounce Rate | 44.5% | 49.0% | 36.0% |
| Avg. Time on Site | 2 min 35 sec | 1 min 55 sec | 3 min 20 sec |
| Pages Per Session | 4.1 | 3.4 | 5.2 |
| Cart Abandonment Rate | 70.2% | 77.8% | 60.1% |
The 17.8 percentage point gap between mobile and desktop cart abandonment (77.8% vs. 60.1%) is one of the most actionable insights a well-designed dashboard can surface immediately. Brands that segment their dashboards by device type and set device-specific conversion targets consistently outperform those relying on blended averages. Similarly, a 2.75% global conversion rate serves as a useful baseline, but the 1.8× difference between mobile (2.10%) and desktop (3.80%) means device-specific optimization can unlock significant incremental revenue that blended metrics would obscure.
GA4 and Modern Analytics Platform Adoption
Digital Applied tracks GA4 adoption data showing that stores with full e-commerce tracking implementation see a 23% improvement in marketing ROI attribution and a 17% average reduction in wasted ad spend. These are not marginal gains — for a brand spending $100,000/month on ads, a 17% efficiency improvement recovers $17,000 in monthly budget available for reinvestment into proven channels.
However, advanced feature adoption remains surprisingly low despite these clear benefits. Only 9% of merchants use GA4 predictive audiences for remarketing campaigns, and just 22% export e-commerce data to BigQuery for custom attribution analysis. This adoption gap represents a massive competitive advantage for brands willing to invest in proper implementation and team training.
Ecommerce Times reports that Shopify's new Analytics 3.0 dashboard is reshaping revenue measurement for roughly 50,000 Shopify Plus merchants, making native analytics powerful enough to replace standalone reporting tools for many mid-market brands. The platform now includes profit analytics, customer cohort analysis, and marketing attribution capabilities that previously required third-party tools costing $500–$2,000 per month.
Dashboard Design and Reporting Best Practices
EcomToolkit found that performance improves when teams stop asking "which dashboard is right" and start asking "which KPI threshold should trigger which owner action." This insight drives the scorecard approach to e-commerce analytics: every metric needs a benchmark, a responsible owner, and a clearly defined threshold that triggers a specific operational response.
Their KPI framework emphasizes that a high-quality e-commerce dashboard is not a chart collection — it is a decision framework with clear metric ownership and reconciled definitions. Finance and growth teams need different views of the same underlying data, with shared definitions for metrics like MQL, sourced pipeline, and contribution margin. When both teams see the same number defined the same way, the typical data disagreement meetings that consume 3–5 hours per week can be eliminated entirely.
Real-Time Analytics and AI-Powered Dashboard Insights
Real-time analytics adoption has doubled to 52% in enterprises, with 58% of retail firms specifically adopting real-time customer analytics according to Gitnux. For e-commerce brands managing Meta Ads and Google Ads budgets simultaneously, real-time dashboards enable intra-day spend adjustments and anomaly detection that fixed-schedule weekly reports simply cannot support.
AI-powered analytics platforms now offer 15–30% marketing efficiency gains according to INSIA, with tools that reconcile ad platform data to prevent the pervasive problem of double-counting conversions across Meta, TikTok, and Google. This reconciliation issue is particularly acute for e-commerce: when a customer clicks a Meta ad, then searches on Google, and finally converts via an email reminder — all three platforms claim the same sale, inflating reported performance.
Empire325 Marketing reports that email marketing generates $42 for every $1 spent for e-commerce — a stat that only becomes actionable when tracked in a unified dashboard alongside paid channel performance. Without a unified view, many brands underinvest in email because its contribution is invisible in platform-specific reporting, causing them to over-allocate budget to channels with lower true ROI.
E-Commerce Dashboard Implementation Checklist
- Define KPI ownership before building dashboard views — assign each metric to a specific team member with authority to act on threshold breaches and clear escalation protocols for critical metric deviations
- Implement full GA4 e-commerce tracking — stores using complete implementations see 23% better ROI attribution and 17% less wasted ad spend versus partial setups
- Separate finance and growth team dashboards — teams need reconciled definitions for shared metrics like contribution margin, blended ROAS, and customer acquisition cost
- Integrate all paid channel cost data into one view — Google Ads, Meta, TikTok, and email performance must be visible side by side to prevent double-counting conversions
- Add real-time alerts for anomaly detection — 52% of enterprises already use real-time analytics to catch budget overspend, conversion drops, and tracking failures within hours
- Set device-specific conversion targets — a 2.75% conversion rate is the global average, but mobile (2.10%) and desktop (3.80%) require separate optimization targets and strategies
- Track email ROI in the same view as paid channels — at $42 return per $1 spent, email is often the highest-ROI channel but gets systematically underinvested when reported separately
Cross-Channel Data Reconciliation Challenges
One of the most persistent challenges in e-commerce dashboard design is reconciling data from multiple advertising platforms that each claim credit for the same conversion. When a customer sees a Meta ad, clicks a Google search result, and converts after opening an email, all three platforms report a conversion. Without a unified dashboard that deduplicates these claims, brands routinely overcount conversions by 20–35% and make budget allocation decisions based on inflated performance metrics that bear little resemblance to actual business results.
Modern attribution dashboards solve this by implementing order-level deduplication. Each conversion is tied to a specific order ID, and the dashboard reconciles platform-reported conversions against actual revenue from the e-commerce platform. Brands implementing this approach report more accurate ROAS calculations and frequently discover that their true cost per acquisition is significantly higher than any single platform reports. This reconciliation capability alone justifies the investment in a unified analytics dashboard for most mid-market e-commerce brands spending more than $25,000 per month on advertising.
Frequently Asked Questions
What are the most important KPIs for an e-commerce dashboard?
The essential KPIs include conversion rate (2.75% global average), average order value, customer acquisition cost, cart abandonment rate (70.2% average), and return on ad spend. Effective dashboards also track customer lifetime value, email revenue attribution ($42 per $1 spent), and bounce rate with separate mobile and desktop breakdowns to identify device-specific optimization opportunities.
How large is the e-commerce analytics market?
The global e-commerce analytics software market was valued at $29.28 billion in 2025 and is projected to reach $60.59 billion by 2030, growing at a 15.66% CAGR according to Research and Markets. This growth is driven by increasing data complexity, multi-channel attribution requirements, and accelerating AI-powered analytics adoption across online retail.
What percentage of e-commerce businesses use analytics tools?
Approximately 82% of e-commerce businesses use customer analytics for personalization, 75% use BI specifically for customer analytics, and 64% use recommendation analytics engines. Overall BI adoption across all industries stands at 56%, up from 48% in 2020. However, advanced feature usage remains low, with only 9% using GA4 predictive audiences.
How does GA4 improve e-commerce reporting?
Stores with full GA4 e-commerce tracking implementation see a 23% improvement in marketing ROI attribution and a 17% reduction in wasted ad spend. GA4 defaults to data-driven attribution, which distributes conversion credit using machine learning based on actual customer behavior patterns rather than arbitrary last-click rules. However, only 9% of merchants use predictive audiences and 22% export data to BigQuery.
What is the ROI of implementing a marketing dashboard?
E-commerce brands implementing dedicated analytics tools see an 11% lift in conversion rates on average. AI-powered analytics platforms report 15–30% marketing efficiency gains. The primary ROI driver is faster decision-making — real-time analytics adoption has doubled to 52% in enterprises because delayed reporting costs optimization opportunities that evaporate within hours of occurrence.
Sources
Gitnux – Business Analytics Industry Statistics
Gitnux – Business Intelligence Statistics
Gitnux – Customer Analytics Industry Statistics
Digital Applied – Google Analytics Statistics 2026
Ecommerce Times – Shopify Analytics 3.0 Dashboard
CuFinder – E-Commerce Marketing Benchmarks 2026
EcomToolkit – E-Commerce KPI Benchmark Scorecard
EcomToolkit – Dashboard KPIs for Growth and Finance
Research and Markets – E-Commerce Analytics Market
Empire325 – E-Commerce Marketing Statistics 2026