Table of contents
Shopping apps convert App Store searchers better than the average app: in MobileAction's 2026 Apple Ads benchmark the Shopping category turned 69.55% of search-ad taps into downloads in 2025. Organic store pages convert far lower, and that is the gap e-commerce ASO works on.
Key Takeaways
- 69.55% Shopping-category tap-to-download rate on Apple Ads search results in 2025, vs 65.82% for all apps.
- Shopping cost per tap fell from $1.17 to $0.84, and cost per acquisition from $1.74 to $1.20 (MobileAction).
- Almost 65% of App Store downloads happen directly after a search (Apple).
- 70% of App Store visitors use search to discover apps.
- Default product pages convert at 1.6% on average; custom pages add 2.5 points (Apple).
- Up to 70 custom product pages per app on the App Store and 50 custom store listings on Google Play.
- 6.35 billion e-commerce app downloads worldwide in 2025 (Sensor Tower estimate).
- 56.4% of 2025 US holiday online transactions were on a smartphone (Adobe).
- 46% of shopping apps have mediocre-or-worse checkout UX, against 63% of mobile sites (Baymard).
E-Commerce ASO Benchmarks at a Glance
Two kinds of conversion rate appear below and should not be mixed: paid tap-to-download rates from Apple Ads, and organic product page conversion reported by Apple. Rankings data is limited to what Apple publishes.
| Metric | Shopping apps | All apps | Source |
|---|---|---|---|
| Apple Ads search results CR, 2025 | 69.55% | 65.82% | MobileAction (vendor) |
| Apple Ads cost per tap, 2025 | $0.84 | $1.26-$1.88 by quarter | MobileAction |
| Apple Ads cost per acquisition, 2025 | $1.20 | $2.51 | MobileAction |
| Default product page conversion | Not published by category | 1.6% | Apple |
| Downloads that follow a search | Not published by category | Almost 65% | Apple Ads |
| Shopping-app keyword rank benchmark | Not published | - | No named dataset found |
Shopping Is One of the Higher-Converting Categories
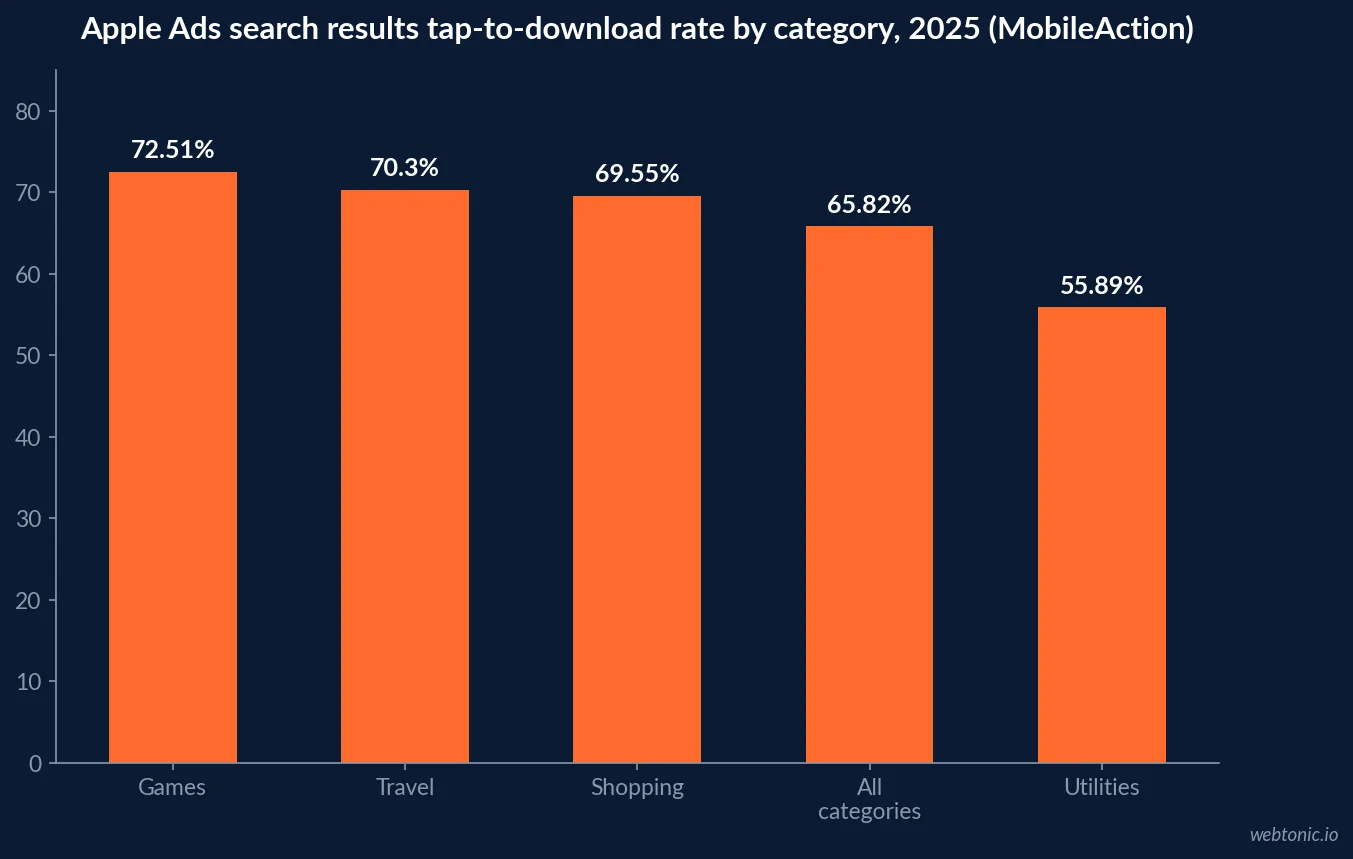
MobileAction's data comes from Apple Ads campaigns managed and measured through its MobileAction and SearchAds.com tools. Across all categories it reports a search results conversion rate of 65.82% in 2025, down slightly from 66.70% in 2024 but above the all-time average of 63.95%. Shopping rose to 69.55% from 67.21%, close to Travel (70.30%) and below Games (72.51%), the top category.
MobileAction attributes the Shopping pattern to searches that mirror user missions such as price-checking or deal discovery. The implication for retailers is that shoppers who search a store name or product type arrive ready to install; losing them happens on the page, not in the auction.
| Category | 2024 CR | 2025 CR | Change |
|---|---|---|---|
| Games | 70.22% | 72.51% | +2.29 pts |
| Travel | 69.11% | 70.30% | +1.19 pts |
| Shopping | 67.21% | 69.55% | +2.34 pts |
| Business | 64.00% | 67.22% | +3.22 pts |
| All categories | 66.70% | 65.82% | -0.88 pts |
| Utilities | 67.69% | 55.89% | -11.80 pts |
Source: MobileAction Apple Ads 2026 benchmark report, conversion rate section. Vendor data; conversion = downloads divided by taps on search results ads.
Cost Per Tap and Per Install for Retail Apps
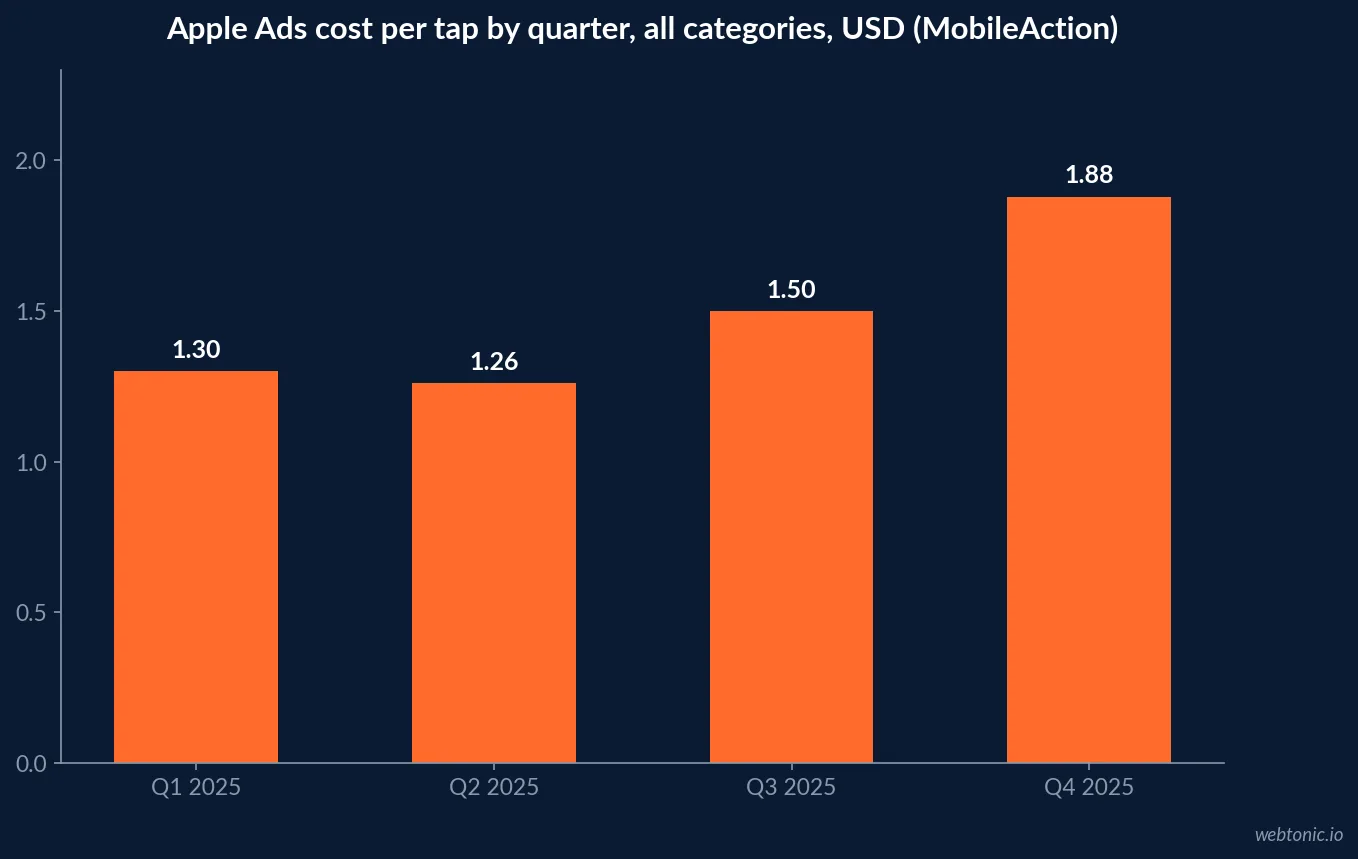
Shopping became cheaper to acquire in 2025. MobileAction reports Shopping cost per tap moving from $1.17 to $0.84 and cost per acquisition from $1.74 to $1.20. Across all categories, tap prices ran from $1.30 in Q1 to a low of $1.26 in Q2 before climbing to $1.88 in Q4, the holiday quarter when retailers compete hardest. The all-category CPA for 2025 was $2.51, down from $2.76.
Lower paid costs make organic work more, not less, relevant: every point of product page conversion reduces the cost of each install from any source. Keep in mind these figures are install costs; a retailer's real metric is cost per first purchase, which none of these benchmarks report.
Search Is the Main Door to the App Store
Apple's advertising site states that 70% of App Store visitors use search to discover apps and that almost 65% of downloads happen directly after a search. The 2025 App Store Transparency Report gives the scale: 892,670,823 average weekly visitors, 463,575,966 customer accounts searching in an average week and 929,754,061 average weekly downloads, from a catalog of 2,172,472 apps.
The same report adds a ranking signal: 1,365,649 apps appeared in the top 10 results of at least 1,000 searches in 2025. It is not a shopping-specific figure, but it shows how crowded the top 10 is. Shopping was the tenth category for app removals, at 5,760 apps taken down.
| App Store scale indicator (2025) | Value |
|---|---|
| Total apps on the App Store | 2,172,472 |
| Average weekly visitors | 892,670,823 |
| Average weekly accounts searching | 463,575,966 |
| Average weekly app downloads | 929,754,061 |
| Apps in top 10 of 1,000+ searches | 1,365,649 |
| Shopping apps removed | 5,760 |
Product Page Fields a Retailer Controls
Apple's product page guidance sets tight limits. The app name and subtitle can each be up to 30 characters, the keyword field is limited to 100 characters, promotional text runs to 170 characters and can change without a new release, and a page can show up to 10 screenshots and previews of up to 30 seconds. On Google Play, the store listing rules allow a 30-character title, an 80-character short description and a 4,000-character full description, and ban ranking or price claims such as "#1", "Best" or "10% off" in the listing.
That last rule catches retailers: the promotional instinct to put a sale in a screenshot is a policy breach on Google Play. Seasonal offers belong in Apple's promotional text or in-app events rather than in listing graphics.
Custom Product Pages and Store Listings by Category
For a retailer with many departments, one store page cannot match every search. Apple's custom product pages let an app publish up to 70 additional versions of its page, each with its own screenshots, promotional text, previews and, now, keywords that let it appear in search results. Apple reports that developers see a 2.5 percentage point increase on average when referring people to a custom page, a 156% lift on the 1.6% default average.
Adoption is rising fast. MobileAction's executive summary shows ad variations using custom pages grew from 6.56 billion to 15.80 billion impressions in 2025, and taps from 93.83 million to 271.01 million. Google Play's custom store listings allow up to 50 versions with a different name, icon, description and graphics.
Testing the Page: Apple and Google Play Experiments
Both stores offer free A/B tests. Apple's product page optimization compares icons, screenshots and previews, with up to three treatments and a test that runs for up to 90 days. Apple's own case examples include an 8% conversion increase at over 98% confidence from an icon test, and a 12-day test in which the original page without a preview video beat the treatment, contrary to the developer's hypothesis. Google's store listing experiments advise testing one asset at a time for at least a week to cover weekday and weekend traffic; Google cites Kongregate increasing installs by 45% and Tapps Games by more than 20%.
| Feature | Apple App Store | Google Play |
|---|---|---|
| Alternate store pages | Up to 70 custom product pages | Up to 50 custom store listings |
| A/B testing | Up to 3 treatments, up to 90 days | Store listing experiments, test 1+ week |
| Title length | 30 characters | 30 characters |
| Short promo text | 170 characters, no release needed | 80-character short description |
Holiday Seasonality for Shopping Apps
Retail apps live and die by the fourth quarter, and both demand and auction prices peak together. Adobe's holiday release counts $257.8 billion of US online spending from November 1 to December 31, 2025, up 6.8%, with Cyber Monday alone at $14.25 billion. Over the same quarter MobileAction saw Apple Ads cost per tap reach its 2025 high of $1.88. Store pages and custom pages built and tested in the autumn are the ones that carry that traffic.
| Holiday indicator (US, 2025) | Value | Source |
|---|---|---|
| Online spend, Nov 1 - Dec 31 | $257.8 billion (+6.8%) | Adobe Analytics |
| Cyber Week online spend | $44.2 billion (+7.7%) | Adobe Analytics |
| Cyber Monday online spend | $14.25 billion (+7.1%) | Adobe Analytics |
| Smartphone share of transactions | 56.4% (54.5% in 2024) | Adobe Analytics |
| Apple Ads CPT, Q4 2025 (all categories) | $1.88 | MobileAction |
In-App Events for Sales and Drops
Apple's In-App Events give retailers a store-level placement for time-bound moments such as a product drop or a sale. An app can have up to 10 events published on the App Store at a time and up to 15 approved in App Store Connect, submitted independently of an app update. Event names are limited to 30 characters and short descriptions to 50. Apple says repetitive activities such as daily rewards are not good candidates, so a permanent "deals" tab is not an event, while a limited-time launch is. Events appear as cards in search results and on product pages, which gives a shopping app a second chance to catch a searcher.
Why an App Matters for E-Commerce Checkout
The case for acquiring app users rests on what happens after the install. Baymard Institute rates 46% of apps as having mediocre or worse checkout UX, against 63% of mobile sites and 64% of desktop sites, and rates 7% of apps as good against 2% of mobile sites. Mobile already carries most online transactions: Adobe found that 56.4% of 2025 holiday online transactions happened on a smartphone, rising to 66.5% on Christmas Day. Pew Research Center reports that 91% of US adults own a smartphone.
Global demand for shopping apps keeps growing. Sensor Tower estimates annual e-commerce app downloads rose from 4.36 billion in 2019 to 6.35 billion in 2025, a compound annual growth rate of about 6.5%, and that Temu passed 1.2 billion cumulative downloads by October 2025.
For the web side of the funnel see our e-commerce SEO statistics, e-commerce landing page data and the cross-industry app store optimization statistics.
E-Commerce ASO Action Plan
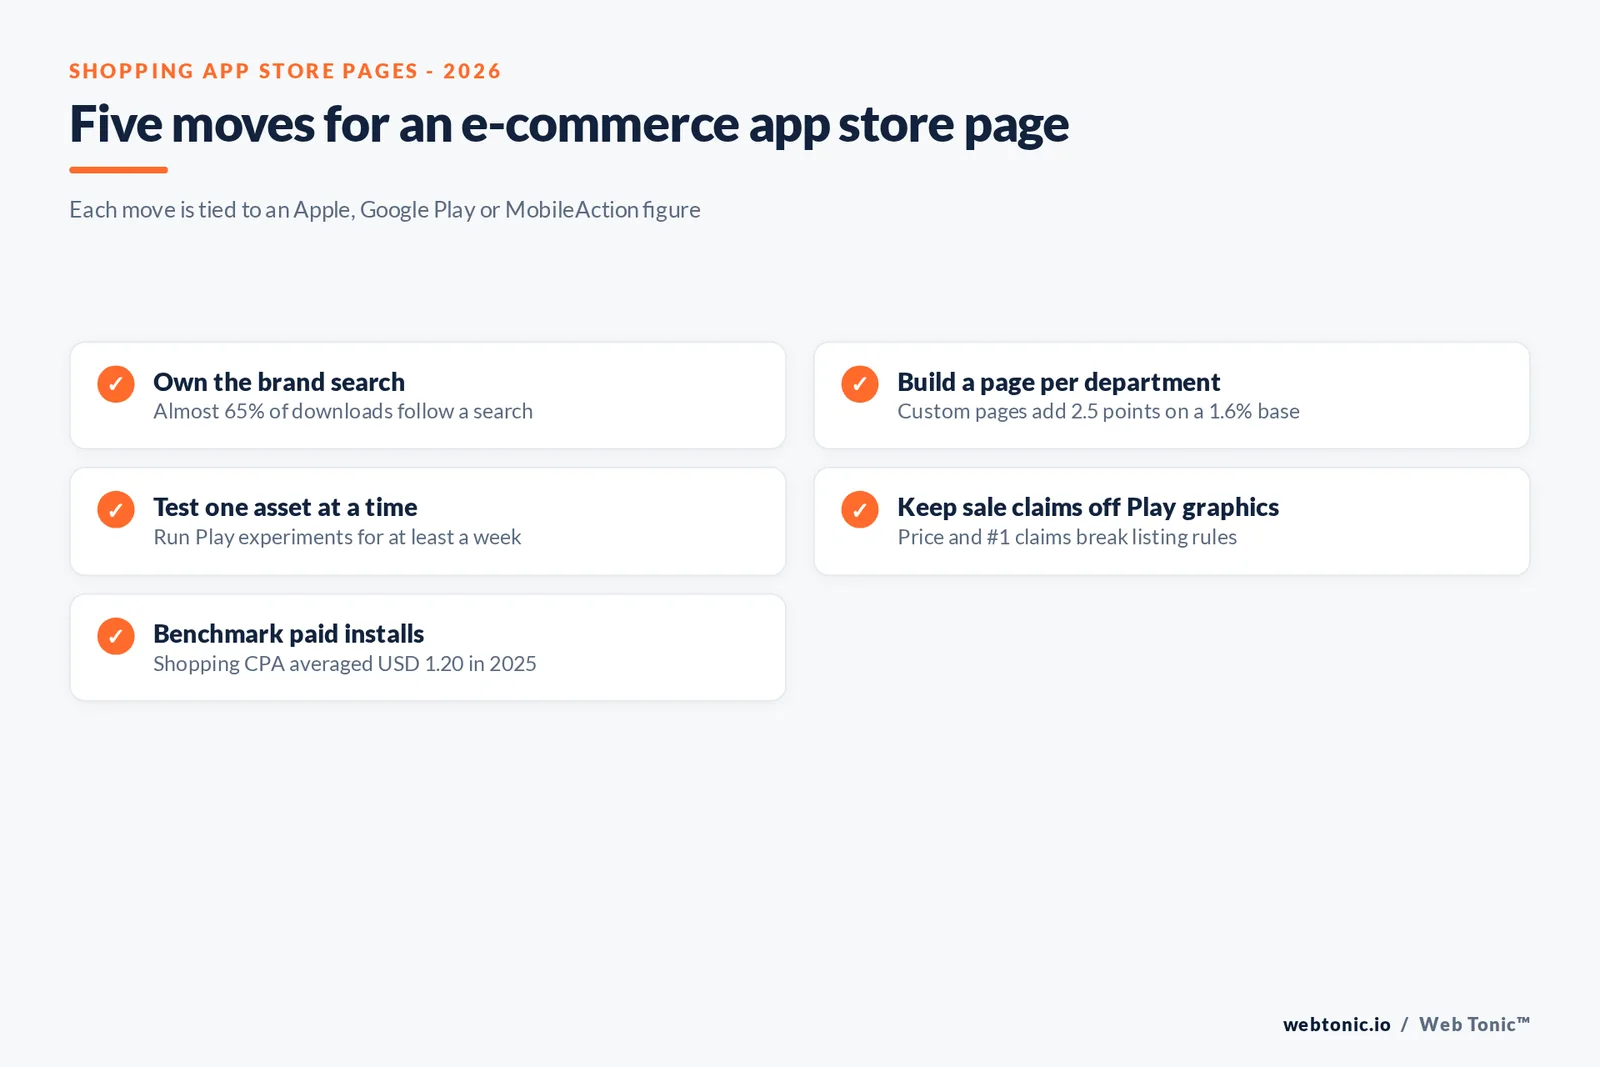
- Own the brand search: search is where almost 65% of downloads start.
- Build custom product pages per department or season and assign keywords to each.
- Run one icon or screenshot test at a time for at least a week.
- Keep prices and "#1" claims out of Google Play graphics.
- Judge paid installs against the Shopping CPA benchmark, then track cost per first purchase.
Web Tonic's performance creative team produces store-page assets; get in touch for an ASO review.
Frequently Asked Questions
What is a good App Store conversion rate for a shopping app?
For Apple Ads search results, MobileAction's 2026 benchmark report puts the Shopping category at 69.55% of taps becoming downloads in 2025, up from 67.21% in 2024, against 65.82% for all categories. That is a paid tap-to-install rate. For organic product page views, Apple says the average default product page converts at 1.6%, a different metric with a different base.
How much does an install cost for a shopping app on Apple Ads?
MobileAction reports Shopping-category cost per tap fell from $1.17 in 2024 to $0.84 in 2025 and cost per acquisition from $1.74 to $1.20. These are averages across the campaigns MobileAction and SearchAds.com measure, not a quote, and they describe installs rather than purchases.
Do custom product pages help e-commerce apps?
Apple reports that developers see a 2.5 percentage point conversion increase on average when sending people to a custom product page, a 156% lift over the 1.6% average of default pages. Retailers can build a page per category or season, and Apple now allows up to 70 per app.
How important is App Store search for shopping apps?
Very. Apple says 70% of App Store visitors use search to discover apps and almost 65% of downloads happen directly after a search. Its 2025 transparency report counts 463,575,966 customer accounts searching the App Store in an average week.
Is an app better than a mobile website for e-commerce?
For checkout usability, Baymard's 2025 benchmark rates 46% of apps mediocre or worse against 63% of mobile sites, and 7% of apps good against 2% of mobile sites. Adobe found 56.4% of 2025 holiday transactions happened on a smartphone. An app still has to earn the install first, which is where ASO comes in.
Sources
MobileAction, Apple Ads 2026 Benchmark Report (vendor)
Apple Ads, Ads on the App Store
Apple, 2025 App Store Transparency Report
Apple Developer, Custom product pages
Apple Developer, Product page
Apple Developer, Product page optimization
Google Play Console, Store listing experiments
Google Play Console, Custom store listings
Google Play Console Help, Store listing best practices
Sensor Tower, 2025 eCommerce holiday report
Adobe, 2025 Holiday Shopping Season release
Baymard Institute, Checkout UX 2025
Apple Developer, In-App Events
Pew Research Center, Mobile Fact Sheet