Table of contents
A customer segmentation model is a repeatable rule set that splits a customer base into groups with shared characteristics so each group can get different marketing, pricing or service. Ten models cover almost every case, and most businesses only need two running at once.
Key Takeaways
- 10 customer segmentation models cover the field: demographic, firmographic, geographic, behavioral, psychographic, needs-based, value or CLV-based, RFM, lifecycle, and machine-learning clusters.
- RFM scoring on quintiles produces 5 × 5 × 5 = 125 cells, which you collapse into 8 to 11 actionable segments — champions, loyal, at-risk, hibernating and so on.
- Start with 2 models, not 6: one value model to decide how much to spend on a customer, one behavioral model to decide what to say.
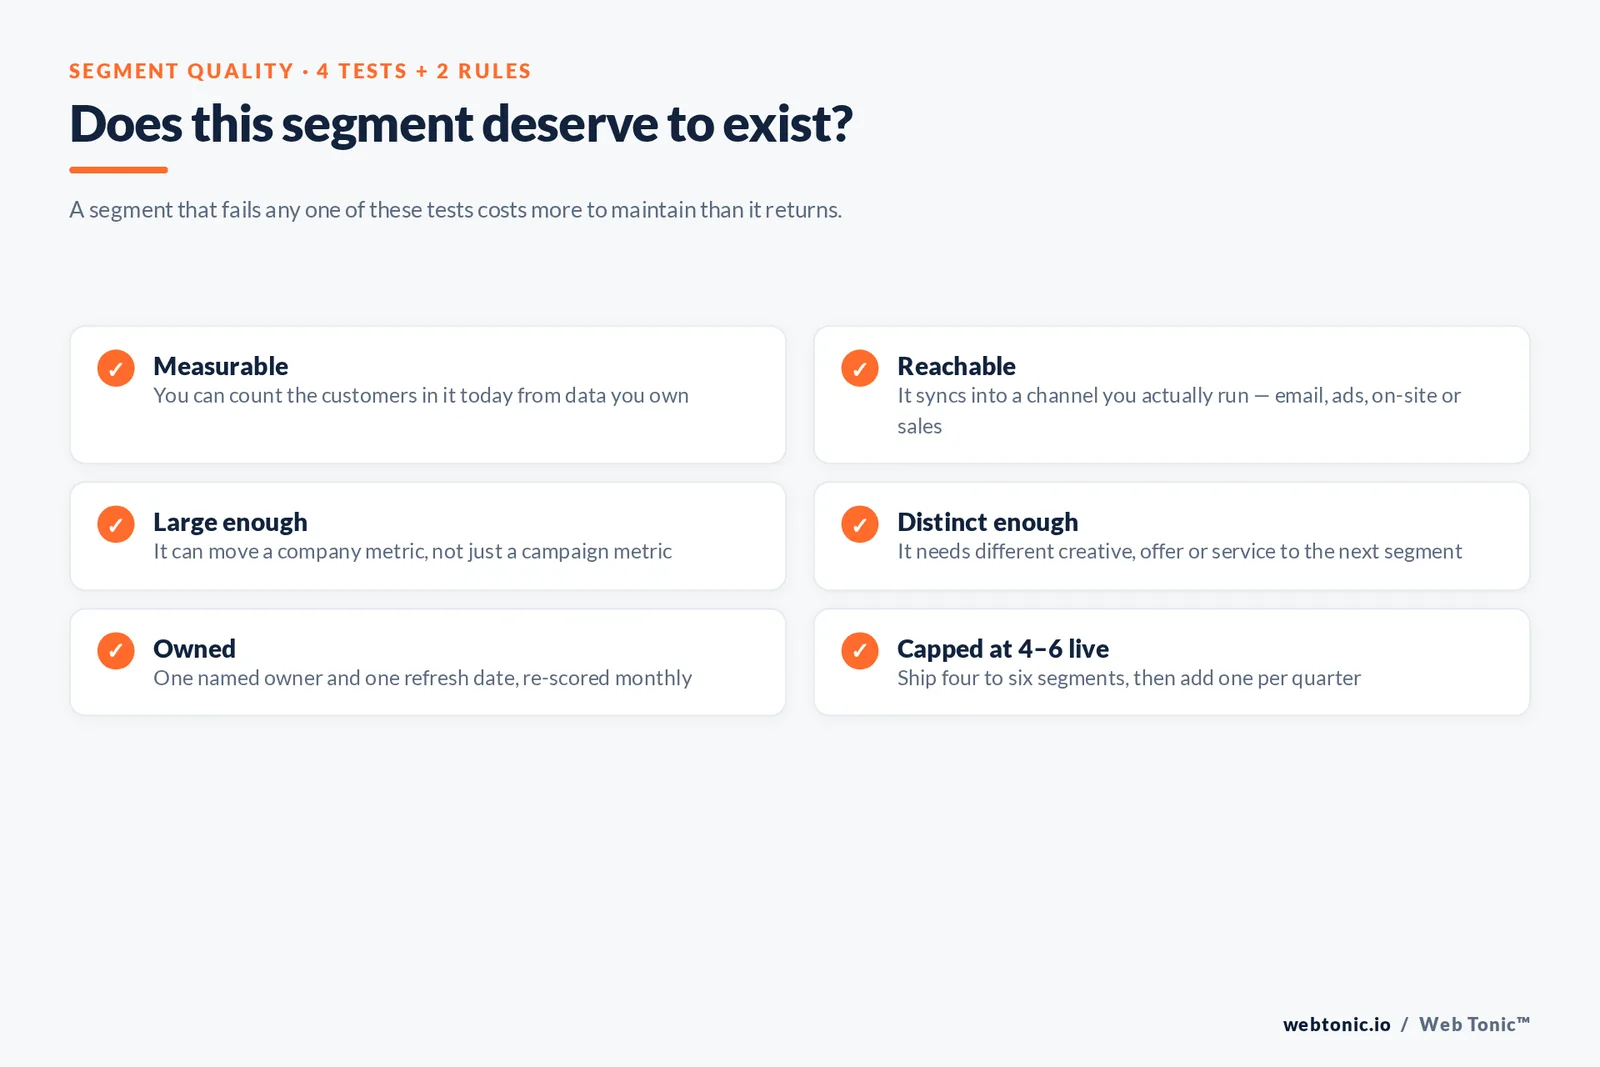
- A usable segment passes 4 tests: measurable, reachable in a real channel, large enough to matter, and different enough to deserve its own treatment.
- 3 data sources — transactions, product or site events, and CRM fields — are enough to build every model in this guide before you buy anything.
Customer segmentation models vs market segmentation
Market segmentation divides a market you may not sell to yet; customer segmentation models divide the customers you already have, using data you already own. The two are complementary: our guide to market segmentation covers the outward-facing side, while this page is about the models you run on your customer data. Both rest on the same principle of grouping people by shared characteristics, described in the reference entry on market segmentation.
| Dimension | Market segmentation | Customer segmentation |
|---|---|---|
| Population | The whole addressable market | Your existing customer base |
| Data source | Panels, surveys, third-party research | Transactions, product events, CRM |
| Typical use | Positioning, entry decisions, media planning | Retention, pricing, lifecycle marketing |
| Refresh rate | Annually | Monthly, or in real time |
| Owner | Strategy or brand | Growth, CRM and data teams |
The 10 customer segmentation models at a glance
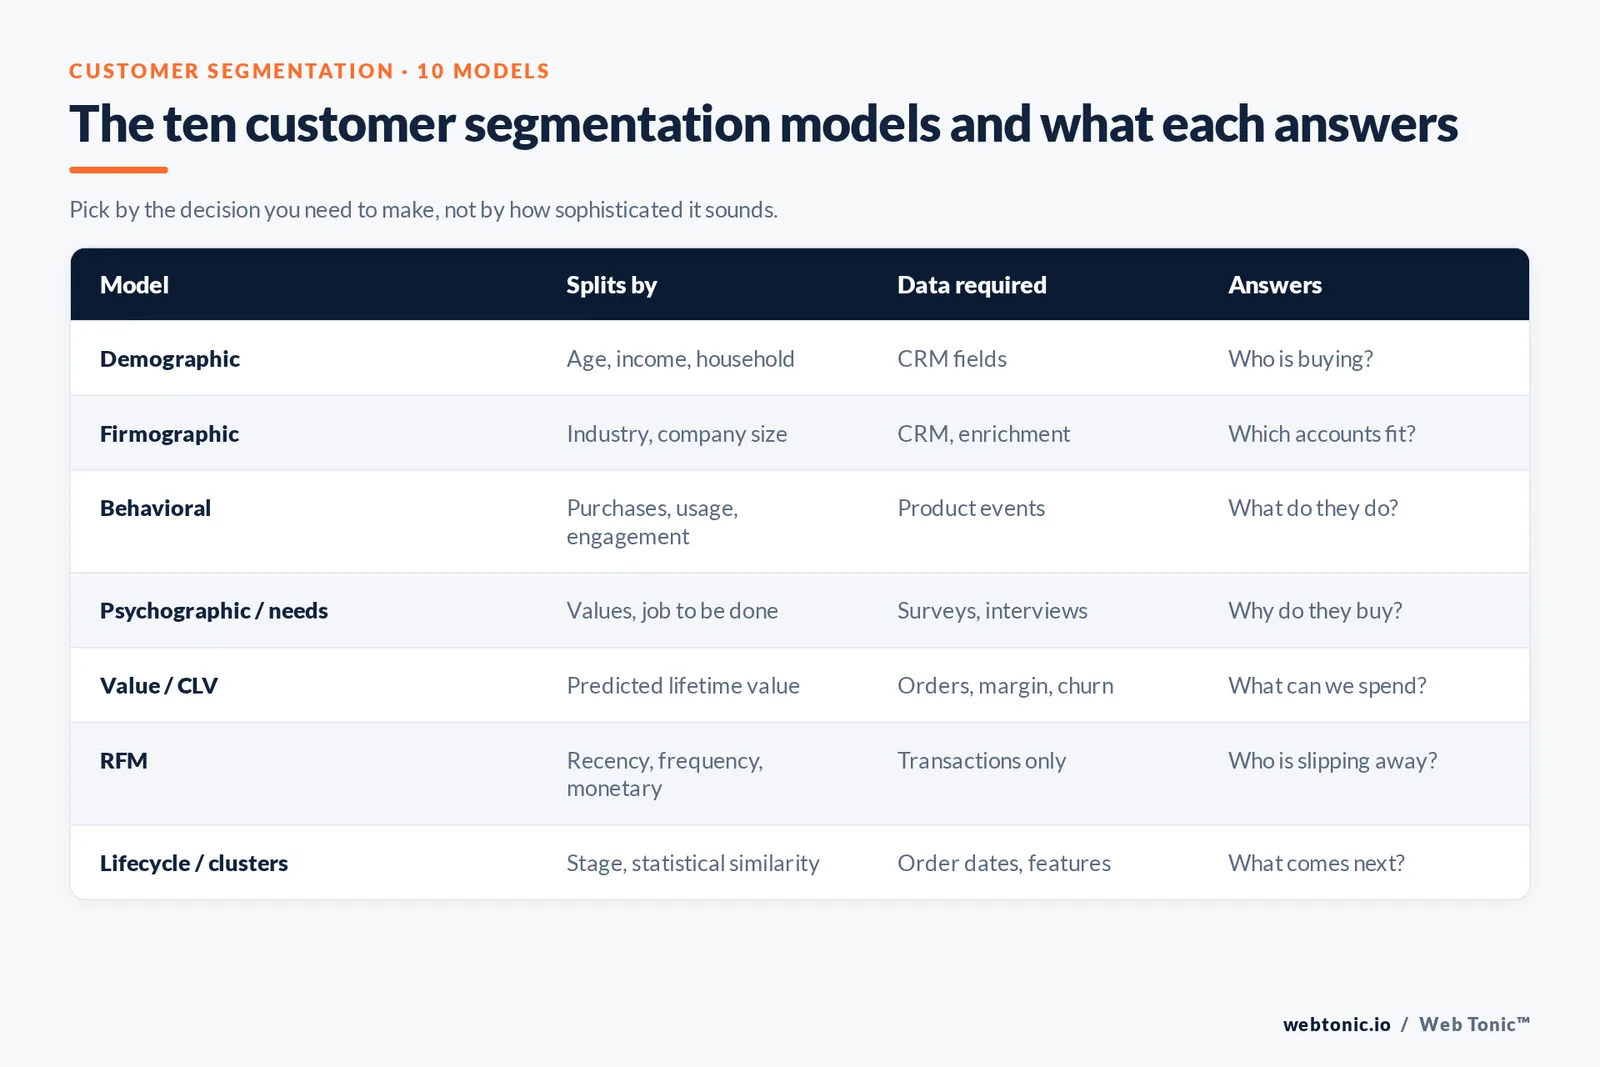
Read this table as a menu, not a checklist. Each model answers a different question, needs different customer data, and produces a different kind of segment.
| Segmentation model | Splits customers by | Data required | Answers |
|---|---|---|---|
| Demographic | Age, gender, income, household, education | CRM fields, order forms | Who is buying? |
| Firmographic (B2B) | Industry, company size, revenue, stack | CRM, enrichment | Which accounts fit? |
| Geographic | Country, region, city, climate, density | Billing address, IP | Where do we win? |
| Behavioral | Actions: purchases, usage, engagement | Product and site events | What do they do? |
| Psychographic | Values, attitudes, lifestyle, identity | Surveys, interviews | Why do they buy? |
| Needs-based | Job to be done, use case | Interviews, onboarding answers | What are they hiring us for? |
| Value / CLV-based | Predicted lifetime value, margin | Order history, margin, churn | How much can we spend to keep them? |
| RFM | Recency, frequency, monetary value | Transactions only | Who is slipping away? |
| Lifecycle stage | New, active, dormant, churned, won-back | First and last order dates | What comes next for them? |
| Machine learning clusters | Statistical similarity across many variables | Clean feature table, 5k+ customers | What patterns did we miss? |
Demographic and firmographic segmentation
Demographic segmentation groups customers by age, gender, income and household composition. It is the cheapest model to build and, on its own, the weakest predictor of behaviour, which is why it works best as a descriptive layer on top of a value or behavioral model. In B2B the equivalent is firmographic segmentation, which uses industry, employee count, revenue band and technology stack.
| Segment example | Defining variables | Marketing implication |
|---|---|---|
| Young urban renters | Age 22–29, renting, metro postcode | Small-basket, mobile-first offers |
| Established families | Age 35–49, 2+ children, suburban | Bundles, subscriptions, convenience |
| High-income empty nesters | Age 55+, top income quintile | Premium tiers, service, warranties |
| SMB accounts (B2B) | Under 50 employees, self-serve signup | Product-led onboarding, no sales touch |
| Mid-market accounts (B2B) | 50–999 employees, procurement process | Assisted sales, security review pack |
| Enterprise accounts (B2B) | 1,000+ employees, multi-stakeholder | Named account plans, custom pricing |
Rule 1 — never ship a demographic segment alone. Two customers with identical age and income can differ by 10x in spend, and the spend gap is the one that changes your marketing budget.
Behavioral segmentation
Behavioral segmentation groups customers by what they actually do: which products they buy, how often they use the service, which features they touch, how they respond to campaigns. It is the highest-signal model for most businesses because behaviour is observed rather than declared. Rule 2 — 6 behavioural rules covering purchase, usage, engagement, support, discount sensitivity and browse intent are enough to run a full lifecycle programme.
| Behavioral segment | Rule | Best next action |
|---|---|---|
| Power users | Active 20+ days in the last 30 | Ask for reviews and referrals |
| Single-category buyers | 3+ orders, all in 1 category | Cross-sell the adjacent category |
| Discount-only buyers | 100% of orders used a promo code | Test full-price value messaging |
| Browse-no-buy | 5+ product views, 0 orders in 60 days | Objection-handling content, sizing help |
| Feature-stalled (SaaS) | Logged in, 0 core actions in 14 days | In-product guidance, onboarding call |
| Support-heavy | 3+ tickets per quarter | Fix the root cause before upselling |
Zendesk's overview of customer segmentation and Amplitude's product-analytics guide to behavioural segments both build from event data of this shape.
Psychographic and needs-based segmentation
Psychographic segmentation groups people by values, attitudes and lifestyle; needs-based segmentation groups them by the job they are hiring the product to do. Neither can be derived from transactions, so both need 12 to 20 customer interviews or a survey with a consistent question set. Survey panels such as GWI's audience research and long-running attitudinal datasets from Pew Research Center are useful calibration, but your own onboarding question — "what are you trying to get done?" — usually outperforms them.
| Need segment | Job to be done | Message that lands | Worst message |
|---|---|---|---|
| Time-poor pragmatist | Get it done in under an hour | Setup in 15 minutes, done for you | Feature depth and customisation |
| Cost-controller | Cut a line item by 20% | Payback period and total cost | Premium craftsmanship |
| Status seeker | Signal quality to peers | Provenance, limited runs, design | Discount stacking |
| Risk-averse buyer | Avoid a bad decision | Guarantees, references, certifications | Move fast, launch today |
| Builder / tinkerer | Bend the tool to a workflow | API, exports, integrations | Simplicity above all |
Geographic segmentation
Geographic segmentation splits the customer base by country, region, city, urban density or climate. It earns its place when fulfilment cost, regulation, language, seasonality or competitive intensity differ by location — which is most local service businesses and most retailers. Fact 4 — 5 geographic cuts (country, region, metro, density, climate) cover nearly every practical case. The US Census Bureau retail programme publishes the regional and e-commerce baselines worth benchmarking against, and online shopping topic data is useful for channel mix by market.
| Geographic cut | Why it changes marketing | Example decision |
|---|---|---|
| Country | Language, currency, tax, privacy law | Localise checkout and consent banners |
| Region / state | Delivery times, tax, seasonality | Shift budget by shipping cost |
| City / metro | Service coverage, competitor density | Bid up where a crew is available |
| Urban vs rural | Basket size, delivery economics | Different free-shipping thresholds |
| Climate zone | Demand seasonality | Rotate creative 6 weeks earlier in the south |
RFM: the fastest model to build
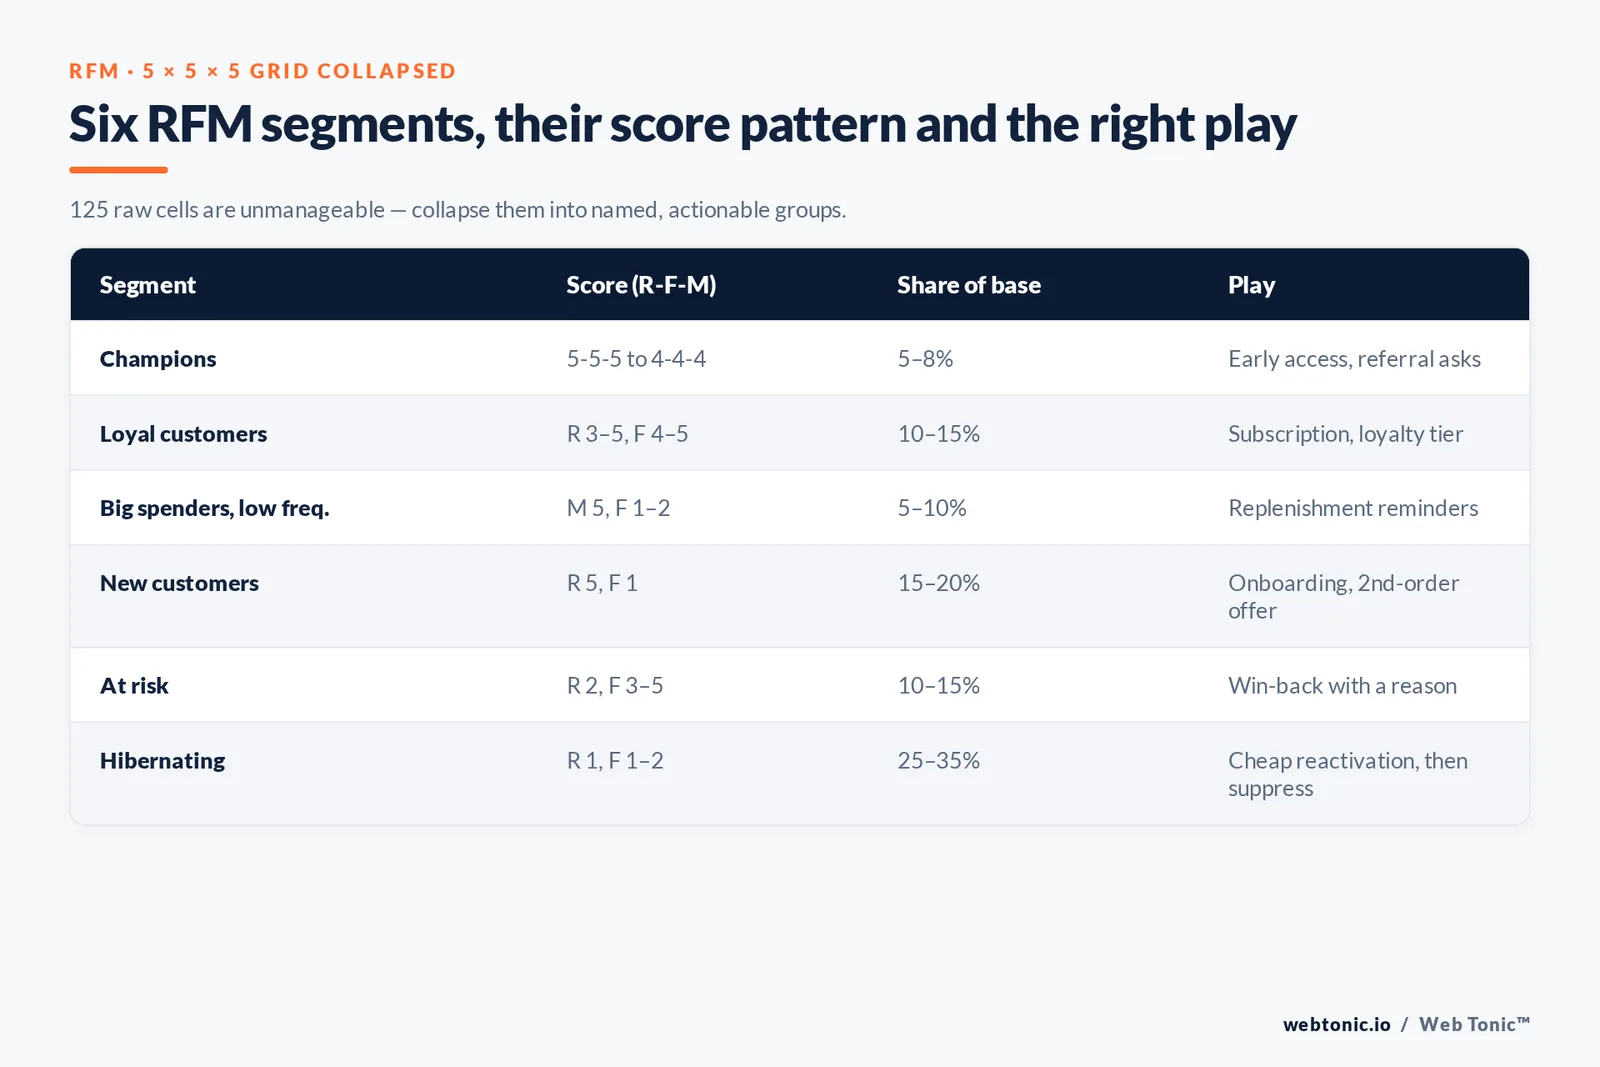
The RFM model scores every customer on recency, frequency and monetary value, usually as quintiles from 1 to 5. It needs nothing but a transactions table, which is why it is the right first model for almost every retailer. Limit 2 — 125 raw cells is unmanageable, so collapse the grid into named segments.
| RFM segment | Score pattern (R-F-M) | Share of a typical base | Play |
|---|---|---|---|
| Champions | 5-5-5 to 4-4-4 | 5–8% | Early access, referral asks, no discounts |
| Loyal customers | R 3–5, F 4–5 | 10–15% | Subscription, bundles, loyalty tier |
| Big spenders, low frequency | M 5, F 1–2 | 5–10% | Replenishment reminders, concierge |
| New customers | R 5, F 1 | 15–20% | Onboarding series, second-order offer |
| At risk | R 2, F 3–5 | 10–15% | Win-back with a reason, not just a code |
| Hibernating | R 1, F 1–2 | 25–35% | Cheap reactivation, then suppress |
Value-based segmentation and CLV tiers
Value-based models rank customers by what they are worth over time rather than what they spent last month. The standard simplification of customer lifetime value is average revenue per account × gross margin ÷ churn rate; the output sets the ceiling on acquisition and retention spend per segment. Limit 5 — spend no more than 15% of gross margin holding on to a Tier 1 customer, and effectively nothing on negative-margin accounts.
| CLV tier | Definition | Retention spend | Service level |
|---|---|---|---|
| Tier 1 | Top 10% of predicted LTV | Up to 15% of gross margin | Named contact, priority queue |
| Tier 2 | Next 20% | Up to 10% | Proactive check-ins |
| Tier 3 | Middle 40% | Up to 5% | Automated lifecycle programmes |
| Tier 4 | Bottom 30% | Under 2% | Self-serve only |
| Negative margin | Returns or support cost exceed margin | 0 | Fix the policy causing it |
Harvard Business Review's ongoing coverage of customer strategy is a good corrective here: value tiers are for allocating effort, not for treating people worse.
Lifecycle and machine-learning models
Lifecycle segmentation is the model most businesses can implement in an afternoon: first order date, last order date, and 5 stage thresholds. Machine-learning clustering — usually k-means on a scaled feature table — is the model most businesses adopt too early. Rule 3 — clustering needs 5,000+ customers and a clean feature table, or it just rediscovers your product catalogue.
| Model | Prerequisite | Typical output | Failure mode |
|---|---|---|---|
| Lifecycle stage | Order dates only | 5 stages: new, active, lapsing, dormant, won-back | Thresholds copied from another industry |
| K-means clusters | 5,000+ customers, scaled features | 4–7 clusters needing human naming | Clusters nobody can act on |
| Propensity model | Labelled outcomes, 6+ months history | Score 0–1 per customer per action | Leaky features inflate accuracy |
| Churn-risk model | Clear churn definition | Risk decile per account | Predicting churn nobody can prevent |
| Look-alike expansion | Seed list of 1,000+ Tier 1 customers | Prospect audiences in ad platforms | Seeding from all buyers, not best buyers |
Customer segmentation examples from well-known companies
These examples are drawn from what each company publicly shows in its products and marketing. They help identify which model fits your own products and services.
| Company | Model it leans on | What customers see | What you can copy |
|---|---|---|---|
| Amazon | Behavioral, purchase and browse history | Recommendations tied to past behavior | Recommend from category behavior, not demographics |
| Spotify | Usage clusters on listening data | Personalised playlists and yearly recaps | Turn usage analysis into a shareable artefact |
| Netflix | Taste clusters plus lifecycle stage | Row ordering and artwork per profile | Reorder the page, do not just change the email |
| Sephora | Value tiers in a loyalty programme | Named tiers with escalating benefits | Make the value tier visible and earnable |
| Nike | Needs-based by sport and goal | Sport-specific apps, products and services | Segment by the job, then build the content |
| HubSpot | Firmographic by company size | Different pricing and onboarding per tier | Let company size set the sales motion |
Customer segmentation analysis: tools that create the segments
Most brands do not need new software to create their first segments. This table maps each analysis step to the tools that already exist in a typical stack, and to what you should learn from the output.
| Analysis step | Tools that do it | Output | What it helps you identify |
|---|---|---|---|
| Pull the customer base | Ecommerce or billing export, SQL | One row per customer | How concentrated revenue really is |
| Score recency and frequency | Spreadsheet quintiles, dbt, Python | RFM scores 1–5 | Which groups are slipping away |
| Analyse behavior | Product analytics, GA4 explorations | Event-based cohorts | Which actions predict retention |
| Cluster the data | Python, R, warehouse ML functions | 4–7 unnamed clusters | Patterns your rules missed |
| Name and document | A one-page definition per segment | Shared vocabulary | Whether the team can act on it |
| Sync and measure | CDP, email platform, ad audiences | Live lists and reporting lines | Whether the strategies paid off |
Choosing the right model for your business
Pick by business model and by the decision you need to make this quarter, then add a second model only when the first is running in production. Rule 7 — 2 models in production beat 6 on a slide.
| Business type | Start with | Add second | Skip for now |
|---|---|---|---|
| Ecommerce, repeat purchase | RFM | Category behaviour | Psychographic surveys |
| Ecommerce, one-off purchase | Needs-based | Geographic | RFM frequency scores |
| Subscription / SaaS | Behavioral usage | CLV tiers | K-means clustering |
| B2B services | Firmographic | Needs-based | Demographic |
| Local service business | Geographic | Lifecycle | Propensity modelling |
| Marketplace | Supply vs demand side | Behavioral | Value tiers on new users |
A segment only earns a place in the plan if it passes four tests: it is measurable, reachable in a channel you actually run, big enough to move a number, and different enough to justify separate creative. The SBA's marketing guidance makes the same point for small businesses with limited budgets.
Data you need, and where it lives
| Data type | Source system | Powers which models | Common gap |
|---|---|---|---|
| Transactions | Ecommerce or billing platform | RFM, CLV, lifecycle | Refunds not netted out |
| Product / site events | Analytics or product tooling | Behavioral, propensity | Events renamed between releases |
| CRM fields | CRM | Firmographic, demographic | Free-text industry fields |
| Support history | Helpdesk | Margin-adjusted value tiers | Not joined to customer ID |
| Survey responses | Survey tool | Psychographic, needs-based | Too few responses per segment |
| Margin data | Finance | All value models | Blended margin hides the tail |
Activating segments across channels
A model that never leaves the spreadsheet changes nothing. Trap 6 — a segment synced to only 1 channel typically delivers a fraction of its potential, because email alone cannot carry suppression, bidding and on-site logic. Push each segment into the systems that spend money: email and SMS flows, ad platform audiences, on-site personalisation, and the sales queue. In practice that means synced audience lists — analytics audiences exported to the ad account, and first-party lists uploaded through customer match.
| Segment | Email / SMS | Paid media | On-site | Metric to watch |
|---|---|---|---|---|
| Champions | Referral and early-access sends | Suppress, use as look-alike seed | Loyalty prompts | Referral rate |
| At risk | 3-step win-back sequence | Retargeting cap 14 days | Reorder shortcut | Reactivation rate |
| New customers | Onboarding series, 5 emails | Exclude from acquisition | Second-order incentive | Repeat rate at 90 days |
| Tier 1 value | Human-written, low frequency | Seed list for expansion | Priority support entry | Net revenue retention |
| Discount-only | Full-price value messaging test | Exclude from promo campaigns | Bundle instead of code | Gross margin per order |
| Browse-no-buy | Objection-handling content | Dynamic retargeting | Sizing or spec guidance | View-to-order rate |
Our growth marketing and data intelligence teams build these syncs as one workflow, because a segment definition that lives in two systems drifts within a quarter.
Proving the model worked
| Metric | How to read it | Target movement in 90 days |
|---|---|---|
| Repeat purchase rate | Share of customers with 2+ orders | +2 to +5 points |
| Revenue per recipient | Segmented vs batch sends | Segmented ahead by 20%+ |
| Reactivation rate | At-risk customers who reorder | 5–12% of the segment |
| Gross margin per order | Watch discount-led segments | Flat or up, never down |
| Net revenue retention | Tier 1 and Tier 2 accounts only | Above 100% |

Common segmentation mistakes
| Mistake | Consequence | Fix |
|---|---|---|
| Building 20 segments at once | No campaign gets built for any of them | Ship 4 to 6, add one per quarter |
| Segments with no owner | Definitions rot inside 3 months | 1 owner and 1 refresh date per segment |
| Personas instead of models | Nice slides, no targetable list | Every persona maps to a data rule |
| Copied thresholds | A 90-day lapse rule on a yearly product | Derive thresholds from your own gaps |
| Never re-scoring | Champions who churned 6 months ago | Re-score monthly, automate it |
| Value tiers used as service tiers | Brand damage and bad reviews | Vary proactive effort, not basic quality |
If you want a second opinion before rebuilding your customer data model, the Web Tonic blog covers the reporting side, and you can reach the team through contact.
FAQ: customer segmentation model questions
How many customer segments should a business have?
Four to six active segments is the practical range for most companies. Each one needs its own creative, offer and reporting line, so the limit is team capacity rather than data. Large retailers running automated lifecycle programmes can support 8 to 11 RFM-derived segments because the sends are templated.
Which customer segmentation model should I start with?
If you have transactions and repeat purchases, start with RFM: it needs one table and produces immediately actionable groups. Subscription and SaaS businesses should start with behavioral usage segments instead, because usage predicts renewal better than order recency. B2B services start firmographic.
What data do I need to build customer segments?
Three sources cover every model in this guide: a transactions table with dates, amounts and refunds; product or site event data keyed to a customer ID; and CRM fields for firmographic or demographic attributes. Survey data is only needed for psychographic and needs-based models.
How often should segments be refreshed?
Re-score behavioural and RFM segments monthly, or nightly if the ad and email platforms consume the lists automatically. Refresh CLV tiers quarterly, since margin and churn inputs move slowly. Needs-based and psychographic segments hold for 12 to 18 months between research rounds.
Is machine learning better than rule-based segmentation?
Not usually, and not first. Rule-based models such as RFM and lifecycle stages are transparent, easy to explain to a marketing team, and quick to act on. Clustering earns its place once you have more than 5,000 customers, clean features, and a specific question that simple rules have failed to answer.
Sources
Wikipedia — RFM (market research), Customer lifetime value, K-means clustering, Market segmentation · Zendesk — Customer segmentation · Amplitude — Customer segmentation · Harvard Business Review — Customer strategy topic · GWI — Audience reports · Pew Research Center — Internet and broadband fact sheet · Statista — Online shopping topic · US Census Bureau — Retail trade and quarterly e-commerce programme · US Small Business Administration — Marketing and sales guidance · Google Analytics Help — Audiences · Google Ads Help — Customer Match. Retrieved August 2026.