



Table of contents
A conversion funnel is the step-by-step path visitors follow from first discovering your brand to completing a desired action such as a purchase, sign-up, or demo request. Understanding where prospects drop off inside that funnel is the single fastest way to increase revenue without spending more on advertising.
Key Takeaways
- The average website conversion rate across industries is 5.13% in 2026, up from roughly 3.9% in prior years, according to Ruler Analytics data covering 13 sectors.
- B2B sales funnels average a 1–5% visitor-to-customer conversion rate, with top performers reaching 5% or higher through systematic funnel optimization.
- Only 32% of companies actively document their funnel performance, yet those that do achieve 2.3× higher ROI on their marketing spend.
- The MQL-to-SQL stage is the biggest bottleneck in B2B funnels, converting at just 15–21% on average. Improving this stage by 5 points can lift revenue by up to 18%.
- Personalizing landing page content by audience segment can boost conversion rates by up to 202%, making segmentation a critical lever at every funnel stage.
- Retargeting ads convert funnel drop-offs at 2–4× the rate of cold traffic, making them essential for mid- and bottom-funnel recovery.
What Is a Conversion Funnel?
A conversion funnel — also called a sales funnel or marketing funnel — is a visual model that maps the journey prospects take from initial awareness to a final conversion. The funnel shape reflects a natural reality: many people enter the top, but only a fraction complete the desired action at the bottom.
Marketers use funnels to identify friction points, measure drop-off rates between stages, and test improvements that guide more visitors toward conversion. Whether you sell SaaS subscriptions, run an ecommerce store, or generate B2B leads, the funnel framework gives you a structured way to diagnose where you are losing potential customers and why.
The 4 Core Stages of a Conversion Funnel

Every conversion funnel follows a progression through four primary stages. Understanding what happens at each stage — and what data to track — is the foundation of any optimization effort.
| Funnel Stage | Goal | Key Channels | Primary Metric |
|---|---|---|---|
| Awareness | Attract new visitors and introduce your brand | SEO, social media, display ads, content marketing | Impressions, reach, new sessions |
| Interest | Engage visitors and capture lead information | Blog posts, lead magnets, email opt-ins, webinars | Email sign-ups, time on page, pages per session |
| Consideration | Nurture leads and build purchase intent | Email sequences, case studies, retargeting ads, demos | MQL-to-SQL rate, demo requests, cart additions |
| Conversion | Close the sale or secure the sign-up | Landing pages, checkout flows, sales calls, free trials | Conversion rate, revenue, cost per acquisition |
Some marketers add a fifth stage — retention or advocacy — to capture post-purchase behavior like repeat purchases, referrals, and reviews. For this guide, we focus on the four stages that drive initial revenue.

Conversion Rate Benchmarks by Industry
Before optimizing your conversion funnel, you need to know where you stand relative to your industry peers. The overall average conversion rate across 13 industries is 5.13% in 2026, based on data from Ruler Analytics tracking over 5 million conversions. However, rates vary dramatically by sector.
| Industry | Avg. Conversion Rate | Primary Conversion Type |
|---|---|---|
| Automotive | 7.9% | Phone calls, test drive bookings |
| Legal | 7.9% | Consultation requests, form fills |
| Education | 6.3% | Enrollment inquiries, info requests |
| Finance | 6.3% | Quote requests, account sign-ups |
| Marketing & Advertising | 6.2% | Demos, lead forms |
| Professional Services | 6.1% | Contact forms, consultations |
| Construction | 4.9% | Quote requests, phone calls |
| Beauty & Cosmetic | 3.5% | Product purchases, bookings |
| Real Estate | 2.8% | Showing requests, inquiries |
| Health & Social Care | 2.3% | Appointment bookings |
Automotive and legal lead the pack at 7.9% because both industries attract high-intent searchers — people who already know they need a service. By contrast, health and real estate tend to have longer decision cycles, which naturally suppresses top-line conversion rates.
Essential Conversion Funnel Metrics to Track
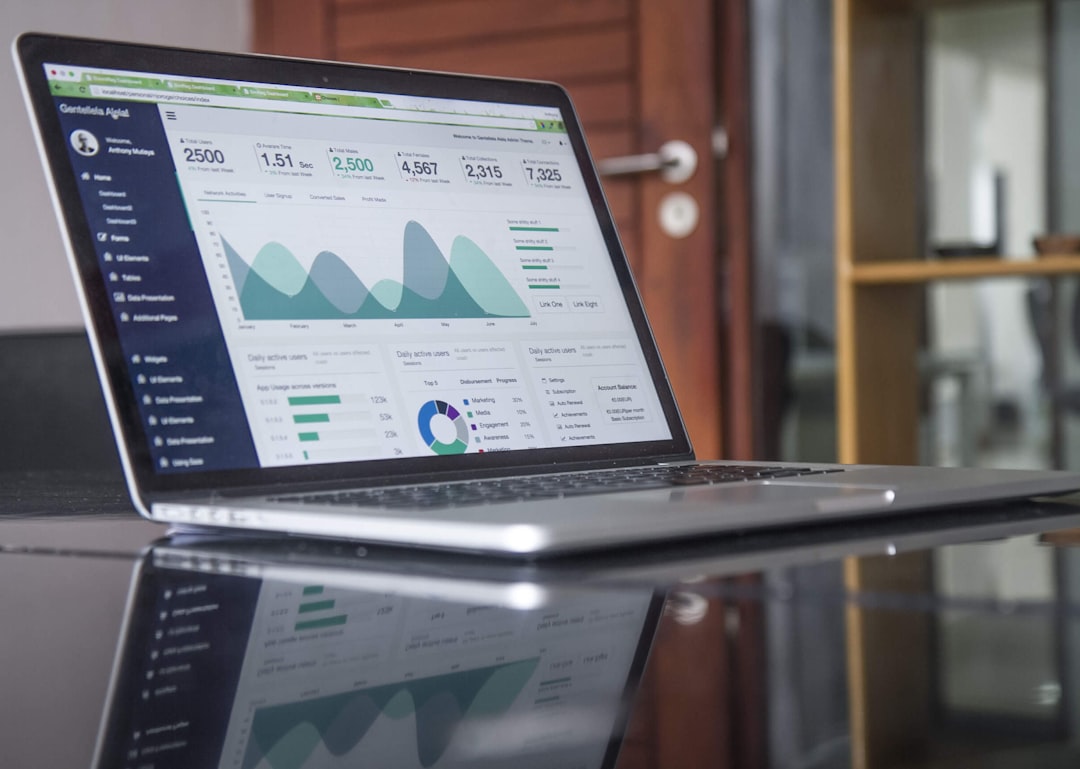
Optimizing a conversion funnel starts with measuring the right data at every stage. Without clear metrics, you are guessing rather than making decisions grounded in performance. Here are the KPIs that matter most at each level.
- Top-of-funnel: Cost per click (CPC), click-through rate (CTR), new visitor sessions, and bounce rate (industry average: 41–55%).
- Mid-funnel: Lead-to-MQL conversion rate, email open and click rates, average time-to-MQL (median: 12–18 days in B2B), and content engagement depth.
- Bottom-of-funnel: MQL-to-SQL rate (15–21% average in B2B), proposal-to-close rate, cost per acquisition (CPA), and customer lifetime value (CLV).
- Post-conversion: Retention rate, net promoter score (NPS), and repeat purchase rate (30–40% benchmark for healthy ecommerce brands).
The most effective teams tie these metrics into a unified data intelligence dashboard where every stage's performance feeds a single source of truth. Pipeline velocity — measured as revenue per day moving through the funnel — averages $743–$2,456/day depending on industry and deal size.

10 Proven Strategies to Optimize Your Conversion Funnel
Improving your conversion funnel is not about overhauling everything at once. It is about identifying the weakest stage, applying a targeted fix, and measuring the impact before moving on. These strategies are ordered from top-of-funnel to bottom.
1. Segment and Personalize at the Awareness Stage
Build detailed customer personas based on demographics, behavior, and purchase intent. Personalized landing pages can boost conversion rates by up to 202% compared to generic pages. Use tools like Google Analytics audience segments or CRM data to serve different messages to different visitor cohorts.
2. Reduce Landing Page Friction
Every extra form field reduces completion rates by roughly 11%. Audit your landing pages for unnecessary fields, slow load times, and unclear calls to action. Mobile page speed is especially critical — 53% of mobile visitors abandon pages that take longer than 3 seconds to load.
3. Use Content Mapping to Match Funnel Stages
Map every piece of content — blog posts, whitepapers, videos — to a specific funnel stage. Top-of-funnel content should educate and attract; mid-funnel content should build trust through case studies and comparisons; bottom-of-funnel content should remove objections with testimonials and live demos.
4. Implement Behavioral Retargeting
Retargeting ads reach visitors who left your funnel and convert them at 2–4× the rate of cold traffic. Set up audience segments for cart abandoners, pricing page viewers, and blog readers who did not opt in. Frequency caps of 3–5 impressions per week prevent ad fatigue.
5. A/B Test Calls to Action Continuously
Small CTA changes — button color, copy phrasing, placement — can swing conversion rates by 20–30%. Run sequential tests rather than simultaneous multivariate experiments when traffic volume is limited.
6. Streamline Checkout and Sign-Up Flows
For ecommerce, the average cart abandonment rate sits at 70.19% (Baymard Institute). Guest checkout options, progress indicators, and trust badges address the top three abandonment reasons: unexpected costs, forced account creation, and security concerns.
7. Deploy Lead Scoring to Prioritize Sales-Ready Prospects
Assign point values to lead actions (page visits, email clicks, demo requests) and only pass leads above a threshold to sales. Companies using lead scoring see a 77% increase in lead generation ROI.
8. Automate Email Nurture Sequences
Automated email sequences produce 320% more revenue per email than non-automated campaigns. Build drip campaigns that trigger based on funnel behavior — a downloaded ebook triggers a case study, which triggers a demo invite.
9. Align Sales and Marketing on Funnel Definitions
Misalignment between marketing and sales on what constitutes an MQL versus SQL causes up to 60–70% of B2B content to go unused. Document shared definitions, hold weekly pipeline reviews, and create service-level agreements (SLAs) for follow-up speed.
10. Analyze and Iterate Monthly
Schedule monthly funnel audits that review stage-by-stage conversion rates, identify new drop-off points, and prioritize the next round of experiments. Teams that conduct monthly funnel reviews close deals 28% faster than those that review quarterly.
B2B vs. B2C Conversion Funnels: Key Differences
While the funnel framework applies to both B2B and B2C, the dynamics are fundamentally different. Understanding these differences prevents you from applying the wrong benchmarks or tactics to your business model.
| Dimension | B2B Funnel | B2C Funnel |
|---|---|---|
| Sales Cycle | 84 days median (optimal 46–75 days) | Minutes to days |
| Decision Makers | 3–7 stakeholders on average | Typically 1 individual |
| Average Deal Size | $26,265 median (private SaaS) | $50–$200 typical |
| Conversion Rate | 1–5% visitor-to-customer | 2–8% depending on industry |
| Top Channel | Organic search, LinkedIn, webinars | Paid social, Google Shopping, email |
| Key Bottleneck | MQL → SQL (15–21%) | Cart → Purchase (29.81% completion) |
B2B funnels require more touchpoints — B2B buyers engage with an average of 13 pieces of content before contacting sales. B2C funnels prioritize speed and emotional triggers, where urgency and social proof drive faster decisions.
Common Conversion Funnel Mistakes to Avoid
Even experienced marketing teams make errors that silently drain funnel performance. Here are the most frequent pitfalls:
- Ignoring micro-conversions: Focusing only on the final conversion misses valuable signals like email sign-ups, video completions, and content downloads that indicate intent.
- Running traffic without tracking: 41% of marketers cite measuring ROI as their top challenge. Without proper attribution and funnel analytics, you cannot identify which campaigns feed which funnel stages.
- One-size-fits-all messaging: Serving the same message to cold visitors and warm leads wastes budget and dilutes relevance. Segment every campaign by funnel stage.
- Neglecting mobile: Over 60% of web traffic now comes from mobile devices. If your funnel is not optimized for mobile — fast load, thumb-friendly buttons, simplified forms — you are losing the majority of your potential customers.
- Stopping at the sale: Post-purchase email flows, loyalty programs, and upsell sequences extend customer lifetime value by 25–95% (Harvard Business Review).
Related reading
- Top of Funnel Marketing: Tactics, Content Types, and How to Measure It
- How to Create a Marketing Funnel: Step-by-Step Guide With Benchmarks
- High Ticket Agency Funnel: How to Build a Sales Funnel That Converts Premium Clients
- Marketing Strategy Consulting services at Web Tonic
FAQ
What is the difference between a conversion funnel and a sales funnel?
The terms are often used interchangeably. A sales funnel typically focuses on the sales team's pipeline — from lead to close. A conversion funnel is broader, encompassing every marketing and sales touchpoint from the first ad impression to the final purchase. In practice, most modern teams use "conversion funnel" to describe the end-to-end journey tracked through analytics platforms.
How do I calculate my funnel conversion rate?
Divide the number of people who complete a desired action by the number who entered that funnel stage, then multiply by 100. For example, if 10,000 visitors land on your site and 513 convert, your overall conversion rate is 5.13%. Track each stage separately to pinpoint where prospects drop off.
How long does it take to see results from funnel optimization?
Small changes like CTA copy or form length adjustments can show measurable lift within 2–4 weeks if you have sufficient traffic. Structural changes — new landing pages, revised email sequences, or lead scoring implementation — typically require 60–90 days of data before drawing reliable conclusions.
What tools do I need to build a conversion funnel?
At minimum, you need an analytics platform (Google Analytics 4), a landing page builder, an email marketing tool, and a CRM. Advanced setups add heat-mapping software, A/B testing platforms, and a business intelligence layer that consolidates data across channels into a single dashboard.
Is a conversion funnel still relevant with AI-driven marketing?
Yes. AI enhances funnel performance — through predictive lead scoring, dynamic content personalization, and automated bid optimization — but it does not replace the funnel framework. The funnel remains the strategic map; AI is the engine that accelerates movement through it.
Sources
Ruler Analytics — Conversion Rate Benchmarks 2026
Strategyc — Conversion Funnel Benchmarks 2026
Usermaven — Conversion Funnel Optimization Strategies
Unbounce — Conversion Funnel Basics Explained
The Digital Bloom — B2B SaaS Funnel Benchmarks 2025
Google Ads Help — Quality Score Best Practices
WordStream — Google Ads Benchmarks 2025
Baymard Institute — Cart Abandonment Statistics


