Table of contents
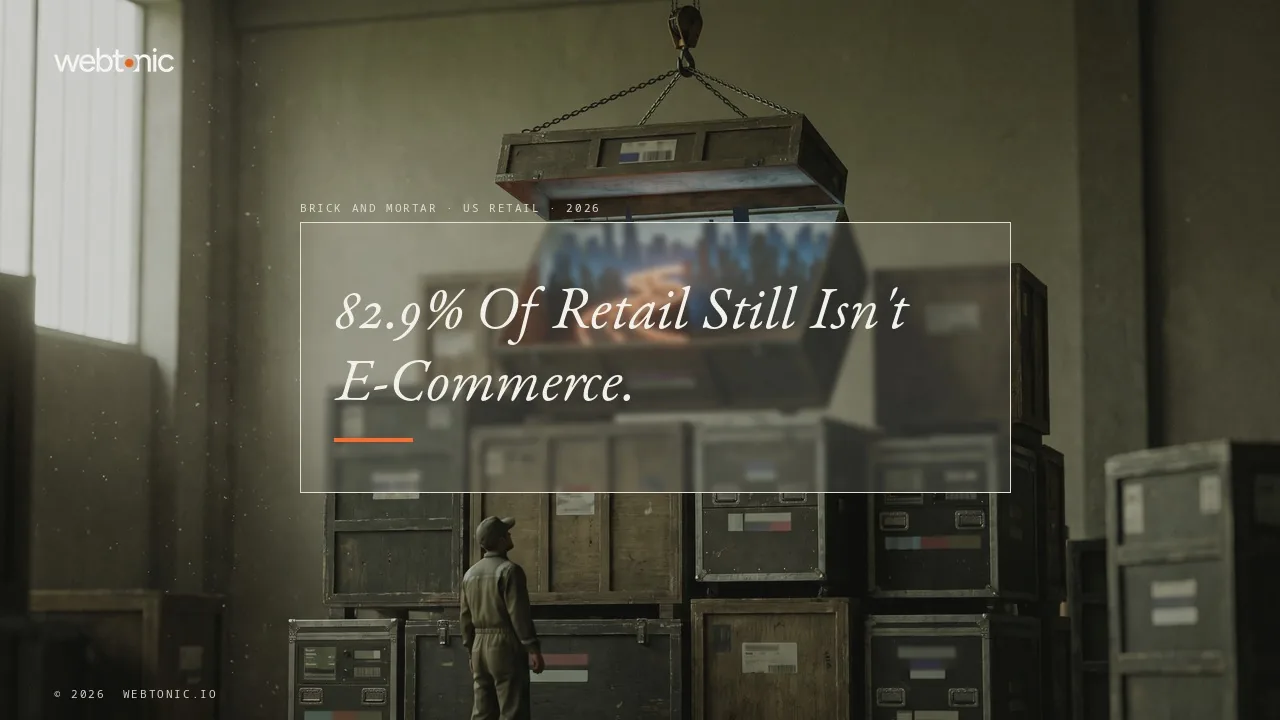
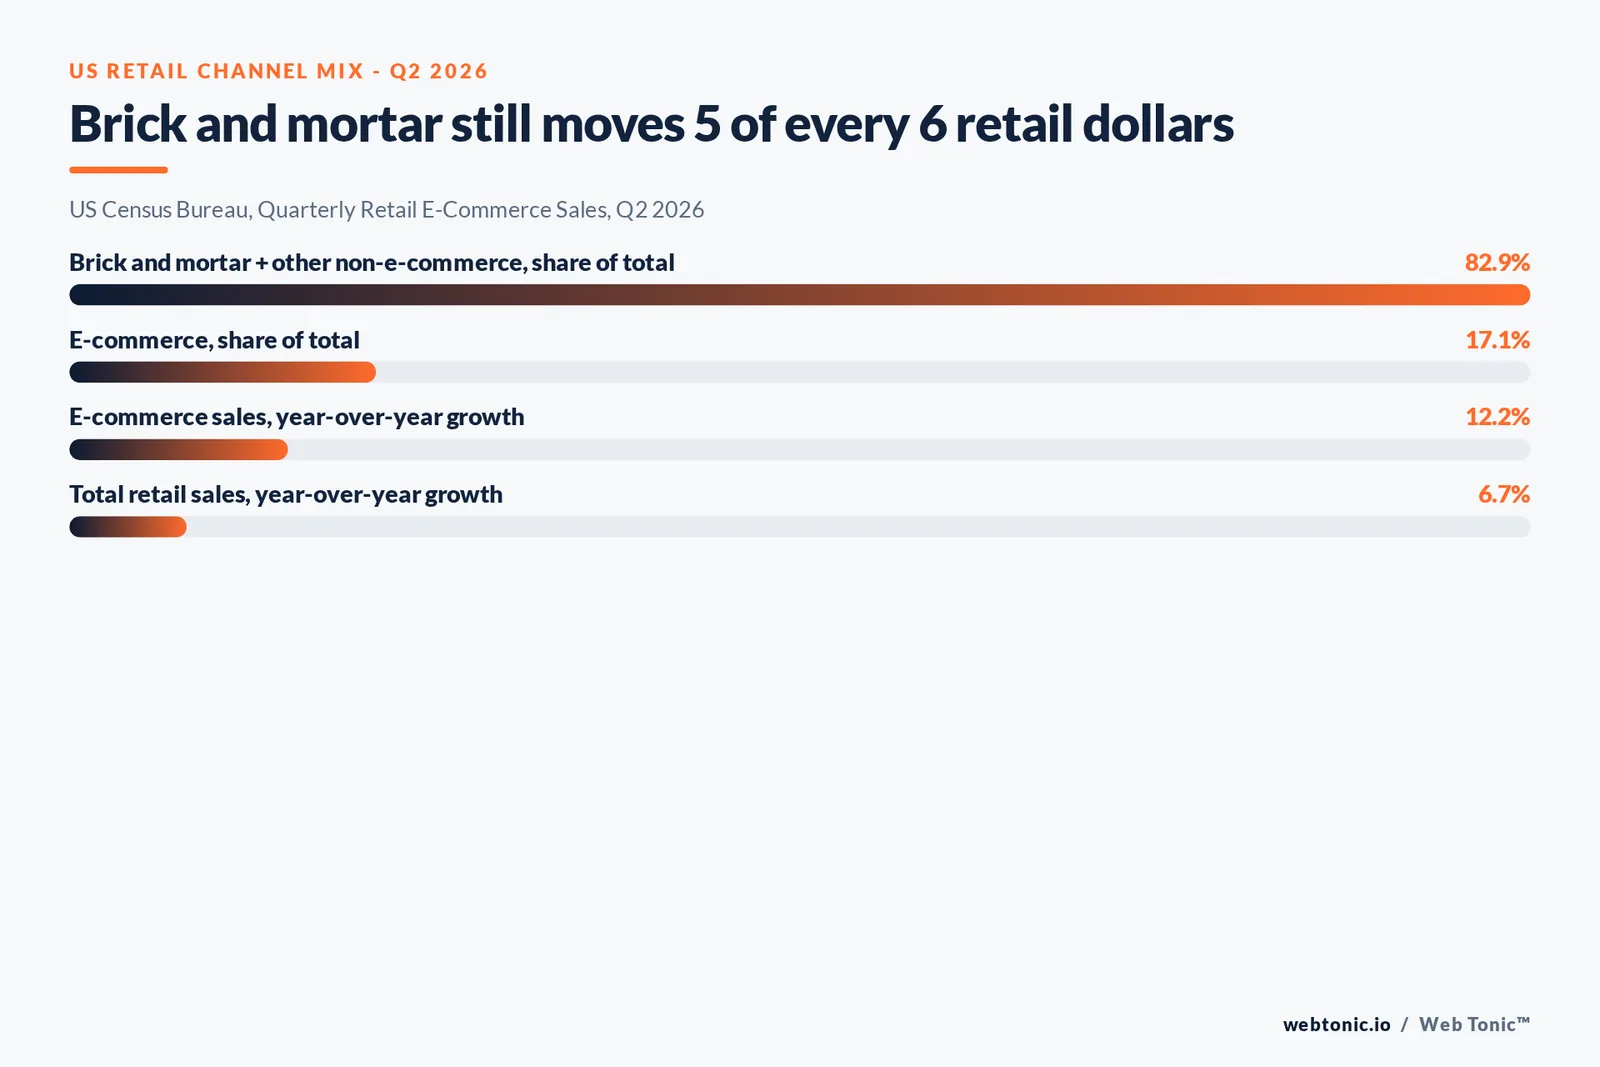
82.9% of every dollar spent at US retail in the second quarter of 2026 was still spent through brick and mortar and other non-e-commerce channels, according to the Census Bureau's own quarterly data. E-commerce is growing nearly twice as fast in percentage terms, but it is growing off a much smaller base.
Key Takeaways
- Total US retail sales hit USD 1,986.5 billion in Q2 2026.
- That is up 6.7% from the same quarter a year earlier.
- E-commerce sales reached USD 340.2 billion in Q2 2026.
- E-commerce is 17.1% of total US retail sales.
- Brick and mortar and other non-e-commerce channels hold 82.9%.
- That is USD 1,646.2 billion moving through physical and offline channels.
- E-commerce grew 12.2% year over year in Q2 2026.
- Total retail grew 6.7% in the same period, less than half that pace.
- E-commerce's share of retail moved under 1 point per quarter for a year.
- The survey samples roughly 10,800 retail firms.
- Those firms are weighted to represent 2 million-plus retail businesses.
- Nonemployer sellers were removed from the estimate in April 2025.
- Responding firms cover about 64% of the total retail sales estimate.
- Total retail sales rose 2.9% quarter over quarter in Q2 2026.
- E-commerce's Q3 2026 update is scheduled for November 19, 2026.
Brick and mortar at a glance in 2026
The single most reliable public dataset on this question is the U.S. Census Bureau's Quarterly Retail E-Commerce Sales report, released August 18, 2026 for the second quarter. It is a government survey, not a vendor estimate, and it is the only figure in this space benchmarked against the actual universe of US retail firms rather than a self-selected panel.
| Metric, Q2 2026 (seasonally adjusted) | Figure | YoY change | Share of total |
|---|---|---|---|
| Total US retail sales | USD 1,986.5B | +6.7% | 100% |
| E-commerce sales | USD 340.2B | +12.2% | 17.1% |
| Brick and mortar + other non-e-commerce | USD 1,646.2B | implied | 82.9% |
| Quarter-over-quarter total retail growth | +2.9% | - | - |
| Quarter-over-quarter e-commerce growth | +3.8% | - | - |
The trend line: a slow slide, not a collapse
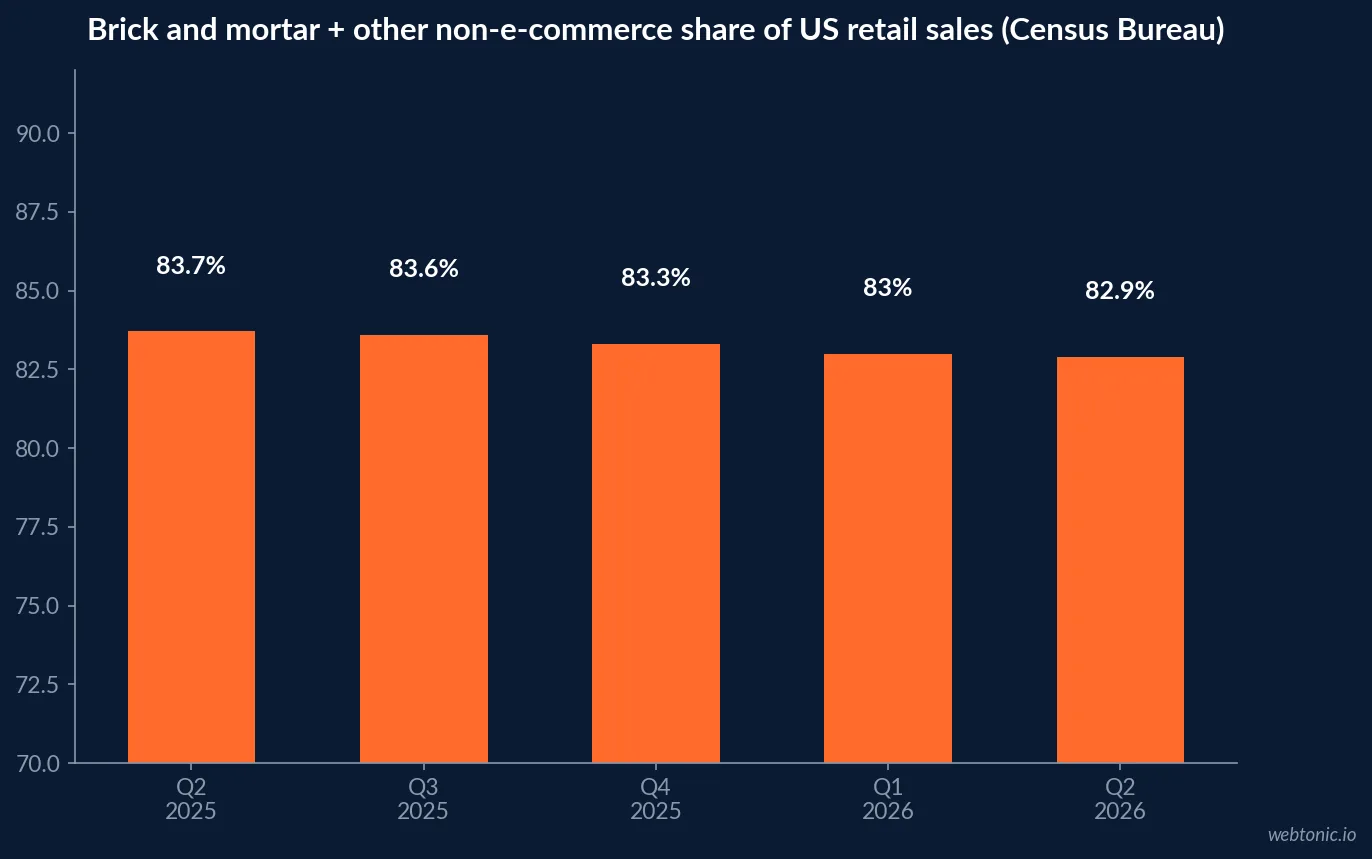
The share shift is real, but the Census Bureau's own five-quarter trend line shows how gradual it actually is. E-commerce's share of total retail sales moved from 16.3% in Q2 2025 to 17.1% in Q2 2026 — a change of 0.8 of a percentage point across an entire year. At that rate, brick and mortar's majority position is not a near-term risk; it is a multi-decade trend that marketers keep over-reacting to on a quarterly basis.
| Quarter | Total retail sales | E-commerce sales | E-commerce share | Brick and mortar + other share |
|---|---|---|---|---|
| Q2 2025 | USD 1,861.6B | USD 303.3B | 16.3% | 83.7% |
| Q3 2025 | USD 1,893.1B | USD 310.8B | 16.4% | 83.6% |
| Q4 2025 | USD 1,900.7B | USD 318.0B | 16.7% | 83.3% |
| Q1 2026 | USD 1,929.8B | USD 327.9B | 17.0% | 83.0% |
| Q2 2026 | USD 1,986.5B | USD 340.2B | 17.1% | 82.9% |
Why the growth-rate gap is easy to misread
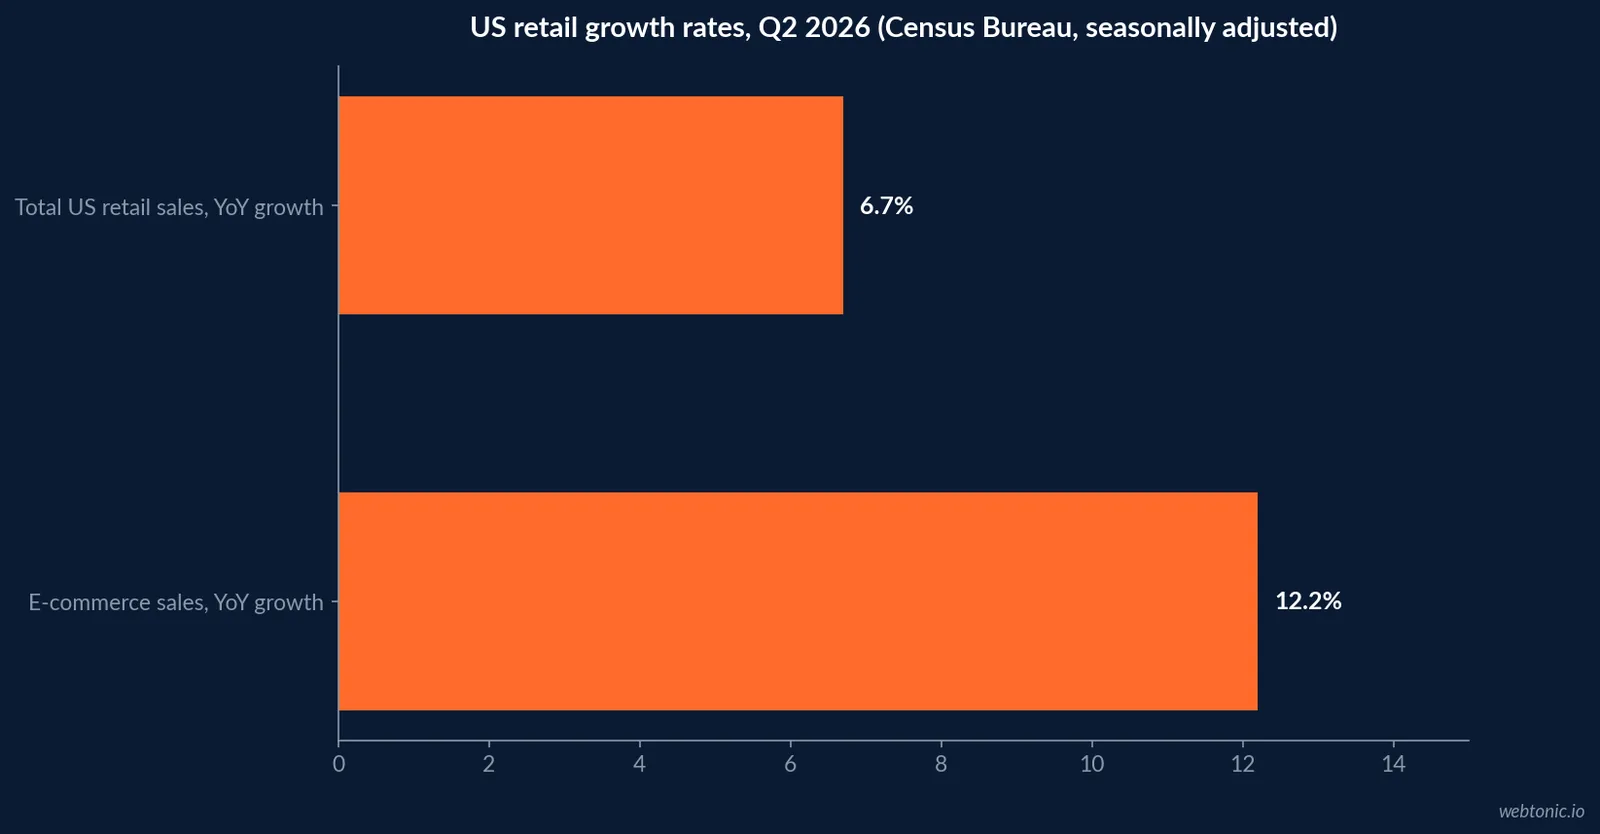
E-commerce's 12.2% year-over-year growth rate looks dramatic sitting next to total retail's 6.7%, and it gets reported that way constantly. What that comparison leaves out is base size: e-commerce is growing nearly twice as fast off a base that is roughly one-sixth the size of brick and mortar's. A channel one-sixth the size growing at 1.8 times the rate still adds less absolute dollar volume than the larger channel growing more slowly — which is exactly what the Census Bureau's own dollar figures show quarter over quarter.
The Census Bureau's methodology also makes the 82.9% figure conservative rather than inflated. Since the April 2025 benchmark revision, nonemployer firms — largely single-operator online sellers without payroll — were removed from the series to align with the Annual Integrated Economic Survey. Some genuinely digital-only retail activity is therefore undercounted on the e-commerce side, which means brick and mortar's true share, if anything, sits at or below 82.9%, not above it.
| Read of the data | What it says | What it actually means | Marketer takeaway |
|---|---|---|---|
| "E-commerce grew 12.2%" | Fast growth in isolation | Fast growth off a base one-sixth the size of brick and mortar | Absolute dollars still favor physical retail |
| "E-commerce share hit 17.1%" | A new record high | Up 0.8 points in a full year | The shift is gradual, not sudden |
| "Brick and mortar share fell to 82.9%" | Sounds like erosion | Still holds five out of every six retail dollars | Physical presence remains the majority channel |
| "Nonemployers excluded from e-commerce data" | A methodology footnote | The 82.9% brick and mortar share is a conservative, not inflated, figure | The real physical-channel share may be even higher |
What this means for where local and regional marketing budgets should go
A brand with a physical footprint spending its entire marketing budget as if the buying decision happens exclusively online is optimizing for 17.1% of the market and largely ignoring the 82.9% still transacting through brick and mortar and other offline channels. That does not mean ignoring digital — e-commerce's growth rate means its share will keep climbing — but it does mean local visibility, in-store experience and location-based discovery still decide the majority of retail outcomes for most categories.
Trade groups tracking the physical side of this — ICSC's industry insights on shopping center performance, the National Retail Federation and Coresight Research's weekly US store openings and closures tracker — consistently show store counts holding up even as individual retailers reshuffle footprints, which is consistent with a market that is shifting slowly rather than collapsing toward digital, and it is the reason store-count headlines about individual chains closing locations rarely translate into an aggregate decline in physical retail's overall share of spend. Location-analytics firms like Placer.ai's research hub track the same physical-channel resilience from the foot-traffic side rather than the sales-dollar side.
Our growth marketing team builds budget splits around the actual channel mix a category shows in the data, not the mix trade coverage assumes it should have, and if you want a read on how your own retail category's online/offline split compares to the Census benchmark, talk to us.
A channel-mix checklist for 2026 retail budgets
The Census Bureau's split gives a hard benchmark to check any retail budget against. If a brand's marketing spend allocation looks nothing like 83% offline-weighted / 17% digital-weighted, that gap should be a deliberate strategic bet, not an accident of which channel is easiest to track in a dashboard. Our data intelligence practice builds that channel-mix reporting so both sides of the split get measured with the same rigor.
| Checklist item | Benchmark from Census data | Question to ask your own budget | Owner |
|---|---|---|---|
| Overall channel split | 82.9% brick and mortar / other, 17.1% e-commerce | Does our spend split resemble this, and if not, why? | Marketing lead |
| Growth-rate weighting | E-commerce +12.2% YoY vs. total retail +6.7% YoY | Are we over-indexing on the faster but smaller channel? | Budget owner |
| Measurement parity | Both channels reported by the same government survey | Do we measure offline conversion as rigorously as online? | Analytics lead |
| Local visibility investment | 83% of transactions still happen through physical/offline channels | Is local SEO and in-store experience funded at that scale? | Growth marketing lead |
What to watch through the rest of 2026
Three things are worth tracking in the Census Bureau's quarterly releases. First, whether e-commerce's share keeps climbing at the same sub-1-point-per-quarter pace or accelerates. Second, whether the gap between adjusted and not-adjusted figures (seasonal effects clearly move e-commerce more than total retail, per the Q4 2025 spike to 18.3% not-adjusted) starts showing up in adjusted numbers too. Third, whether the next benchmark revision, after the 2025 nonemployer exclusion, changes the reported brick and mortar share materially in either direction.
How the Census Bureau actually builds this number
The credibility of the 82.9% figure rests on the survey design behind it, which is worth understanding before citing the number in a board deck. The Census Bureau samples approximately 10,800 retail firms, excluding food services, using a stratified simple random sampling method. Those firms are weighted and benchmarked to represent the complete universe of more than two million retail firms operating in the United States. Responding firms account for roughly 68% of the e-commerce sales estimate and about 64% of the total retail sales estimate in any given quarter, with the remainder imputed from similar businesses.
That methodology is also why the Q2 2026 figure carries a "(p)" for preliminary and gets revised in the following release — the Q1 2026 total retail figure of USD 1,929.8 billion is itself already marked "(r)" for revised from an earlier preliminary estimate. Anyone building a forecast off a single quarter's preliminary number should expect a modest revision once the final figure lands, which is another reason to treat quarter-to-quarter headline swings in either channel's share with some caution rather than reacting to them as if they were final.
| Survey design element | Figure | What it means for the 82.9% headline | Source |
|---|---|---|---|
| Sampled retail firms | ~10,800 | A probability-based sample, not a convenience panel | Census Bureau MRTS |
| Full retail universe represented | 2,000,000+ firms | Results are weighted to the entire US retail sector | Census Bureau MRTS |
| E-commerce estimate from responding firms | ~68% | The rest is imputed from similar businesses | Census Bureau MRTS |
| Total retail estimate from responding firms | ~64% | Consistent methodology across both channels | Census Bureau MRTS |
Frequently Asked Questions
Is brick and mortar retail shrinking in 2026?
Not in dollar terms. The U.S. Census Bureau's Quarterly Retail E-Commerce report puts total U.S. retail sales at USD 1,986.5 billion in Q2 2026, up 6.7% from a year earlier. E-commerce grew faster in percentage terms, but brick and mortar and other non-e-commerce channels still accounted for USD 1,646.2 billion of that total, or 82.9% of every retail dollar spent. The format is not disappearing; its share of a growing pie is easing slowly.
What share of US retail sales is still not e-commerce?
82.9% as of the second quarter of 2026, per the Census Bureau's seasonally adjusted figures. That share has moved from 83.7% in Q2 2025 to 83.3% in Q3 2025, 83.6% in Q4 2025, 83.0% in Q1 2026 and 82.9% in Q2 2026 - a decline of well under one percentage point a quarter. At that pace, brick and mortar's majority share is not going away this decade.
How fast is e-commerce actually growing relative to total retail?
E-commerce sales grew 12.2% year over year in Q2 2026, more than 1.8 times the 6.7% growth rate of total retail sales in the same period. That gap is real, but it is a gap in growth rate, not in absolute share - e-commerce's 12.2% growth moved its share of total retail by less than half a percentage point in a single quarter.
Does this data include marketplace and non-employer sellers?
No, and that matters for how the 82.9% figure should be read. As of the Census Bureau's April 2025 benchmark revision, nonemployer firms - many single-operator online sellers - were removed from the estimates to align with the Annual Integrated Economic Survey. The reported e-commerce share is therefore a conservative read of digital retail's true size, which makes brick and mortar's 82.9% share, if anything, an upper bound rather than an inflated one.
What does this mean for where a local or regional brand should spend its marketing budget?
That physical presence and local visibility still decide the majority of retail outcomes, even for brands running an e-commerce channel. With 82.9% of spend still happening through brick and mortar and other non-digital channels, a marketing plan built entirely around online conversion is optimizing for the smaller and slower-growing share of the market, not the one actually driving most revenue.
Sources
U.S. Census Bureau - Quarterly Retail E-Commerce Sales, 2nd Quarter 2026
U.S. Census Bureau - Retail Trade home
ICSC - Industry insights
National Retail Federation
Coresight Research - Retail industry research
Placer.ai - The Anchor, location intelligence research
Wikipedia - Brick and mortar