Table of contents
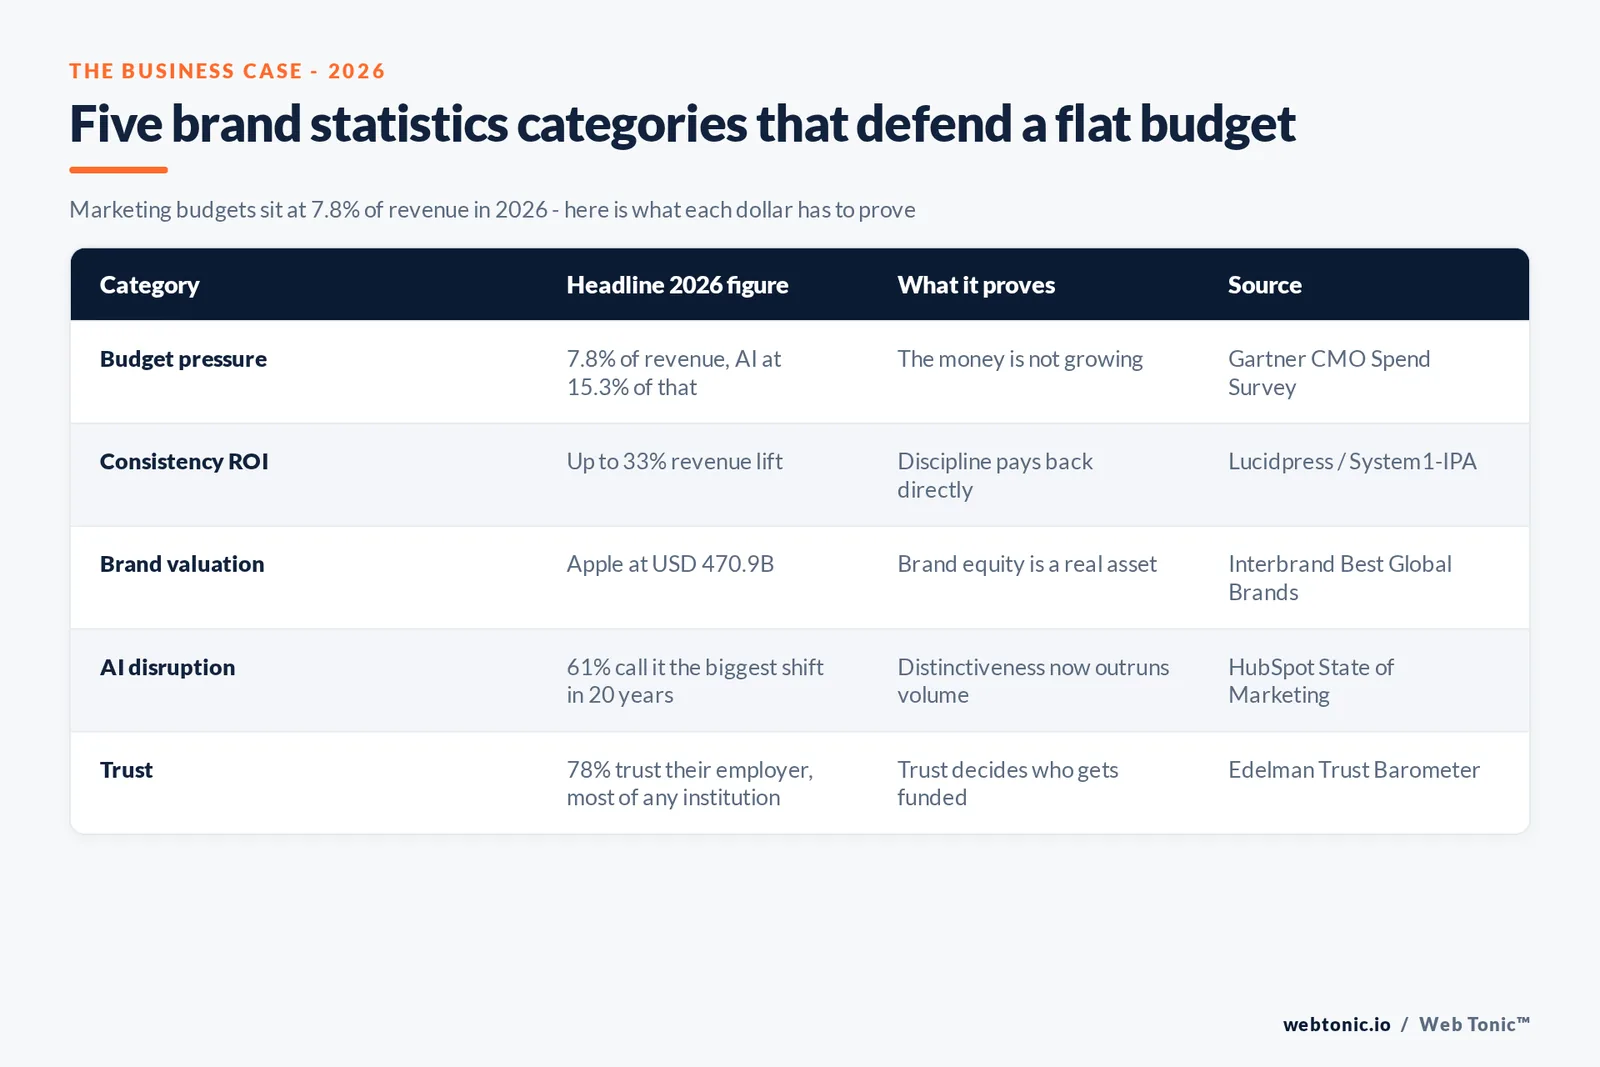
Marketing budgets barely moved in 2026, and the brands that grew despite that were the ones that could prove brand investment pays back. This page compiles the 2026 statistics on budgets, consistency, trust and valuation that make the business case for brand work when the money is flat.
Key Takeaways
- Marketing budgets sit at 7.8% of company revenue in 2026, versus 7.7% in 2025.
- That is 18% lower than the mean budget allocation four years ago.
- CMOs allocate 15.3% of the marketing budget to AI, but only 30% feel ready to scale it.
- Only 35% of CFOs agree marketing drives long-term growth, per Kantar.
- Consistent branding can lift revenue by up to 33% (Lucidpress 2019).
- That is up from a 23% lift found in the 2016 edition of the same research.
- 68% of companies say brand consistency contributed directly to revenue growth.
- 81% of companies still deal with off-brand content despite believing in consistency.
- Consistent brand campaigns create 27% more very large brand effects (System1/IPA).
- Inconsistent branding could cost studied brands GBP 3.5 billion over five years.
- Apple is the world's most valuable brand at USD 470.9 billion (Interbrand 2025).
- Microsoft grew brand value 10.2% to USD 388.5 billion, the fastest top-4 mover.
- 61% of marketers call 2026 marketing's biggest disruption in 20 years (HubSpot).
- 80% of marketers now use AI for content creation, 75% for media production.
- Business is now rated more ethical than NGOs for the first time (Edelman 2026).
- Trust in "My Employer" reaches 78% among employees, 14 points above business overall.
The budget marketers are defending brand spend from
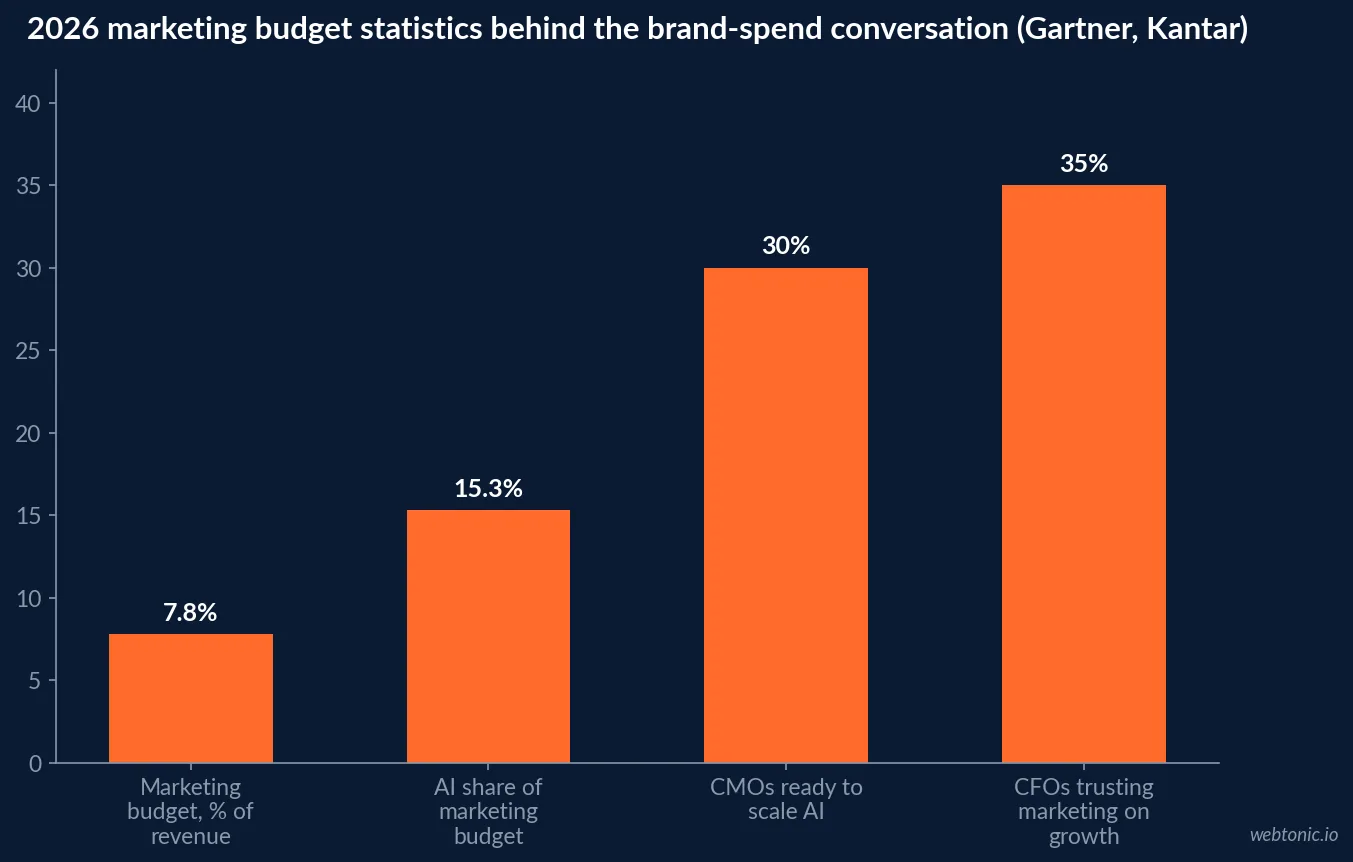
Every brand statistic below sits inside a marketing budget that has stopped growing. Gartner's 2026 CMO Spend Survey puts marketing budgets at 7.8% of company revenue, up only a tenth of a point from 7.7% in 2025 and 18% lower than the mean budget allocation four years ago. Inside that flat pool, CMOs now put 15.3% of the marketing budget toward AI, yet only 30% say they are ready to scale that investment.
Brand work is not a separate budget line in most organizations. It competes with AI tooling, paid media and martech renewals for the same flat percentage of revenue, which is why every dollar spent on brand has to show its work.
| Budget fact (2026) | Figure | Source | What it means for brand spend |
|---|---|---|---|
| Marketing budget | 7.8% of revenue | Gartner CMO Spend Survey | Essentially flat versus 2025 |
| 4-year budget trend | Down 18% | Gartner CMO Spend Survey | Less real money than 2022 |
| AI share of marketing budget | 15.3% | Gartner CMO Spend Survey | Competing directly with brand work |
| CMOs ready to scale AI | 30% | Gartner CMO Spend Survey | Most AI spend is still experimental |
| CFOs who trust marketing on growth | 35% | Kantar effectiveness research | Brand needs its own proof |
What brand consistency is worth in revenue
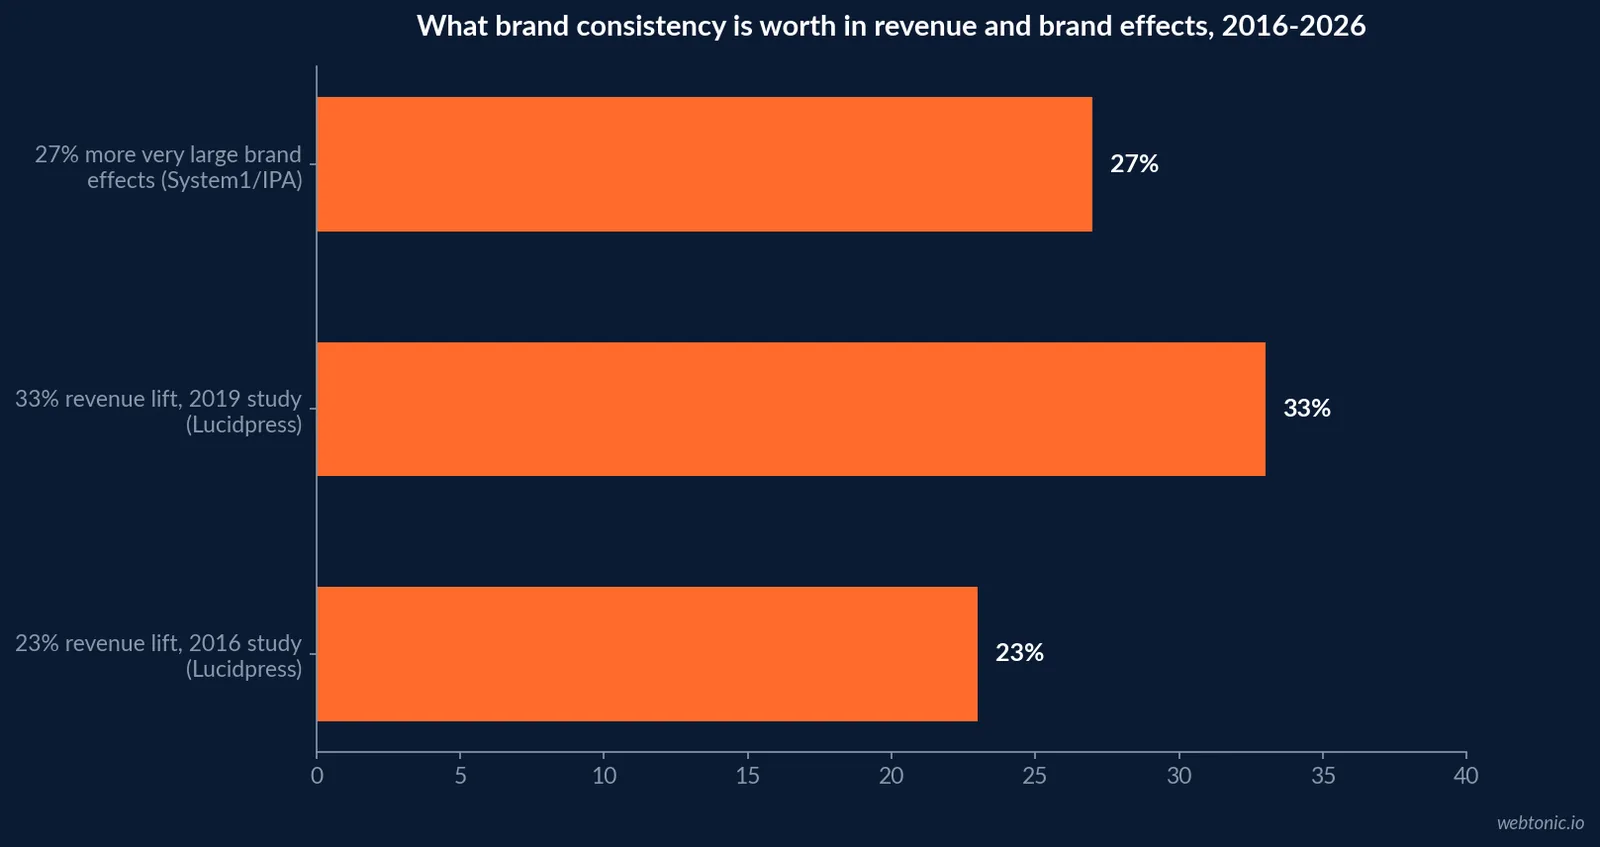
The most-cited brand statistic in marketing decks is also one of the oldest, and it still holds direction if not precision. Lucidpress's State of Brand Consistency Report found that consistent branding can increase revenue by up to 33% in its 2019 edition, a 10-point jump from the 23% lift the 2016 edition found. In the same 2019 survey, 68% of companies said brand consistency contributed directly to revenue growth, while 81% of companies admitted they still deal with off-brand content.
That gap between belief and execution is the real story: brand consistency correlates with revenue in every version of this research, but enforcing it is where most teams fall short.
| Brand consistency fact | Figure | Study year | Source |
|---|---|---|---|
| Revenue lift, upper bound | Up to 33% | 2019 | Lucidpress State of Brand Consistency |
| Revenue lift, 2016 edition | 23% | 2016 | Lucidpress State of Brand Consistency |
| Companies crediting revenue growth to consistency | 68% | 2019 | Lucidpress State of Brand Consistency |
| Companies still shipping off-brand content | 81% | 2019 | Lucidpress State of Brand Consistency |
| Very large brand effects from consistent campaigns | +27% | Multi-year | System1 / IPA Compound Creativity |
What System1 and the IPA add to the picture
System1's Compound Creativity research, built with the IPA from more than 4,000 ads tested with 600,000 respondents across 56 brands over five years, found consistent brand campaigns create 27% more very large brand effects on metrics like awareness, favorability and action intent. Consistent brands also report double the very large profit gains of inconsistent ones, and System1 estimates inconsistent branding practices could cost the brands it studied GBP 3.5 billion over five years.
Read together with the Lucidpress figures, two independent research programs, on two different continents, using two different methodologies, land on the same conclusion: consistency is not a design preference, it is a revenue variable.
What the world's most valuable brands are worth
Interbrand's Best Global Brands 2025 ranking values Apple at USD 470.9 billion, down 3.7% on the year, ahead of Microsoft at USD 388.5 billion (up 10.2%), Amazon at USD 319.9 billion (up 7.3%) and Google at USD 317.1 billion (up 8.9%). Further down the top 10, Instagram grew brand value 27.0%, the fastest mover among the top 10 names, while Mercedes-Benz fell 15.0%, the steepest decline.
These are extreme outliers at the very top of the market, but the movement between them is the useful signal: brand value swings double digits in a single year even for household names, which is the opposite of the "set it and forget it" way most companies treat their own brand.
| Brand (Interbrand 2025) | Brand value | YoY change | Rank |
|---|---|---|---|
| Apple | USD 470.9B | -3.7% | 1 |
| Microsoft | USD 388.5B | +10.2% | 2 |
| Amazon | USD 319.9B | +7.3% | 3 |
| USD 317.1B | +8.9% | 4 | |
| USD 57.3B | +27.0% | 8 | |
| Mercedes-Benz | USD 50.1B | -15.0% | 10 |
Why brand and AI adoption statistics now sit in the same report
HubSpot's 2026 State of Marketing Report finds 61% of marketers believe marketing is experiencing its biggest disruption in 20 years because of AI, with 80% now using AI for content creation and 75% for media production. The report frames the tension plainly: as AI floods every channel with content, brands without a clear point of view are the ones getting lost, and growth in 2026 is increasingly driven by distinctiveness and trust rather than volume.
Kantar's 2026 marketing effectiveness research adds the commercial context: only 35% of CFOs agree marketing drives long-term growth, which is exactly why brand statistics, not brand opinions, are what gets a budget defended in a board meeting.
| AI-and-brand fact (2026) | Figure | Source |
|---|---|---|
| Marketers using AI for content creation | 80% | HubSpot State of Marketing 2026 |
| Marketers using AI for media production | 75% | HubSpot State of Marketing 2026 |
| Marketers calling this the biggest disruption in 20 years | 61% | HubSpot State of Marketing 2026 |
| CFOs who agree marketing drives long-term growth | 35% | Kantar effectiveness research 2026 |
What the 2026 trust data means for brand statistics
The 2026 Edelman Trust Barometer, surveying nearly 34,000 respondents across 28 countries, found trust in "My Employer" reaches 78% among employees, 14 points ahead of trust in business overall (64%) and 25 points ahead of government (53%). For the first time, business is rated more ethical than NGOs. The same report finds 42% of respondents are unwilling to invest in companies that do not share their values, which turns brand positioning from a marketing exercise into a trust variable that shows up on the balance sheet.
Read against the consistency data above, the pattern is consistent across every 2026 study cited on this page: brands that are legible, consistent and values-aligned outperform ones that are not, on revenue, on valuation and on trust.
| Trust fact (2026) | Figure | Source |
|---|---|---|
| Trust in "My Employer" among employees | 78% | Edelman Trust Barometer 2026 |
| Trust in business overall | 64% | Edelman Trust Barometer 2026 |
| Trust in government | 53% | Edelman Trust Barometer 2026 |
| Unwilling to invest in values-misaligned companies | 42% | Edelman Trust Barometer 2026 |
How to use these brand statistics in a budget conversation
Pair a valuation number with a consistency number and a trust number, in that order. Lead with what brand is worth at the top of the market (Interbrand), show what consistency alone is worth in revenue terms (Lucidpress, System1), then close with why a CFO who does not yet trust marketing should still fund it (Kantar, Edelman). That sequence moves the conversation from "brand is a cost" to "brand is a measured variable," which is the argument a flat 7.8%-of-revenue budget forces every marketer to make in 2026.
Sprout Social's 2026 data puts a sharp point on why consistency and trust translate into revenue on social specifically: 73% of social users say if a brand does not respond on social, they will buy from a competitor instead. That single behavior stat is a working argument for treating brand consistency as an operational discipline, not a design guideline nobody enforces.
If your brand guidelines exist but are not enforced across every channel, that gap is exactly what our performance creative practice is built to close, and it is worth reading alongside our breakdown of when paid social pays back brand investment before the next budget cycle.
Where brand statistics are heading next
Expect three shifts in how these numbers get reported over the next few cycles: brand-value data will increasingly separate AI-native categories from legacy ones, consistency research will start measuring enforcement rather than belief, and trust data will keep fragmenting by income and geography the way Edelman's 2026 report already shows. None of that changes the underlying case: brand statistics exist because brand-building is measurable, and 2026 is the year the measurement caught up with the budget pressure.
If you want that measurement built into your own reporting rather than pulled from someone else's study, talk to us, or see how our growth marketing team connects brand metrics to pipeline.
Frequently Asked Questions
What are the most important brand statistics for 2026?
The ones a CFO will ask about first: marketing budgets sit at 7.8% of company revenue in 2026, barely moved from 7.7% in 2025 and 18% lower than four years ago (Gartner). Against that flat budget, consistent brand presentation is tied to revenue increases of up to 33% (Lucidpress), and the world's most valuable brand, Apple, is valued at USD 470.9 billion (Interbrand). Those three numbers frame almost every other brand statistic on this page.
Does brand consistency really increase revenue?
Two separate Lucidpress studies, in 2016 and 2019, found consistent brand presentation lifts revenue by 23% and up to 33% respectively. System1 and the IPA's Compound Creativity research, built from over 4,000 ads and 600,000 respondents, reinforces the direction: consistent brand campaigns create 27% more very large brand effects and consistent brands report double the very large profit gains. The exact percentage moves between studies; the direction does not.
How much do companies spend on branding in 2026?
There is no single branding-only line in most published budgets, because brand work sits inside the wider marketing budget. Gartner's 2026 CMO Spend Survey puts total marketing budgets at 7.8% of company revenue, with 15.3% of that budget now allocated to AI and only 30% of CMOs saying they are ready to scale AI capabilities. Brand-building competes with that AI line for the same flat pool of money.
What is the cost of an inconsistent brand?
System1 and the IPA estimate inconsistent branding practices could cost the brands they studied GBP 3.5 billion over five years. Separately, Lucidpress's 2019 research found 81% of companies still deal with off-brand content even when 60%+ say brand consistency matters for generating leads, which is the gap between believing in consistency and actually enforcing it.
Are marketers more optimistic about brand building than CFOs?
Yes, and the gap is measurable. Kantar's 2026 marketing effectiveness research finds only 35% of CFOs agree that marketing drives long-term growth, while HubSpot's 2026 State of Marketing finds 61% of marketers believe marketing is experiencing its biggest disruption in 20 years. Brand statistics are the shared language that can close that gap, because they are commercial evidence rather than a marketing opinion.
Sources
Chief Marketer - Gartner 2026 CMO Spend Survey coverage
PR Newswire - Lucidpress State of Brand Consistency Report
System1 - Compound Creativity research with the IPA
Interbrand - Best Global Brands 2025 ranking
HubSpot - 2026 State of Marketing Report
Kantar - 10 Charts to Make You a More Effective Marketer, 2026
PR Newswire - 2026 Edelman Trust Barometer findings
Sprout Social - 120+ Social Media Marketing Statistics for 2026