Table of contents

Beauty & Skincare Dashboard Statistics: The Metrics That Matter
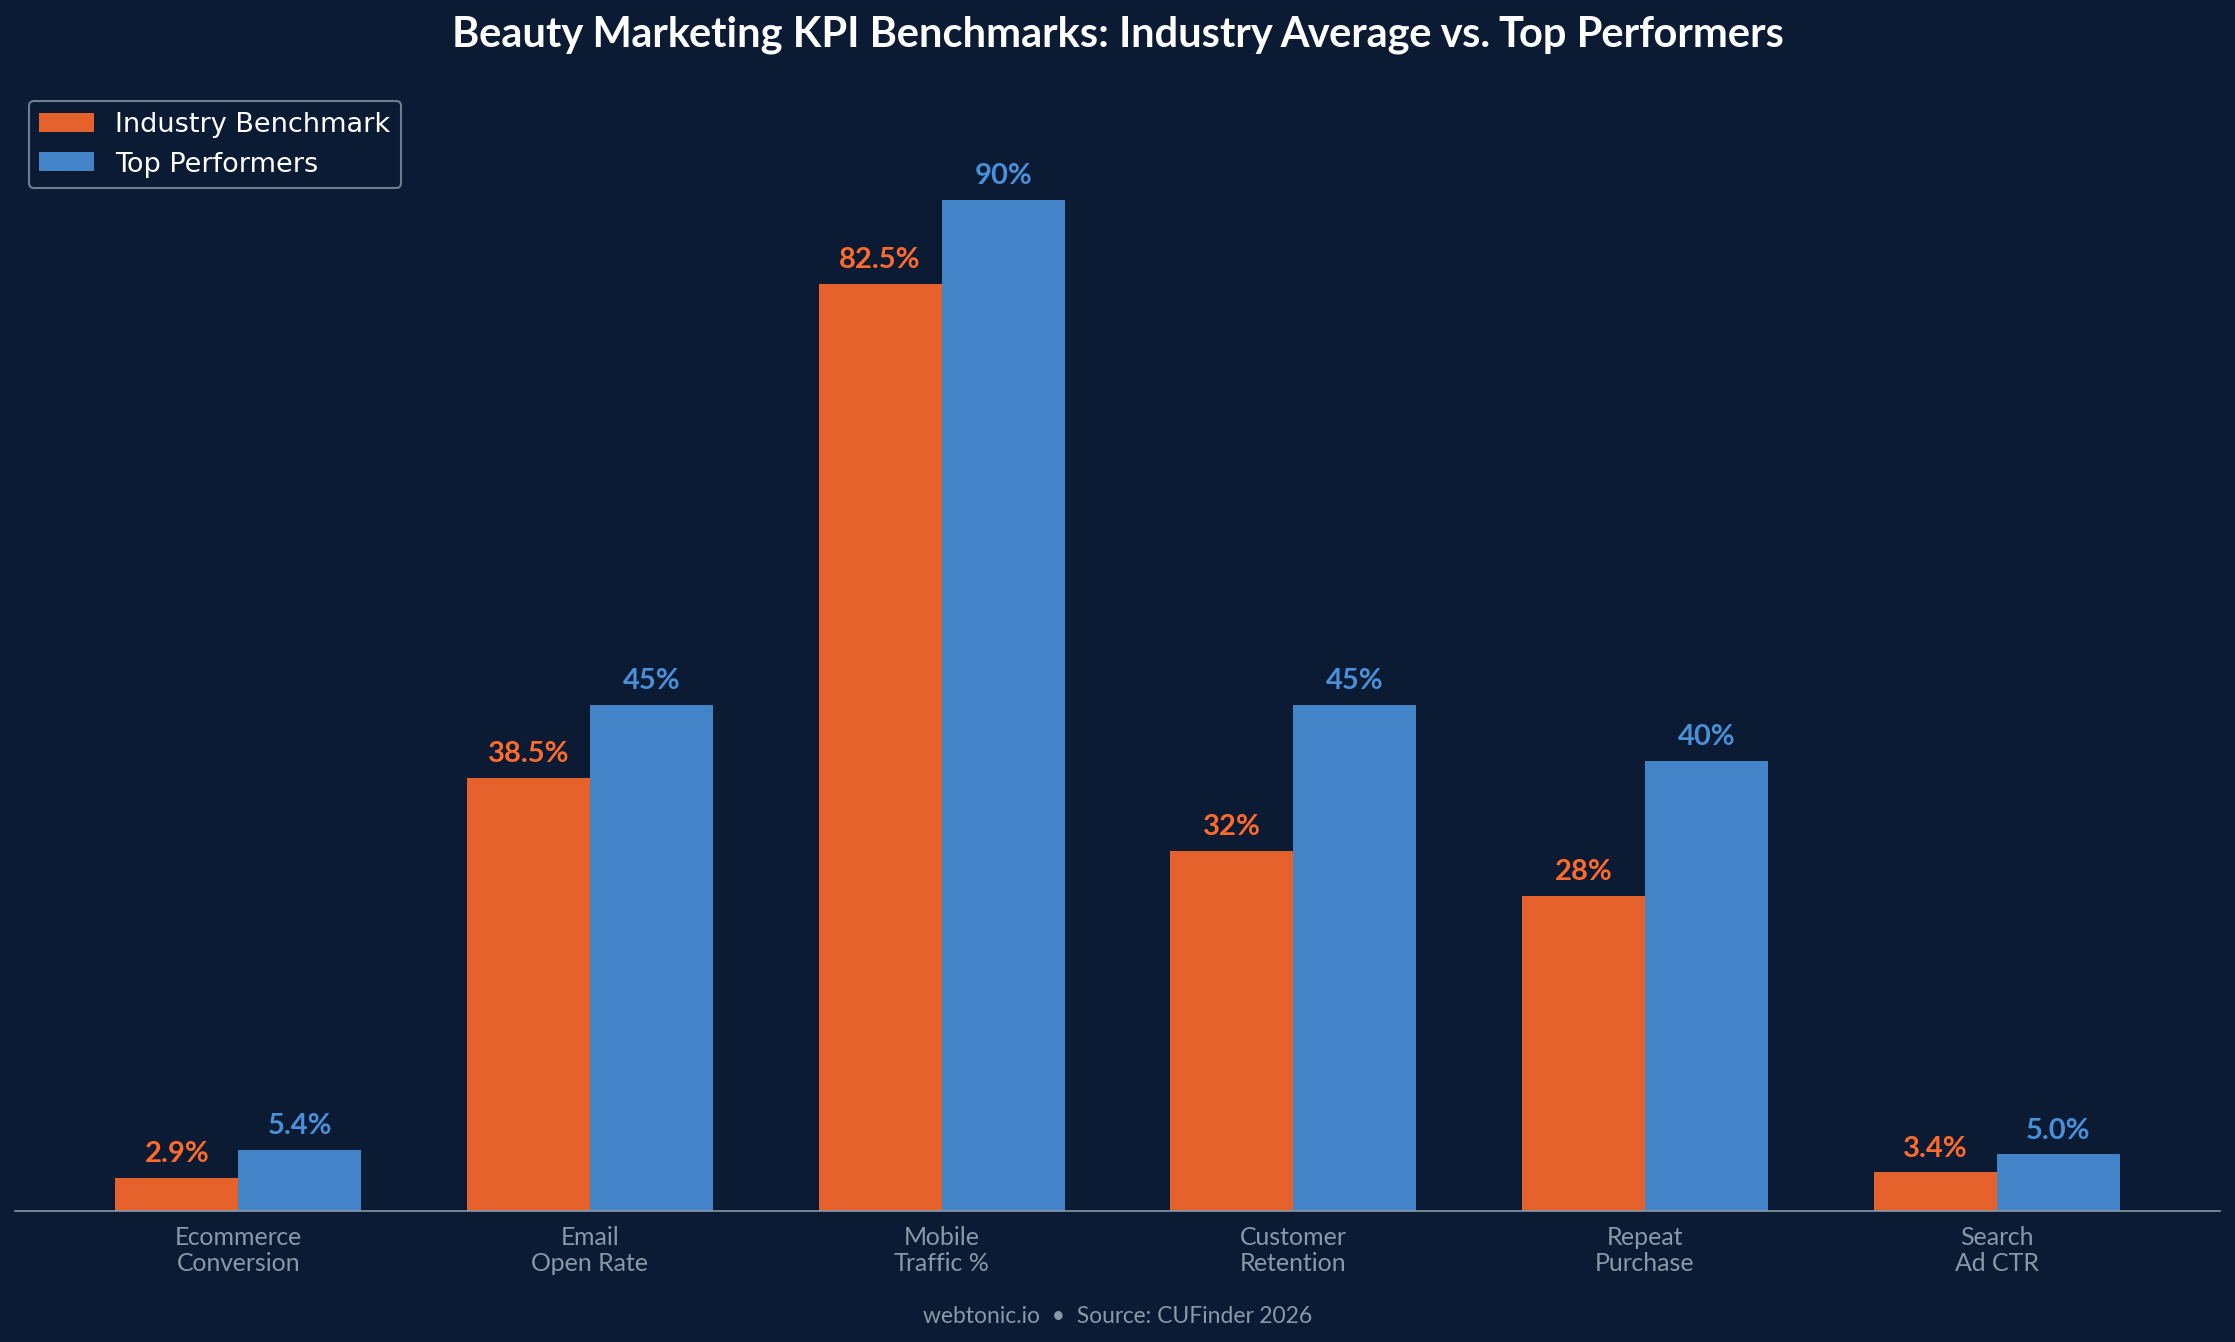
Most beauty brands are drowning in data and starving for insight. With platform dashboards showing 47+ metrics each and analytics tool stacks costing $30 K–$247 K per year, the challenge is not data collection — it is knowing which numbers actually drive profitable decisions. The average beauty ecommerce conversion rate sits at 2.9%, but top performers hit 5.4%, and the brands that reach those numbers share one trait: they track 8–12 decision-making metrics rather than monitoring everything. Here is where the industry stands on dashboards and reporting.
Key Takeaways
- 2.9% is the average beauty ecommerce conversion rate, with top performers reaching 5.4% (CUFinder, 2026).
- 82.5% of beauty traffic is mobile, making mobile-first dashboards essential (CUFinder, 2026).
- 38.5% email open rate is the beauty industry benchmark — the highest-ROI channel to track (CUFinder, 2026).
- $31.50 blended CPA across all channels is the current beauty benchmark (CUFinder, 2026).
- CLV:CAC ratio of 4:1 separates profitable beauty brands from those burning cash (CUFinder, 2026).
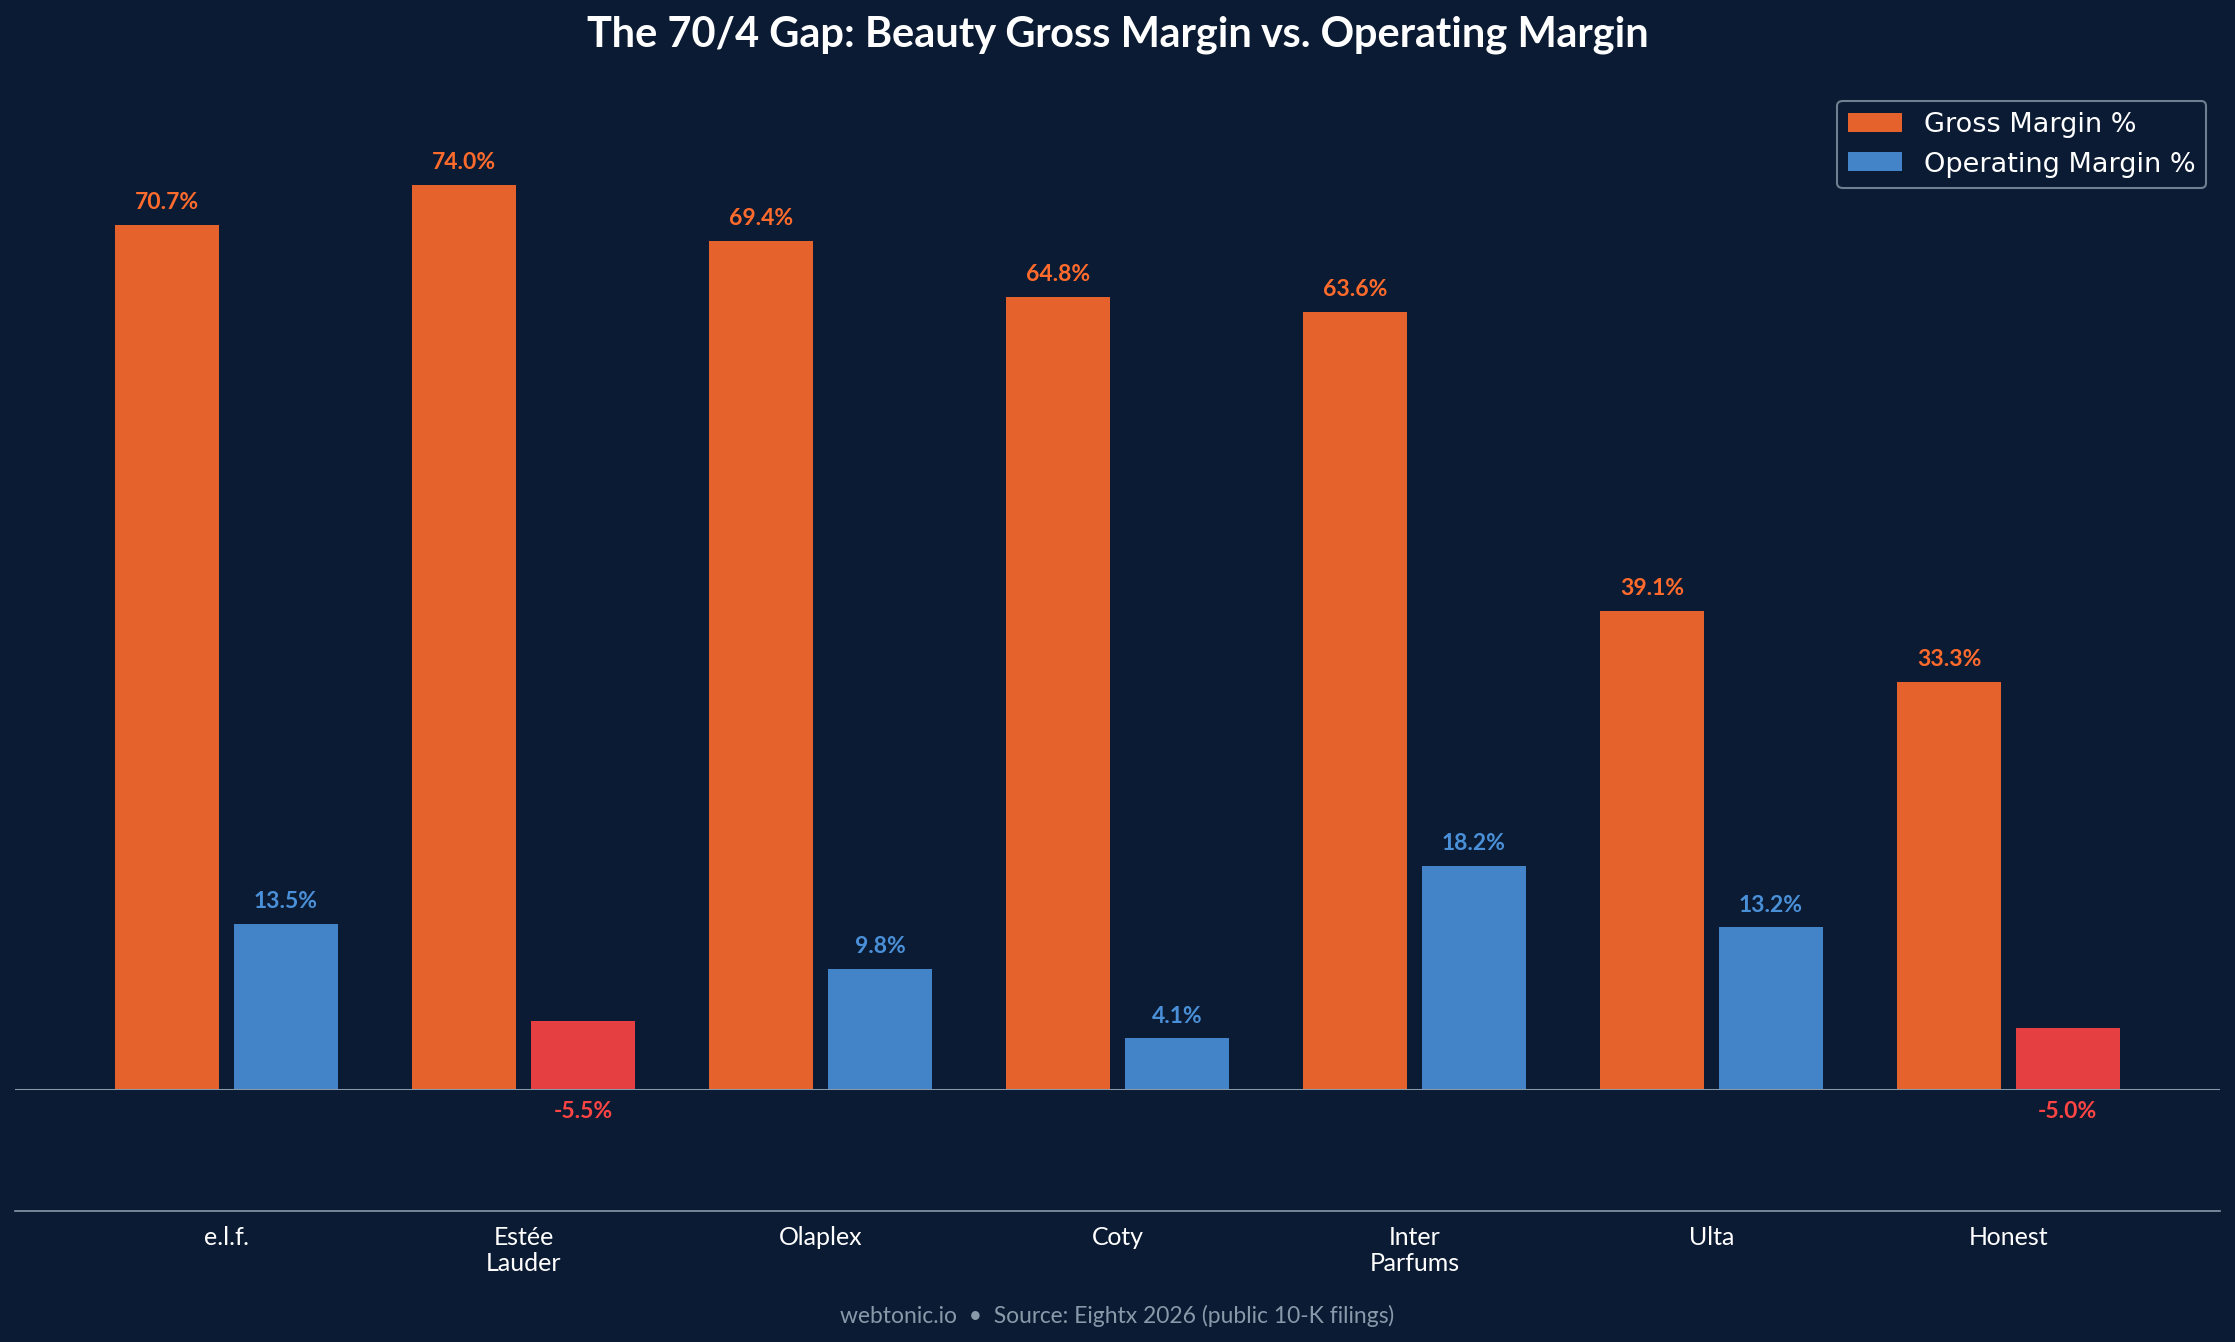
- 64–74% gross margins in beauty mask a median operating margin of just 4.1% — dashboards must track both (Eightx, 2026).
- $247,000 per year was spent by one mid-market beauty brand on fragmented analytics tools before consolidation (LayerFive).
- 25–30 hours per week of manual reporting is common before dashboard automation (LayerFive).
- 130+ AI-driven analyses per month are now run by non-technical staff at Jones Road Beauty via AI-native dashboards (Polar Analytics).
- 66.1% YoY traffic growth across beauty ecommerce stores makes dashboard accuracy more critical than ever (GetEcommerceLeads, 2026).
- $19 B in online beauty sales tracked in 2025, with 20–50% revenue growth forecast for 2026 (Grips Intelligence).
- 8–12 metrics maximum on a beauty brand dashboard is the recommended ceiling for decision support (Veilup, 2026).
- Customer retention rate of 32% and repeat purchase rate of 28% are the beauty benchmarks to track on retention dashboards (CUFinder, 2026).
- 5–7 day reporting lag before dashboard automation makes real-time optimization impossible (LayerFive).
- 4.5% engagement rate on TikTok leads all social platforms for beauty content (CUFinder, 2026).
Beauty Marketing KPI Benchmarks at a Glance
| Metric | Benchmark | Top Performer | Source |
|---|---|---|---|
| Ecommerce conversion rate | 2.9% | 5.4% | CUFinder, 2026 |
| Mobile traffic share | 82.5% | — | CUFinder, 2026 |
| Email open rate | 38.5% | 45%+ | CUFinder, 2026 |
| Blended CPA | $31.50 | < $20 | CUFinder, 2026 |
| CLV:CAC ratio | 4:1 | 6:1+ | CUFinder, 2026 |
| Customer retention rate | 32% | 45%+ | CUFinder, 2026 |
| Repeat purchase rate | 28% | 40%+ | CUFinder, 2026 |
| AOV (new customers) | $62.00 | $85.00 (existing) | CUFinder, 2026 |
| Search ads CTR | 3.4% | 5%+ | CUFinder, 2026 |
| Search ads CPA | $28.00 | < $18 | CUFinder, 2026 |
The Three-Level Dashboard Structure for Beauty Brands
The most effective beauty brand dashboards follow a three-level structure that separates daily, weekly, and monthly metrics to prevent information overload and drive action (veilup.io).
Daily metrics are leading indicators: ad spend vs. budget (flag ±15% variance) and revenue vs. forecast. These take under 5 minutes to review. Weekly metrics measure program performance: blended CPA, ROAS by channel, email revenue, and new customer acquisition rate. Monthly metrics are strategic: CLV:CAC ratio, retention rate, gross-to-operating margin spread, and channel contribution trends.
The critical rule: every metric needs a benchmark and a trend line. An email open rate of 28% means nothing without knowing it is trending down from 38.5% and that the industry benchmark is 38.5%. Metrics without context are just numbers — they generate monitoring, not decisions.
Financial Benchmarks Every Beauty Dashboard Must Include
Beauty's financial structure makes margin tracking non-negotiable on any serious dashboard. Gross margins run 64–74% across public beauty companies — e.l.f. at 70.7%, Estée Lauder at 74.0%, Olaplex at 69.4% — the highest of any consumer category. But the median operating margin is just 4.1%, with two of seven major public companies (Estée Lauder, Honest) running operating losses in their latest fiscal year (eightx.co).
For DTC brands, the relevant dashboard metrics are CAC, AOV, and the gap between them. DTC beauty CAC runs $40–$100+ against an AOV of ~$66 for new customers and ~$85 for existing customers (cufinder.io). First-order profit is frequently negative. The model survives on repeat purchases, which is why retention rate (32%) and repeat purchase rate (28%) belong on the primary dashboard, not buried in a monthly report. Tracking the true cost of acquisition matters more in beauty than in almost any other vertical.
| Financial Metric | Beauty Benchmark | Why It Matters |
|---|---|---|
| Gross margin (brand) | 64–74% | Highest consumer category — creates false comfort |
| Operating margin (median) | 4.1% | Where the real P&L lives |
| DTC CAC | $40–$100+ | Often exceeds AOV — first order is a loss |
| AOV (new customer) | $62 | Baseline for payback period |
| AOV (existing customer) | $85 | 37% uplift signals retention health |
| Inventory turns | 1.5–2.9×/year | Below 4–9× target — hidden working-capital cost |
| Return rate | 4–10% | Low vs. apparel (20–40%) — beauty's advantage |
Source: eightx.co (public 10-K filings, 2026 DTC benchmark data)
Analytics Tool Costs and Adoption in Beauty
The analytics tool market for beauty brands has expanded significantly, but tool sprawl remains the primary reporting pain point. Luminara Skin's pre-consolidation stack totaled $247,000 per year across four tools: Google Analytics 360 ($150 K), Funnel.io ($36 K), Tableau ($42 K), and a Northbeam trial projected at $76 K annually. Data was scattered across 15+ platforms with no single source of truth, and the marketing team spent 25–30 hours per week on manual reporting with a 5–7 day lag between campaign launch and accurate performance data (layerfive.com).
On the other end of the spectrum, Jones Road Beauty built an AI-native analytics layer where 13 of 17 staff members run 130+ AI-driven analyses per month through Claude on a governed data warehouse, with a single analyst supporting the entire company (polaranalytics.com). Enterprise players are making similar moves: Shiseido built a data analysis platform on BigQuery for cost-efficient processing and AI features (cloud.google.com), while Natura Cosméticos automated reporting with SQL and Python pipelines on Databricks (databricks.com).
Social Media and Channel Performance Benchmarks
Beauty dashboards must track social media performance separately from paid acquisition because organic social drives brand equity and discovery in this vertical more than most. The current benchmarks show TikTok leading engagement at 4.5%, followed by Instagram at 1.8% and Facebook trailing behind. Short-form video dominates: TikTok and Reels content consistently outperforms static creative by 70%+ on CTR (rckstrmedia.com).
On the paid side, beauty search ads achieve a 3.4% CTR and $28 CPA, while social ads run at 2–4% CTR with CPAs of $15–$40 depending on AOV and product category. The critical dashboard addition for 2026: tracking email and SMS retention as a standalone revenue channel, which drives 25–35% of revenue for top skincare brands but is invisible when lumped into "owned media" (pennock.co).
Beauty Ecommerce Growth Statistics
The scale of beauty ecommerce growth makes accurate dashboarding more critical than ever. Across 400,000+ tracked stores, beauty ecommerce saw 66.1% traffic growth year-over-year (getecommerceleads.com). Aggregate online beauty sales hit $19 billion in 2025, with revenue expected to grow 20–50% in 2026 (gripsintelligence.com). Nielsen IQ reports that the broader beauty market grew 10% year-over-year, with online channels outpacing in-store by 6× in growth rate (nielseniq.com).
At this velocity, dashboards that update weekly or monthly are already outdated. The brands setting the pace — like those using real-time BI tools — review daily operational metrics and adjust spend within 24 hours of variance detection.
Reporting Cadence and Automation Statistics
Reporting cadence directly impacts decision quality. Beauty brands with daily automated reporting can detect and respond to ad spend variance within 24 hours — those relying on weekly manual pulls lose 5–7 days of optimization opportunity. Luminara's pre-automation team experienced a 5–7 day lag between campaign launch and accurate performance assessment, which meant budget decisions were always based on stale data (layerfive.com).
The industry is moving toward three cadence tiers: daily operational dashboards (spend pacing, revenue vs. forecast — reviewed in under 5 minutes), weekly performance reviews (ROAS by channel, new customer metrics, ad creative performance), and monthly strategic reviews (CLV:CAC trends, margin analysis, channel contribution shifts). Veilup's framework emphasizes that a decision-making metric is one that, when it changes, tells you to do something different. Anything else is a vanity metric that crowds out real signals (veilup.io).
For paid media specifically, beauty brands running Google Ads alongside Meta and TikTok need unified cross-channel views. Connecting Meta and Google Ads data into a single dashboard enables tracking of ROAS, CAC, campaign effectiveness, and conversion funnel drop-offs in one view, eliminating the manual reconciliation that consumed 25–30 hours weekly at brands like Luminara. The shift from multi-tool chaos to a single source of truth is the highest-leverage dashboard improvement most beauty brands can make.
At scale, the beauty industry's $15 billion+ in global ad spend means that even small improvements in reporting accuracy have outsized impact. A brand spending $1 M per month on paid channels that reduces reporting lag from 7 days to same-day can redirect 5–10% of spend from underperforming campaigns within the first week — a difference that compounds across quarters.
Why Dashboard Accuracy Matters More Than Ever
The beauty industry's growth trajectory makes dashboard precision a competitive necessity, not a nice-to-have. Global beauty ad spend is projected to surpass $15 billion in 2026, with competition intensifying across every digital channel (rckstrmedia.com). At this scale, even a 5% misallocation of budget based on inaccurate dashboard data represents $750 M in industry-wide waste.
The brands winning the dashboard arms race share three traits: they track fewer metrics with more context, they automate reporting to eliminate lag, and they democratize data access so marketing decisions happen at the speed of the market. Jones Road Beauty's model — where 13 of 17 staff members query analytics directly — represents where the industry is headed. The analyst-as-bottleneck model that defined beauty marketing analytics for the past decade is being replaced by AI-queryable data layers that serve the entire organization.
Dashboard Best Practices for Skincare and Cosmetics Brands
- Cap your dashboard at 8–12 metrics. More metrics create monitoring, not decision-making. Each metric must answer: "If this changes, what do I do differently?"
- Separate daily, weekly, and monthly cadences. Ad spend vs. budget is a daily check. CLV:CAC is a monthly review. Mixing cadences leads to noise.
- Add benchmarks and trend lines to every metric. A conversion rate without context is just a number. Show the industry benchmark (2.9%) and the 4-week trend.
- Track retention alongside acquisition. With CAC often exceeding AOV, the repeat purchase rate (28% benchmark) and customer retention rate (32%) are profitability indicators.
- Monitor gross-to-operating margin spread. A 70% gross margin that yields 4% operating margin tells a very different story than a 70% gross margin with 15% operating margin.
- Break out email and SMS as standalone channels. They drive 25–35% of revenue and are systematically under-credited when lumped into "owned."
- Automate where the lag exceeds 24 hours. A 5–7 day reporting lag makes real-time optimization impossible. Invest in automation before new tools.
- Democratize data access. Jones Road Beauty's model — where most staff members query the warehouse directly — eliminates analyst bottlenecks.
- Track mobile conversion separately. With 82.5% of beauty traffic on mobile, your desktop and mobile conversion rates tell very different stories. A blended 2.9% can hide a 4.2% desktop rate masking a 2.2% mobile rate.
- Include inventory turns on monthly dashboards. Beauty inventory turns of 1.5–2.9× per year are well below the 4–9× healthy target and represent hidden working-capital costs that most marketing dashboards ignore.
The overarching principle is that a beauty brand dashboard should be designed for decision support, not monitoring. Every number on screen should answer one question: if this metric changes, what do we do differently? If there is no clear action, the metric is consuming attention without creating value — remove it and redirect that cognitive bandwidth toward the 8–12 numbers that actually drive profitability. For beauty brands considering a dashboard overhaul, the best return on investment comes from starting with a simple weekly spreadsheet that tracks MER, blended CPA, new vs. returning revenue, and retention rate — then graduating to tooling once the habit of data-driven decision-making is established.
Frequently Asked Questions
What is a good conversion rate for beauty ecommerce?
The industry average beauty ecommerce conversion rate is 2.9% in 2026. Top-performing brands reach 5.4% by optimizing mobile UX, reducing checkout friction, and running rigorous landing page testing. Mobile accounts for 82.5% of traffic, so mobile conversion optimization should be the primary focus.
How many metrics should a beauty brand track on a dashboard?
Experts recommend 8–12 metrics maximum on a primary dashboard, organized into daily (spend vs. budget, revenue vs. forecast), weekly (CPA, ROAS, email revenue), and monthly (CLV:CAC, retention, margins) tiers. Every metric should include a benchmark and trend line.
What does a beauty brand analytics stack cost?
Mid-market beauty brands spend $30 K–$250 K per year on analytics tools. The range depends on whether the brand uses enterprise solutions (GA 360 at $150 K+) or purpose-built DTC platforms (Triple Whale, Polar Analytics at $30 K–$75 K). AI-native solutions are reducing per-insight cost significantly.
What is the most important financial metric for a beauty dashboard?
The CLV:CAC ratio is the single most important financial metric. With DTC beauty CAC at $40–$100+ and AOV at ~$66, first-order profit is typically negative. A CLV:CAC of ≥ 4:1 (in margin dollars) is the minimum threshold for sustainable scaling.
How fast is beauty ecommerce growing?
Beauty ecommerce traffic grew 66.1% year-over-year across 400,000+ stores. Online beauty sales reached $19 B in 2025, with growth of 20–50% forecast for 2026. Online channels are outpacing brick-and-mortar by 6× in growth rate.
Sources
cufinder.io
eightx.co
veilup.io
layerfive.com
polaranalytics.com
pennock.co
rckstrmedia.com
getecommerceleads.com
gripsintelligence.com
nielseniq.com
cloud.google.com (Shiseido)
databricks.com (Natura)