Table of contents
No named study prices a per-lead cost for B2B SaaS marketing automation - the honest starting point is Benchmarkit's own median customer-acquisition figures, read alongside what the automation platforms themselves actually charge per contact. This page prices the stack, benchmarks the CTR a nurture sequence can realistically post, and shows which platforms B2B teams are actually running.
Key Takeaways
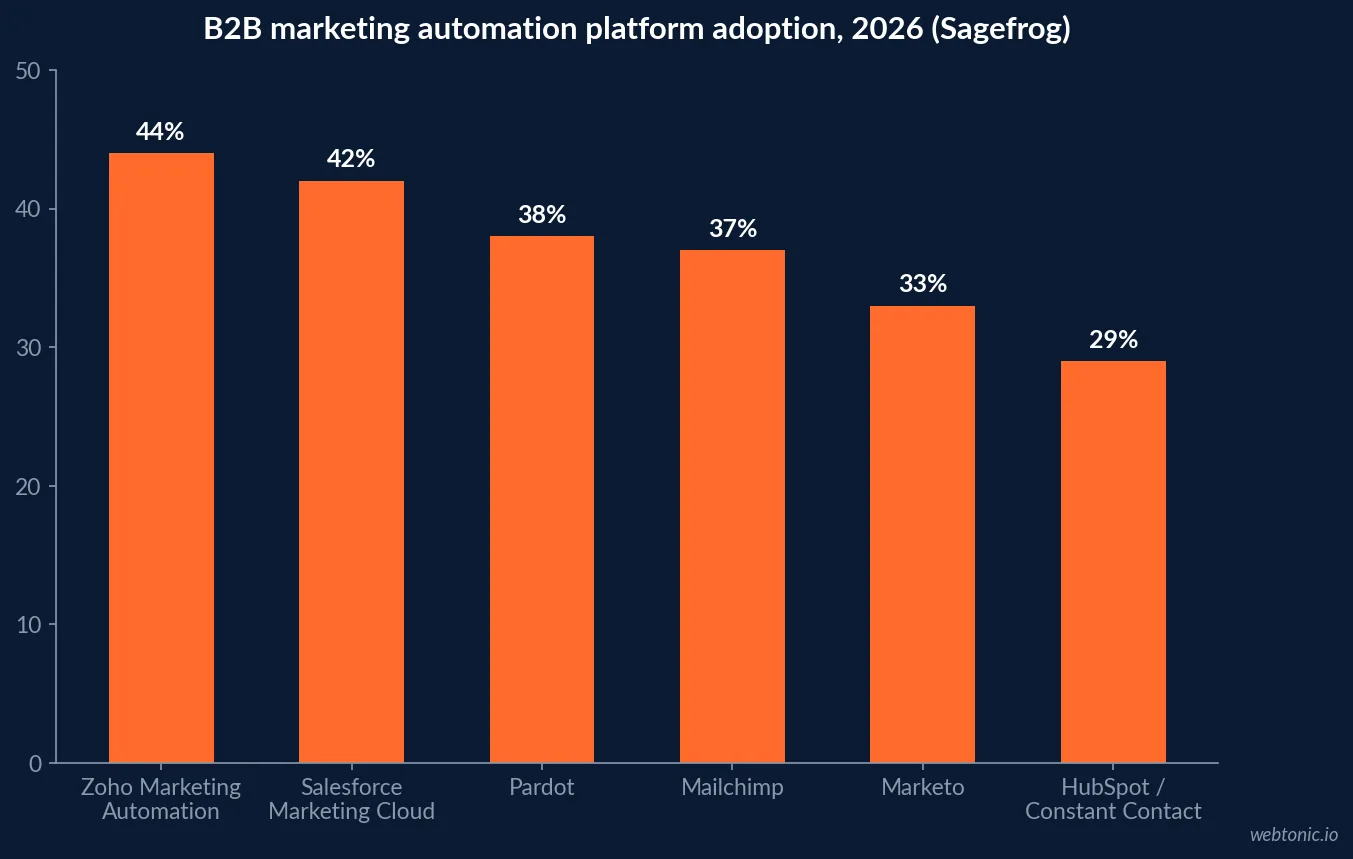
- Zoho Marketing Automation leads B2B adoption at 44%.
- Salesforce Marketing Cloud follows at 42%, Pardot at 38%.
- HubSpot and Constant Contact tie at 29% adoption.
- Median CAC payback across SaaS sits at 16 months (Benchmarkit CY-2025).
- The median blended CAC ratio is USD 1.30 per dollar of new ARR.
- Median LTV to CAC runs 4.1 times across the same sample.
- HubSpot Enterprise costs USD 0.36 per contact per month at its 10,000-contact tier.
- HubSpot Professional costs USD 0.40 per contact per month at its 2,000-contact tier.
- Brevo's Professional tier runs USD 499 a month with volume-based send caps.
- Software category email opens at 36.20% on ActiveCampaign's own customer data.
- A separate MailerLite dataset puts Software opens at 39.31%.
- Software click rate sits at 1.15%, below the 2.09% all-industry average.
- 37% of B2B marketers report AI-enabled automation in their stack.
- Marketing technology took 15% of the 2026 B2B budget-increase priority list.
- Contact odds on a fresh lead fall fastest in the first hour (HBR, 2011).
- Median gross margin across the same SaaS sample is 80%.
Why "automation CPL" is the wrong question for SaaS pipeline
Marketing automation platforms bill on contacts and sends, and SaaS pipeline is measured on acquisition cost and payback, not a channel-level cost-per-lead. Benchmarkit's CY-2025 B2B SaaS benchmarks report a median CAC payback period of 16 months, a median blended CAC ratio of USD 1.30, and median LTV to CAC of 4.1 times across its sample. None of those figures isolate marketing automation as a channel - they are the honest frame a SaaS team should use instead of quoting a single "automation CPL" nobody has actually measured.
| SaaS acquisition benchmark (CY-2025) | Figure | What it tells a pipeline plan |
|---|---|---|
| Median CAC payback | 16 months | The realistic horizon for automation ROI to show up |
| Median blended CAC ratio | USD 1.30 | Cost per dollar of new ARR, all channels blended |
| Median LTV:CAC | 4.1x | The ceiling a stack of tools has to help clear |
| Median gross margin | 80% | How much of new revenue is actually available to spend |
| Median revenue per employee | USD 175,000 | A cross-check on how lean the team funding this is |
Who is actually running which platform
Sagefrog's 2026 B2B Marketing Mix Report, its 19th annual survey of B2B marketers across healthcare, industrial, financial services and technology, found Zoho Marketing Automation leading adoption at 44%, Salesforce Marketing Cloud at 42%, Pardot (Account Engagement) at 38%, Mailchimp at 37%, Marketo at 33%, and HubSpot tied with Constant Contact at 29%. Software and technology respondents made up a modest 6% of that survey, so this is broad B2B adoption, not a SaaS-only sample.
| Platform | 2026 B2B adoption share | Where it tends to anchor |
|---|---|---|
| Zoho Marketing Automation | 44% | SMB and mid-market, often bundled with Zoho CRM |
| Salesforce Marketing Cloud | 42% | Enterprise, tied to an existing Salesforce org |
| Pardot (Account Engagement) | 38% | Salesforce ecosystem, B2B-specific scoring |
| Mailchimp | 37% | Frequently a secondary send tool, not primary CRM |
| Marketo (Adobe) | 33% | Larger contact volumes, complex lead scoring |
| HubSpot / Constant Contact (tied) | 29% | Mid-market, CRM-plus-marketing bundles |
What the stack costs per contact, not per plan
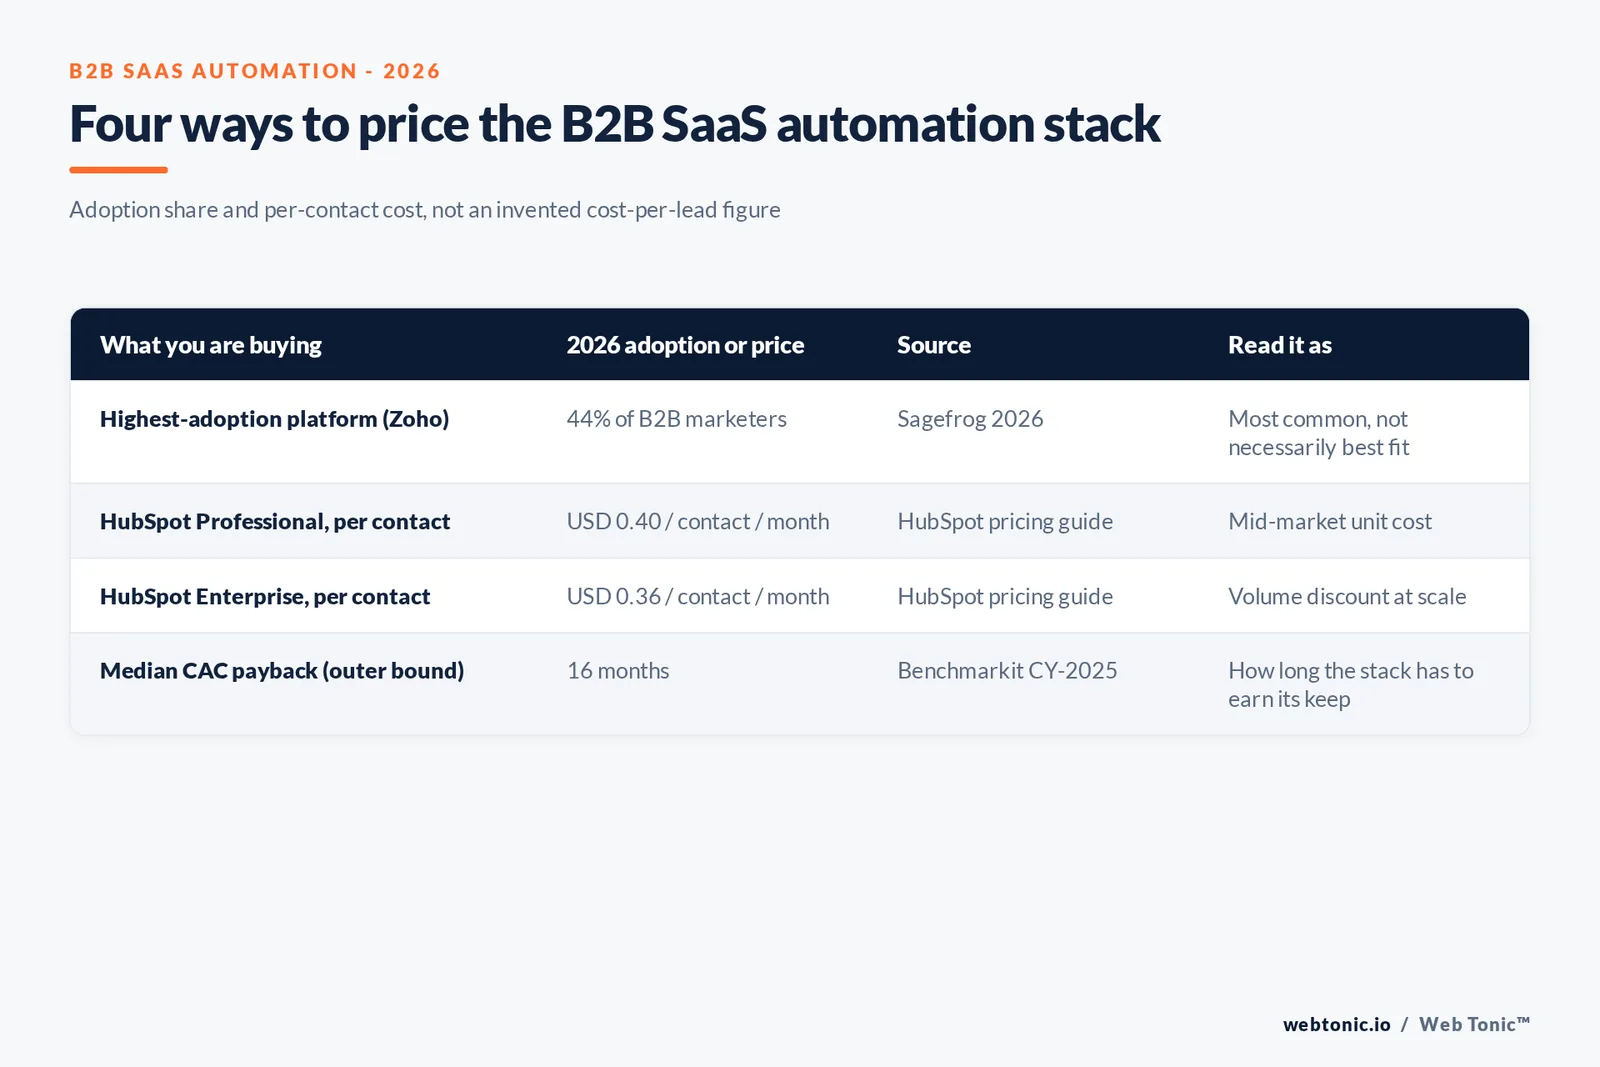
Reading vendor pricing as a per-contact rate, rather than a flat monthly fee, is the fairer way to compare platforms at SaaS-typical list sizes. HubSpot's own Marketing Hub pricing guide puts Professional at USD 800 a month for 2,000 contacts - USD 0.40 per contact per month before seat costs - and Enterprise at USD 3,600 a month for 10,000 contacts, or USD 0.36 per contact per month. Brevo's own pricing page caps its Professional tier at USD 499 a month on send volume rather than a hard contact ceiling, which changes the unit-cost math depending on send frequency.
| Tier | Monthly price | Contacts included | Effective cost per contact / month | Source |
|---|---|---|---|---|
| HubSpot Professional | USD 800 | 2,000 | USD 0.40 | HubSpot pricing guide |
| HubSpot Enterprise | USD 3,600 | 10,000 | USD 0.36 | HubSpot pricing guide |
| HubSpot Starter | USD 9-15 / seat | 1,000 | USD 0.009-0.015 | HubSpot pricing guide |
| Brevo Professional | USD 499 | Volume-based, no hard cap | Depends on send frequency | Brevo pricing page |
| Brevo Standard | USD 18 | Volume-based, no hard cap | Depends on send frequency | Brevo pricing page |
How fast a pipeline lead actually needs a routing rule
The same 2011 Harvard Business Review analysis of roughly 15,000 sales leads that anchors most routing arguments applies just as much to a demo-request form as to a solar quote request: contact odds fall sharply after the first hour, and the first five minutes are the highest-odds window recorded. It is a 2011, cross-industry figure, not a SaaS study, but it is the underlying case for instant lead-routing automation ahead of any nurture sequence.
What CTR a SaaS nurture sequence can realistically post
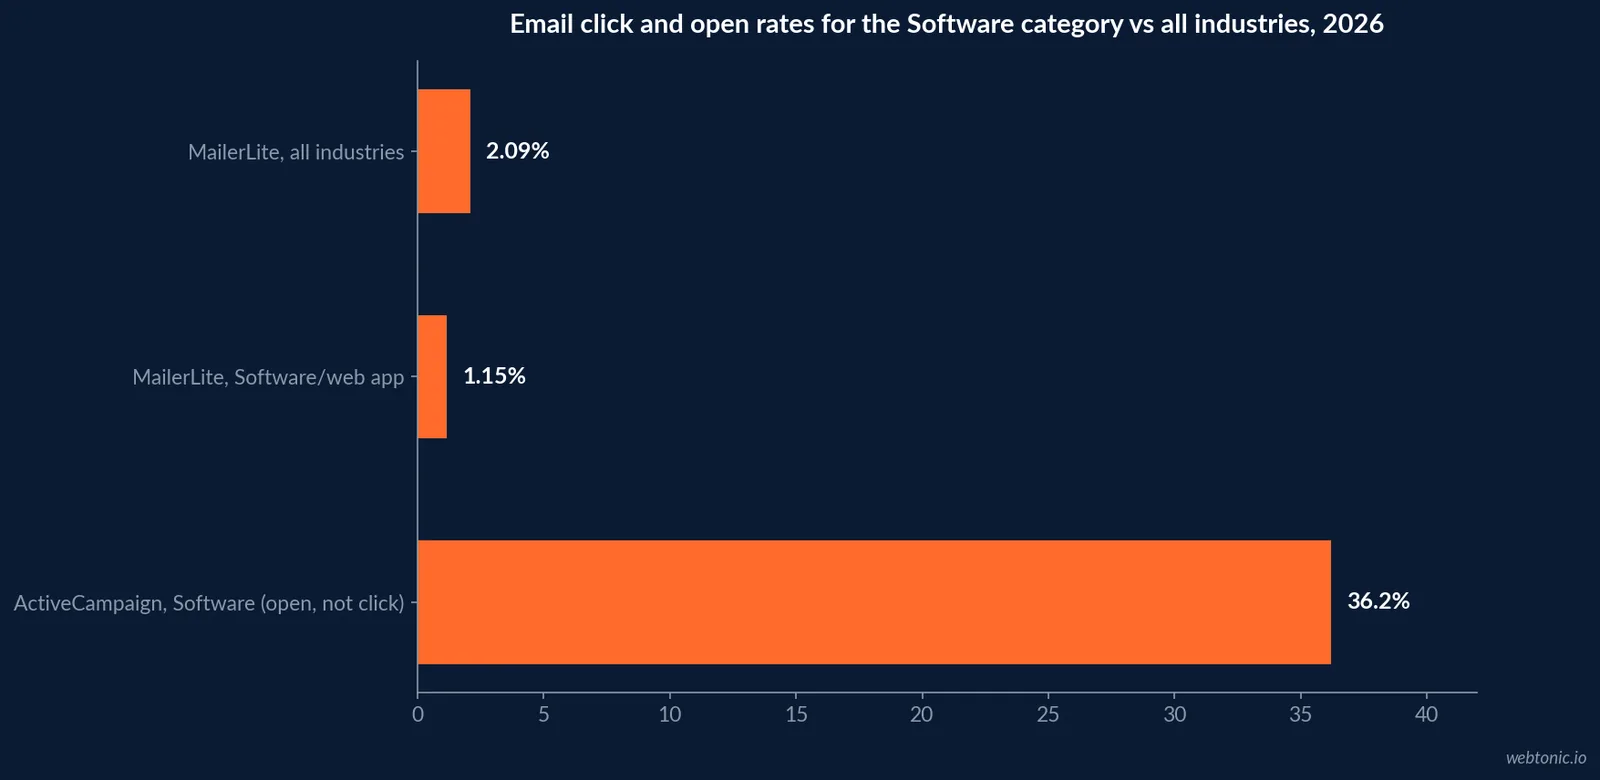
ActiveCampaign's own customer data, reflecting campaigns sent between January and December 2025, puts the Software category at a 36.20% open rate. A separate dataset, MailerLite's 2026 benchmarks (3.6 million campaigns), puts Software and web app at 39.31% open and 1.15% click - below the 2.09% all-industry click average in the same set, which tracks with SaaS lists typically being smaller and more segmented than e-commerce broadcast lists.
| Dataset | Category | Open rate | Click rate |
|---|---|---|---|
| ActiveCampaign (own customer data) | Software | 36.20% | Not separately published |
| MailerLite 2026 (3.6M campaigns) | Software and web app | 39.31% | 1.15% |
| MailerLite 2026, all industries | All | n/a | 2.09% |
| HubSpot 2025 (cross-industry) | All | n/a | 2.5% |
Where the budget actually sits
Sagefrog's same 2026 survey found marketing technology at 15% of the average planned 2026 budget increase, with AI tools and applications at 28% and content marketing at 30% ahead of it - and 37% of B2B marketers reporting they already run AI-enabled automation somewhere in the stack. Automation spend is real, but it is competing with content and AI tooling for the same incremental dollar, not sitting alone at the top of the list.
| 2026 budget-increase priority | Share of respondents | Source |
|---|---|---|
| Content marketing | 30% | Sagefrog 2026 |
| AI tools and applications | 28% | Sagefrog 2026 |
| Marketing technology | 15% | Sagefrog 2026 |
| Account-based marketing (ABM) | 11% | Sagefrog 2026 |
| Email marketing platforms and campaigns | 11% | Sagefrog 2026 |
What B2B teams actually want AI-enabled automation to do
Sagefrog's same 2026 survey asked marketers what they want AI inside their automation stack to achieve, and the ranking is telling: gaining better marketing insights leads at 29%, ahead of increasing content production at 26%, improving personalization at 15%, and improving lead quality at just 8%. Automating pipeline directly - "automate customer engagement" - ranked lowest of the measured goals at 6%. Most teams are buying insight and content speed first, not a self-driving pipeline.
| Primary goal for AI in the automation stack | Share of B2B marketers | Source |
|---|---|---|
| Gain better marketing insights | 29% | Sagefrog 2026 |
| Increase content production | 26% | Sagefrog 2026 |
| Improve personalization | 15% | Sagefrog 2026 |
| Improve lead quality | 8% | Sagefrog 2026 |
| Streamline workflows | 8% | Sagefrog 2026 |
| Automate customer engagement | 6% | Sagefrog 2026 |
Why the platform is rarely the actual bottleneck
Adoption numbers overstate how much value most teams extract. Ascend2's own State of Marketing Automation research found that 54% of marketers say they are not using their automation tools to their fullest potential, and that two-thirds report their tools are only somewhat or not at all integrated with the rest of the stack. Buying the platform with the highest adoption share from the table above does not fix that on its own - integration work does.
Deliverability sets the ceiling on every CTR figure above
Every click-rate figure quoted on this page assumes the email actually lands in an inbox. ActiveCampaign's own customer data reports a 93.4% deliverability rate for its users, against an 83.1% industry average - a ten-point swing that changes every open- and click-rate number in this article before automation logic even runs. A SaaS team comparing vendors on CTR alone, without asking about deliverability, is comparing an incomplete number.
That gap also compounds with contact-tier pricing: a platform charging USD 0.40 per contact per month is charging that rate whether the send lands in an inbox or a spam folder, which is one more reason the per-contact price alone is not the full comparison. A vendor unwilling to state its own deliverability rate is asking you to buy a per-contact price without knowing the denominator that actually decides how many of those contacts ever see the message.
How to price this without inventing a CPL
Start from the per-contact tooling cost above, add the CAC payback and blended CAC ratio from Benchmarkit as your outer bound, and treat the CTR figures as a sanity check on nurture performance, not a promise. A stack that cannot show its own numbers against these medians is asking to be judged on faith rather than benchmarks.
Our data and analytics practice builds that comparison before a plan gets written, and our growth marketing practice can wire the routing rules into your CRM; see also our marketing automation statistics hub for the cross-industry view, or talk to us about your specific stack.
Frequently Asked Questions
What does B2B SaaS marketing automation cost per contact?
Contact-tier pricing makes the per-contact cost fall as volume rises. HubSpot's own Marketing Hub Professional tier is USD 800 a month for 2,000 contacts (USD 0.40 per contact per month before seats), and its Enterprise tier is USD 3,600 a month for 10,000 contacts (USD 0.36 per contact per month). Brevo's own Professional tier runs USD 499 a month with volume-based email caps rather than a flat contact ceiling. Neither vendor publishes a per-lead cost - only a per-contact or per-send one.
Is there a real cost-per-lead figure for B2B SaaS pipeline?
Not one that names automation specifically. The closest verifiable benchmarks are cost-of-acquisition figures from Benchmarkit's CY-2025 report: a median blended customer acquisition cost ratio of USD 1.30 and a median CAC payback period of 16 months, both across a broad SaaS sample, not tied to any single channel or tool. Use those as your sanity check on a pipeline number, not as a quoted CPL.
Which automation platform do B2B SaaS marketers actually use?
Sagefrog's 2026 B2B Marketing Mix Report, its 19th annual survey, found no dominant platform: Zoho Marketing Automation topped adoption at 44%, ahead of Salesforce Marketing Cloud at 42% and Pardot (Account Engagement) at 38%. HubSpot and Constant Contact tied at 29%. Software and technology respondents were a modest share of that survey (6%), so read the ranking as broad B2B, not SaaS-only.
How fast does a fresh SaaS pipeline lead actually need a response?
Harvard Business Review's 2011 study of roughly 15,000 sales leads remains the most-cited figure: contact odds fall sharply once follow-up passes the first hour, and the first five minutes carry the best odds recorded. It is a 2011, cross-industry data point, not a SaaS-specific study, but it is the reason lead-routing automation exists in a pipeline stack at all.
What email CTR should a SaaS marketing team expect from automation?
ActiveCampaign's own customer data (campaigns sent 1/1/2025-12/10/2025) puts the Software category at a 36.20% open rate, and MailerLite's separate 2026 benchmark set (3.6 million campaigns) puts Software and web app at 39.31% open and 1.15% click - both below the cross-industry click average of 2.09% in the same MailerLite set, which is consistent with SaaS lists tending to be smaller and more engaged rather than broad.
Sources
Benchmarkit - CY-2025 B2B SaaS performance metrics benchmarks
Sagefrog - 2026 B2B Marketing Mix Report
HubSpot - Marketing Hub pricing guide
Brevo - Pricing
ActiveCampaign - Average email open rate glossary
MailerLite - Email marketing benchmarks by industry and region, 2026
HubSpot - Marketing statistics (State of Marketing 2026)
Harvard Business Review - The Short Life of Online Sales Leads (2011)
Ascend2 - State of Marketing Automation research
Web Tonic - Marketing automation statistics hub