



Table of contents
Unbounce's 2026 benchmark, built from 57 million conversions across 41,000 landing pages, puts median SaaS landing page conversion at 3.8% - 42% below the 6.6% all-industry baseline. Before budgeting a CRO program, a B2B SaaS founder needs to know which levers actually move that number and which ones are theater.
Key Takeaways
- Median SaaS landing page conversion is 3.8%, 42% below the 6.6% all-industry baseline (Unbounce).
- Hardware-focused SaaS pages convert best at 4.1%; data/infrastructure pages convert worst at 3.3%.
- Email-driven traffic converts at 16.9%, more than 4x the next-best channel.
- Google paid search traffic converts at 5.1%, under half the 11.3% all-industry paid-search rate.
- Instagram-driven traffic converts at 9.2%, almost 3x Facebook's 3.5%.
- Display-ad traffic converts at just 0.3% - over 300 visitors per conversion.
- Simple copy (5th-7th grade) converts at 12.9% versus 2.1% for professional-level copy.
- That is a 514% conversion difference from copy readability alone.
- 79% of SaaS landing page traffic is mobile.
- Mobile (6.4%) and desktop (6.2%) convert almost identically once traffic reaches the page.
- The best-performing pages use only 50 to 140 difficult words.
- B2B SaaS demo request pages convert at 1.1% visitor-to-lead in First Page Sage's full-funnel data.
- Marketing budgets sit at 9.0% of revenue in 2026, with spend growth of just 1.7% (The CMO Survey).
- 75% of B2B buyers prefer a rep-free purchase path (Gartner), which raises the stakes on a self-serve page.
Start with the number, not the tactic
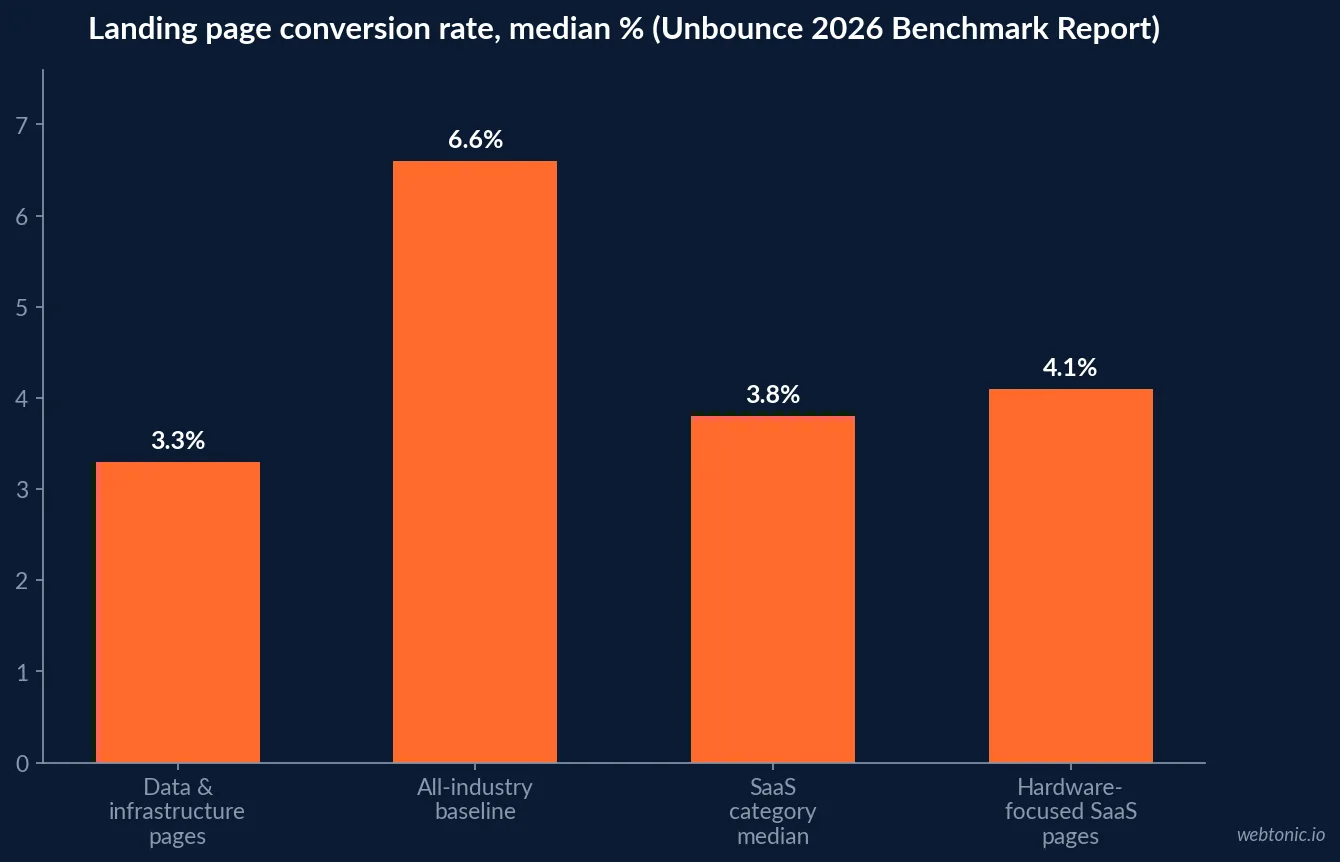
Unbounce's 2026 Conversion Benchmark Report, built from 57 million conversions across 41,000 landing pages and 464 million pageviews, puts the median SaaS landing page conversion rate at 3.8% - 42% below the 6.6% baseline across all industries. Inside the SaaS category itself, hardware-focused pages convert best at 4.1%, while data and infrastructure pages convert at just 3.3%.
Any CRO budget conversation should start here: a SaaS company benchmarking itself against the 6.6% all-industry number is comparing itself to restaurants, ecommerce and travel pages selling a far shorter consideration cycle.
| SaaS landing page category | Median conversion rate | Vs. all-industry baseline (6.6%) |
|---|---|---|
| Hardware-focused SaaS | 4.1% | -38% |
| SaaS, blended category median | 3.8% | -42% |
| Data and infrastructure SaaS | 3.3% | -50% |
| All industries, median | 6.6% | baseline |
Traffic source decides more than the page ever will
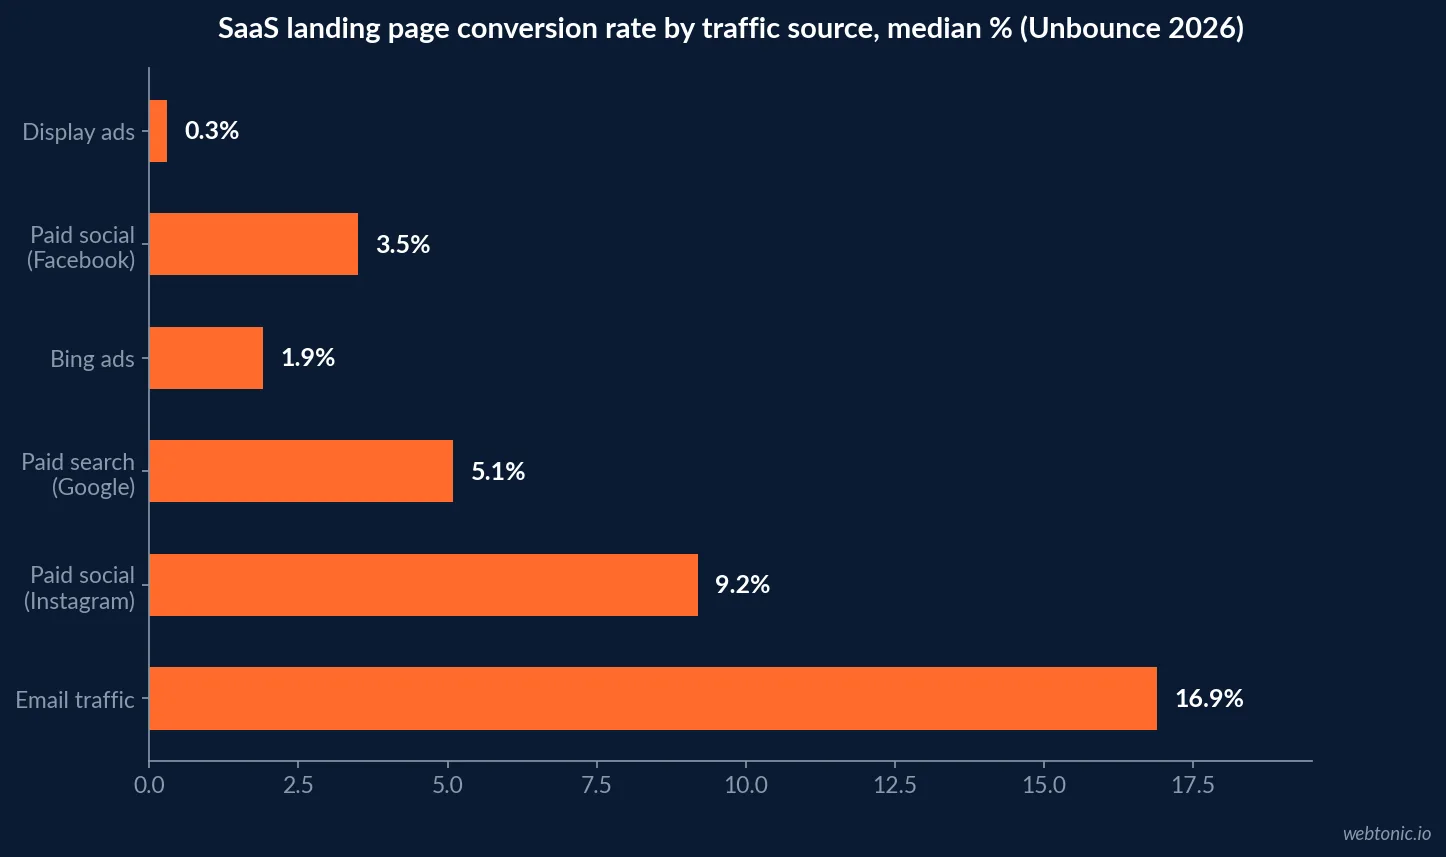
The single largest lever in Unbounce's data is not a headline or a form field - it is which channel sent the visitor. Email-driven traffic converts at a median 16.9%, more than four times the next-best channel. Google paid search follows at 5.1%, itself under half the 11.3% Google Ads conversion rate Unbounce measures across all industries. Instagram-driven traffic converts at 9.2%, nearly three times Facebook's 3.5%, and display ads convert at just 0.3% - meaning a display campaign needs over 300 unique visitors before it produces a single conversion.
A CRO budget spent redesigning a page that is fed mostly by display traffic will underperform the same budget spent simply routing more of that spend toward email and search.
| Traffic source | Median landing page conversion rate | Multiple vs. display ads |
|---|---|---|
| 16.9% | 56x | |
| Instagram (paid social) | 9.2% | 31x |
| Google (paid search) | 5.1% | 17x |
| Facebook (paid social) | 3.5% | 12x |
| Bing (paid search) | 1.9% | 6x |
| Display ads | 0.3% | 1x |
Copy readability is the highest-ROI change most teams skip
Unbounce's readability analysis found landing pages written at a 5th-to-7th-grade reading level converting at 12.9%, against 2.1% for professional-level copy - a 514% difference that costs nothing in ad spend or design time. The best-performing pages in the dataset used only 50 to 140 difficult words total. For a technical SaaS product where the instinct is to sound credible by sounding complex, this is frequently the single largest available lift before any paid test budget gets spent.
| Copy level | Median conversion rate | Relative lift vs. professional copy |
|---|---|---|
| 5th-7th grade reading level | 12.9% | +514% |
| Professional-level copy | 2.1% | baseline |
Mobile carries the traffic even when conversion rates tie
79% of all SaaS landing page visits happen on mobile devices, per Unbounce, even though mobile (6.4%) and desktop (6.2%) conversion rates land almost identically once a visitor reaches the page. That parity is deceptive: because the overwhelming majority of traffic never reaches a well-optimized desktop layout in the first place, a page that renders poorly on mobile is losing volume long before conversion rate becomes the relevant metric.
This matters more for B2B SaaS than it might for a retail brand, because the instinct on a technical product is still frequently to design the "real" version of the page for a desktop reviewer - a procurement lead, an IT evaluator - and treat mobile as an afterthought for casual browsing. The traffic numbers say that instinct has it backwards: the majority of the audience that decides whether a page lives or dies never opens it on a desktop at all.
| Device | Share of SaaS landing page traffic | Median conversion rate |
|---|---|---|
| Mobile | 79% | 6.4% |
| Desktop | 21% | 6.2% |
Demo pages and self-serve pages are not the same budget line
First Page Sage's full-funnel data puts overall B2B SaaS visitor-to-lead conversion around 1.1% - but that figure blends fundamentally different page types. A self-serve, no-credit-card trial signup pulls from a lower-commitment visitor than a sales-assisted demo request, and each should be budgeted, tested and reported against its own target rather than one shared number.
The stakes on getting the demo-request page right are rising: the Gartner B2B Buying Report finds 75% of B2B buyers prefer a rep-free purchase path, yet buyers who complete a purchase entirely self-service are 1.65x more likely to report purchase regret than rep-led buyers. A demo page that quietly loops in a human at the right moment is solving a problem Unbounce's raw conversion number cannot see.
A five-page CRO test order for a B2B SaaS site
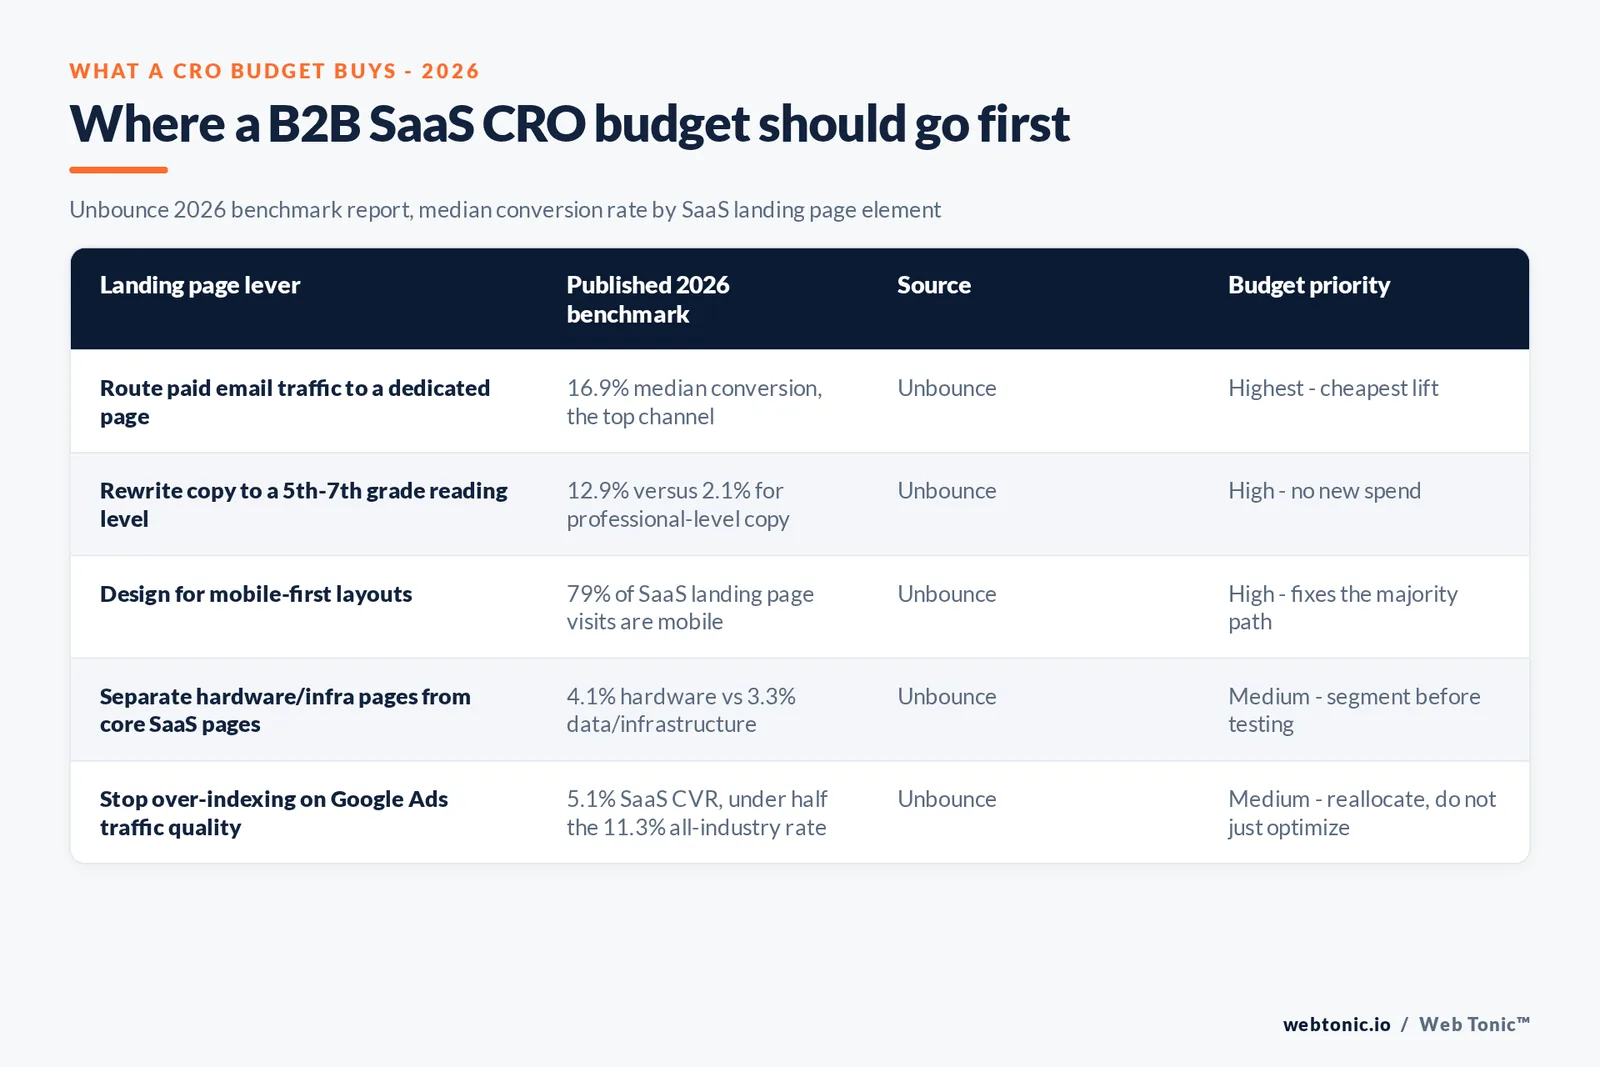
Given the size of the levers above, the order a lean SaaS team should test them in is not complicated. Fix traffic routing and page-to-source alignment first, since it costs nothing and the email-vs-display gap is the largest number on this page. Simplify copy second, for the same reason. Fix mobile rendering third, because it protects the 79% of visits already arriving there. Only then run a structural redesign test, and only then commission new creative assets - in that order, the cheap fixes should already have moved the baseline before the expensive ones get budgeted.
| Test order | Lever | Cost to implement | Why it goes here |
|---|---|---|---|
| 1 | Re-route paid spend toward email and search, away from display | Near zero | 56x conversion gap between email and display |
| 2 | Rewrite copy to a simpler reading level | Low - a copy pass, no new design | 514% conversion lift measured by Unbounce |
| 3 | Fix mobile layout and load speed | Low to moderate | 79% of SaaS landing page traffic is mobile |
| 4 | Segment hardware/infra pages from core SaaS pages | Moderate | 0.8-point conversion spread between sub-categories |
| 5 | Full structural redesign or new creative | Highest | Only worth testing once 1-4 are fixed |
The budget context: a flat pot, more scrutiny
Benchmarkit's CY-2025 benchmarks put median B2B SaaS customer acquisition cost payback at 16 months, which means a landing page that quietly loses conversions to bad copy or a broken mobile layout is adding months to that payback clock before anyone diagnoses why. G2's 2026 Buyer Behavior Report also finds budget approval is now cited by 39% of buyers as a friction point, rising to 50% among enterprise buyers - a demo or trial page that cannot answer a total-cost-of-ownership question is fighting that friction blind.
Sagefrog's 2026 B2B Marketing Mix Report finds cost efficiency is only the fourth reason B2B teams reach outside for marketing help, at 13%, behind bandwidth, speed and expertise - a reminder that a CRO engagement earns its budget by fixing what internal teams do not have time to diagnose, not by being the cheapest option on paper.
What this means for a CRO budget
Spend the first dollar on routing and copy, not on redesign. Confirm which traffic sources actually feed each page and weight budget toward email and search before touching layout; rewrite technical copy down to a simpler reading level before commissioning new creative; and fix mobile rendering issues before running a desktop-only test, since desktop is where the smaller share of traffic already lands. The CMO Survey 2026 puts overall marketing budgets at 9.0% of revenue with spend growth of only 1.7%, so a CRO program competing for that budget has to prove the cheap fixes first. Our data and analytics practice builds that traffic segmentation before recommending a redesign, and our breakdown of paid social ROI is a useful next read before allocating spend toward the channels this data shows actually convert, and talking to us is the fastest way to get that traffic segmentation built before your next test cycle.
Frequently Asked Questions
What is a good landing page conversion rate for B2B SaaS?
Unbounce's 2026 Conversion Benchmark Report, drawn from 57 million conversions across 41,000 landing pages and 464 million pageviews, puts the median SaaS landing page conversion rate at 3.8% - 42% below the 6.6% all-industry baseline. Within the SaaS category, hardware-focused pages convert best at 4.1%, while data-and-infrastructure pages convert at just 3.3%. Compare your own pages against the SaaS-specific number, not the blended average.
Which traffic source converts best on a SaaS landing page?
Email, by a wide margin. Unbounce's data shows email-driven visitors converting at a median 16.9% - more than four times the next-best channel. Google paid search follows at 5.1%, Instagram-driven traffic at 9.2%, Facebook at 3.5%, and display ads at just 0.3%. The first budgeting decision a SaaS founder should make is which traffic sources feed the page before touching the page itself.
Does copy complexity actually change conversion rate?
By a large margin. Unbounce found landing pages written at a 5th-to-7th-grade reading level converting at 12.9%, against 2.1% for professional-level copy - a 514% difference with no design or media spend involved. For a technical SaaS product, simplifying the copy is frequently the highest-ROI CRO change available before any A/B test budget is spent.
Should a SaaS company optimize for mobile or desktop first?
Mobile, by traffic volume if not by conversion parity. Unbounce reports 79% of all SaaS landing page visits happen on mobile devices, even though mobile (6.4%) and desktop (6.2%) conversion rates land close together. A page that renders poorly on mobile is losing the majority of its own traffic, regardless of how well the desktop version converts.
How does a demo-request page differ from a self-serve trial page for budgeting purposes?
They should be budgeted and measured separately. First Page Sage's B2B SaaS full-funnel data shows visitor to lead running around 1.1% for the category overall, but that number blends very different page types - a self-serve, no-credit-card trial page and a sales-assisted demo-request page pull from different buyer readiness levels and should not share one conversion target.
Sources
Unbounce - Average SaaS Conversion Rate Benchmark Report 2026
Unbounce - Average Conversion Rate by Industry Benchmark Report
First Page Sage - Average SaaS Conversion Rates 2026 Report
Gartner - B2B Buying Report
The CMO Survey - Highlights and Insights Report 2026
Benchmarkit - CY-2025 B2B SaaS Performance Metrics Benchmarks
G2 - 2026 Buyer Behavior Report: The Evaluation Maze
Sagefrog - 2026 B2B Marketing Mix Report


