



Table of contents
Roughly 5% to 8% of ad creatives ever become genuine winners, and B2B SaaS creative performs worse on raw hook rate than Meta or TikTok feed ads by design, not by weakness. This page separates what the auction data says about creative win rates and hook rates from what B2B tech buyers actually say moves them - two different, equally sourced 2026 pictures of what "working" means for a SaaS ad.
Key Takeaways
- About 5% of creatives clear Motion's 10x-median winner threshold in 2026.
- A separate 550,000+ ad dataset put winner rate near 8%.
- Creative quality drives roughly 56% of auction outcomes, more than bid or targeting.
- LinkedIn's average hook rate sits at 19%, median 26% (Benly 2026).
- LinkedIn's top 10% of creatives reach a 34% hook rate.
- Meta's all-placement average hook rate is 28%, almost 1.5x LinkedIn's.
- TikTok leads all platforms at a 33% average hook rate.
- UGC-style creative beats polished ads by 31% on hook rate (Benly).
- UGC also beats polished ads by 33% on click-through rate.
- LinkedIn's B2B cost per lead runs USD 202 against Facebook's USD 145 (Metadata).
- 44.9% of B2B tech teams test audience/segment-specific creative most often.
- 39.3% test message angle most often; 38.0% test hook or opening.
- Customer outcomes are the top proof type for 42.7% of B2B tech marketers.
- 93% of teams already have that proof material but cannot activate it.
- Only 38% have a standardized system for turning proof into creative.
- 35% of B2B tech teams report accelerating creative fatigue (Vidico).
- Budget is the top creative-testing constraint for 27.4% of teams.
How rare a "winning" ad creative actually is
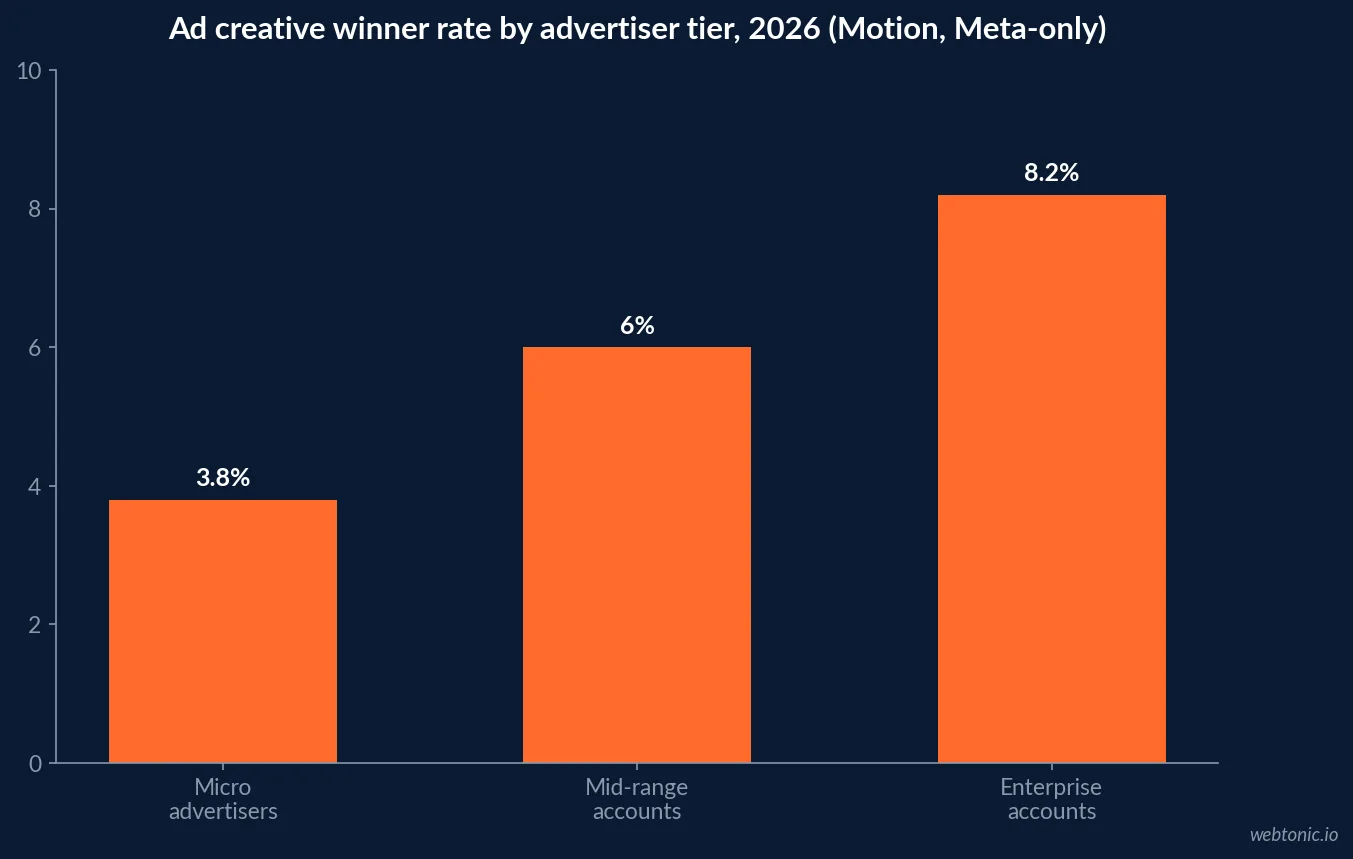
Motion's Creative Benchmarks 2026, analyzing 578,750 unique creatives launched by 6,015 advertiser accounts on Meta (roughly USD 1.29 billion in realized spend, Sept. 2025-Jan. 2026), defines a winner as one that spends at least 10x the account median with a USD 500 floor - a threshold that sits at the 92.3rd percentile of the spend distribution. Only about 7.7% of creatives clear it, and Motion's win-rate breakdown by advertiser tier shows the share climbing from 3.8% for micro advertisers to roughly 8.2% for enterprise accounts, since larger accounts run more concurrent tests. This dataset is Meta-only and spans all advertiser types, so read it as the cross-industry creative baseline B2B SaaS teams are competing inside of, not a SaaS-specific figure.
| Advertiser tier (Motion 2026, Meta-only, cross-industry) | Share of creatives that win |
|---|---|
| Micro advertisers | 3.8% |
| Mid-range accounts | ~5-6% |
| Enterprise accounts | ~8.2% |
| All accounts, blended | ~5-8% |
Why LinkedIn hook rates look lower than Meta's - and what that means
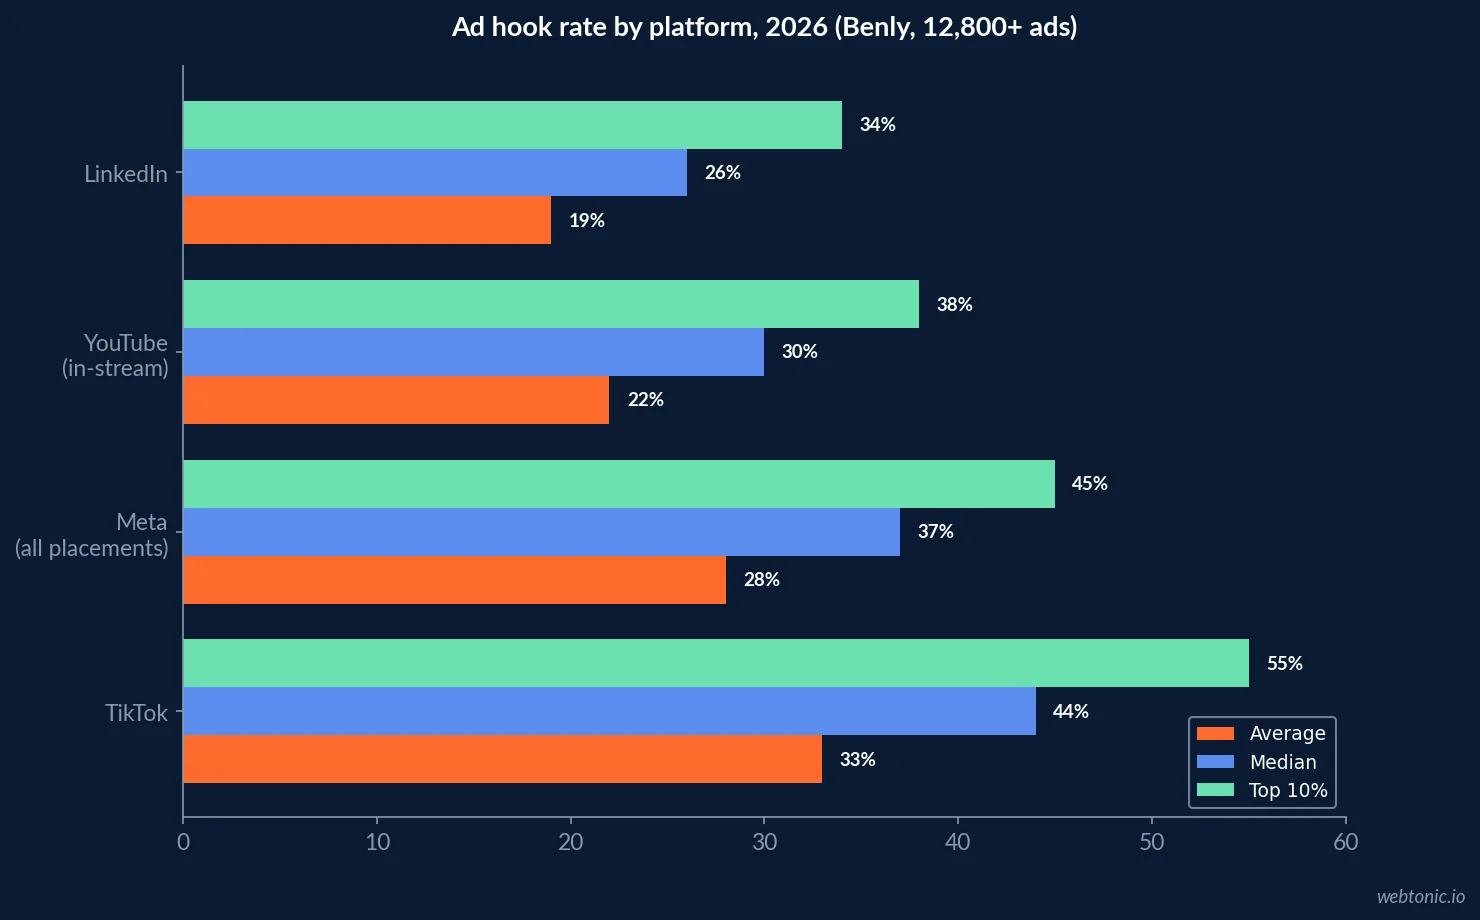
Benly's 2026 Ad Creative Benchmarks, built from an AI-scored analysis of more than 12,800 ads across Meta, TikTok, YouTube and LinkedIn, puts LinkedIn's average hook rate at 19% and median at 26%, with the top 10% of LinkedIn creatives reaching 34% and the bottom quartile at 12%. That trails Meta's all-placement average of 28% (top 10% at 45%) and TikTok's 33% (top 10% at 55%). The gap is structural: LinkedIn's B2B feed moves slower and carries less native video culture than Meta or TikTok, so a "good" LinkedIn hook rate should be benchmarked against LinkedIn's own distribution, not Meta's.
| Platform (Benly 2026, 12,800+ ads) | Avg. hook rate | Median | Top 10% | Bottom 25% |
|---|---|---|---|---|
| 19% | 26% | 34% | 12% | |
| Meta (all placements) | 28% | 37% | 45% | 18% |
| Meta (Instagram Reels) | 31% | 40% | 50% | 20% |
| TikTok | 33% | 44% | 55% | 21% |
| YouTube (in-stream) | 22% | 30% | 38% | 14% |
| 21% | 29% | 37% | 13% |
UGC versus polished studio creative
Benly's data also settles the format question with a number: UGC-style creative outperforms polished brand creative by roughly 31% on hook rate and 33% on click-through rate across the analyzed set. That does not make polish worthless - it means unpolished, testimonial-style creative earns more attention at the top of the funnel, which is consistent with why Vidico's separate 2026 survey of 230-plus B2B tech marketing leaders lists format (UGC vs. polished vs. motion) as one of the three variables B2B teams test most, alongside audience and message angle - not a variable most teams have already decided.
Where paid social spend actually lands once a creative wins matters too: Metadata's 2026 B2B Advertising Benchmarks (153 advertisers, USD 57.6 million of 2025 spend) puts LinkedIn's cost per lead at USD 202 against Facebook's USD 145 and Instagram's USD 138 - a premium that raises the stakes on getting the creative right before scaling spend behind it.
| Creative format comparison (Benly 2026) | Hook rate delta | CTR delta |
|---|---|---|
| UGC-style vs. polished brand creative | +31% | +33% |
What B2B tech teams actually test, and what stops them testing more
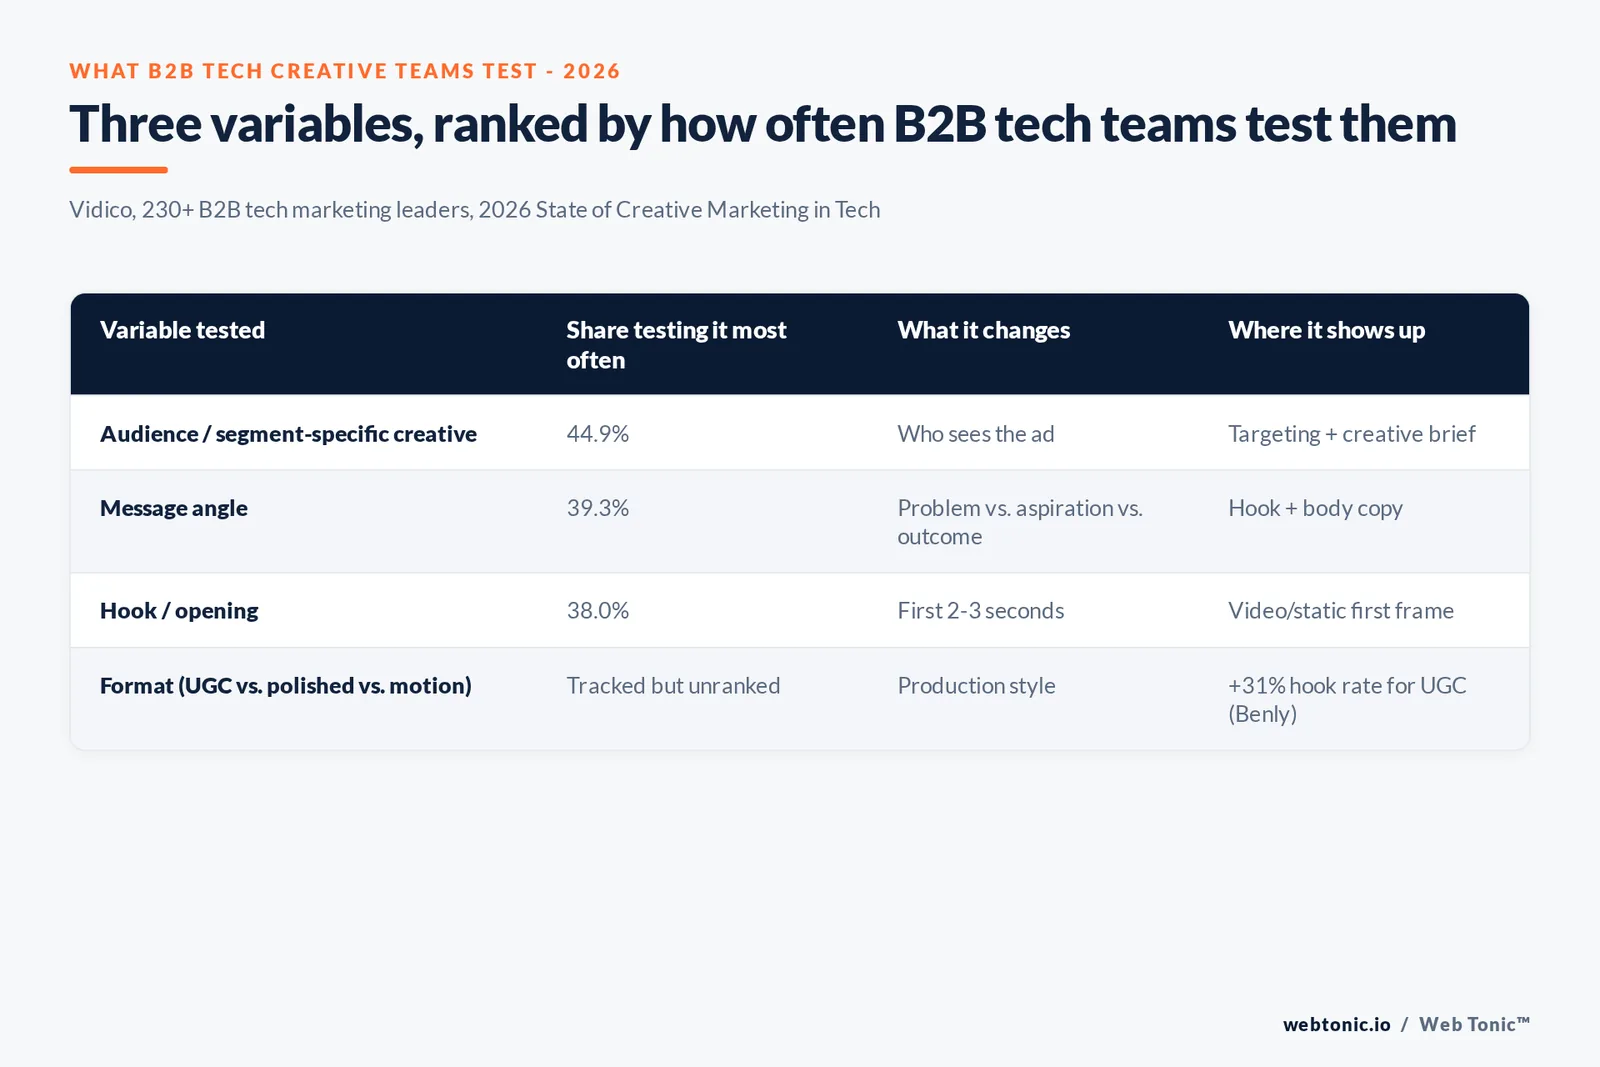
Vidico's 2026 survey found audience or segment-specific creative is tested most often, named by 44.9% of B2B tech marketing leaders, followed by message angle at 39.3% and hook or opening at 38.0%. 65% of respondents run structured creative experimentation at least monthly, but the number one barrier to doing more of it is a gap between the media team running the ads and the creative team making them - not a shortage of ideas. Budget still leads as the single biggest constraint at 27.4%, with measurement/attribution (14.1%), slow approvals (13.2%) and bandwidth (12.8%) close behind.
| What gets tested most (Vidico 2026, B2B tech) | Share of teams testing it most often |
|---|---|
| Audience / segment-specific creative | 44.9% |
| Message angle (problem vs. aspiration vs. outcome) | 39.3% |
| Hook / opening | 38.0% |
What the creative should say: proof beats polish
The same Vidico dataset is unambiguous on content, not just format: customer outcomes and results is the most persuasive proof type in B2B tech, named by 42.7% of marketing leaders, ahead of every other category tested. The bottleneck is not a shortage of proof - only 6.8% of teams say they lack proof material, meaning roughly 93% already have customer evidence sitting in case studies, ROI results or testimonials somewhere. It simply is not packaged into tested ad creative: 85% have at least a partial system for turning proof into creative assets, but only 38% have standardized it end to end.
TrustRadius's 2026 B2B Buying Disconnect Report, surveying 1,862 technology buyers and 444 technology vendors, backs this from the buyer side: even with AI research tools in the mix, buyers still fact-check claims and lean on demos, trials and reviews - the exact proof formats Vidico's creative-side data says B2B tech marketers already have and underuse.
| Proof/testing signal (2026) | Figure | Source |
|---|---|---|
| Most persuasive B2B tech proof type: customer outcomes | 42.7% | Vidico |
| Teams that say they lack proof material | 6.8% | Vidico |
| Teams with a fully standardized proof system | 38% | Vidico |
| Teams reporting accelerating creative fatigue | 35% | Vidico |
| Top creative-testing constraint: budget | 27.4% | Vidico |
How this compares once the creative moves into paid media
Winning the auction and winning the buyer are separate questions. A creative that clears LinkedIn's hook-rate bar still lands inside the cost structure our Google Ads pricing guide and Meta ROI analysis both map for B2B budgets generally, and Metadata's channel-level cost-per-lead figures above show why: a LinkedIn creative earning a 34% hook rate is still competing against a USD 202 cost per lead, more than any other channel in that dataset. Creative quality buys efficiency inside a channel; it does not change which channel is structurally cheaper.
Building a creative testing cadence that matches the win rate
If only 5% to 8% of creatives win, the planning implication is volume, not perfection: a team needs roughly 20 fresh launches to expect one durable winner, tested along the three axes - audience, message angle and hook - that B2B tech teams already say they test most, packaged around the customer-outcome proof buyers respond to. Benly's data is a reminder that the bottom quartile is not random noise either: LinkedIn's weakest creatives average a 12% hook rate, roughly a third of the top decile's 34%, which usually means the concept itself, not the media buy, needs replacing rather than refreshing. Our performance creative team runs that cadence against LinkedIn's structurally lower hook-rate ceiling rather than grading it against Meta, and our growth marketing practice sizes the paid spend once a creative clears the bar.
Frequently Asked Questions
What percentage of ad creatives actually become winners?
A small minority, and the number holds across two independent 2026 datasets. Motion's Creative Benchmarks 2026, analyzing 578,750 unique creatives from 6,015 Meta advertiser accounts (roughly USD 1.29 billion in spend), found about 5% of creatives clear its 10x-median winner threshold; a separate 550,000-plus ad dataset put the figure closer to 8%. Either way, the honest planning number is that most creative variants you launch will not win, so volume and speed of testing matter more than perfecting any single asset.
What is a good hook rate for a B2B ad on LinkedIn versus Meta?
Benly's 2026 Ad Creative Benchmarks, built from analysis of over 12,800 ads across Meta, TikTok and Google, puts LinkedIn's average hook rate at 19% (median 26%), with the top 10% of LinkedIn creatives reaching 34% and the bottom quartile at 12%. That is meaningfully lower than Meta's all-placement average of 28% (top 10% at 45%) or TikTok's 33% (top 10% at 55%), which reflects LinkedIn's narrower, lower-scroll-velocity B2B feed rather than weaker creative.
Do UGC-style ads actually outperform polished studio ads for B2B?
On average, yes, though the size of the gap depends on who measured it. Benly's 2026 benchmark data found UGC-style creative outperforms polished brand creative by roughly 31% on hook rate and 33% on click-through rate, across an analysis of 12,000-plus ads. Vidico's separate 2026 survey of 230+ B2B tech marketing leaders lists format (UGC vs. polished vs. motion) as one of the three most commonly tested creative variables, alongside audience/segment targeting and message angle - meaning most serious B2B tech teams treat this as an open question to test, not a settled rule.
What do B2B SaaS creatives get tested on most?
Vidico's 2026 data on 230+ B2B tech marketing leaders found audience or segment-specific creative is tested most often, named by 44.9% of teams, followed by message angle at 39.3% and hook or opening at 38.0%. The number one barrier to doing more of this testing is a gap between the media team running the ads and the creative team making them - not a lack of ideas.
What proof element should a B2B SaaS ad creative lead with?
Customer outcomes and results, by a wide margin. Vidico's 2026 survey found customer outcomes and results is the single most persuasive proof type in B2B tech, named by 42.7% of marketing leaders - ahead of every other category tested, including feature demonstrations or company credentials. The same report found 93% of teams already have that proof material sitting somewhere; the gap is almost always in packaging it into a tested creative, not in generating it.
Sources
Motion, Creative Benchmarks 2026
Benly, Ad Creative Benchmarks 2026
Vidico, State of Creative Marketing in Tech 2026
Metadata, 2026 B2B Advertising Benchmarks
TrustRadius, 2026 B2B Buying Disconnect Report


