



Table of contents
A B2B software buying group larger than five people sees its odds of completing a purchase fall from 53% to 31%, per Challenger's own analysis - and roughly half of that group is invisible to most ABM programs. The budget question below is not just how much to spend, but whether the account strategy is even reaching the buyers who can kill the deal silently.
Key Takeaways
- High-tech is the single largest ABM survey segment, at 38% of respondents.
- Deal completion odds fall from 53% to 31% once a buying group exceeds five people.
- "Hidden Buyers" hold 49% of decision-making sway versus 51% for visible buyers.
- 81% said "everyone" or "almost everyone" knew the brand that was eventually bought.
- Only 4% bought a brand known solely to the recommending function.
- 40% to 60% of B2B deals get abandoned when the buying group cannot agree.
- 40% of 2024 marketing budgets went to ABM among practitioners already running it.
- 87% plan to increase 2025 ABM spend, by an average of 9%.
- 81% report ABM delivers higher ROI, averaging 6.5% above other initiatives.
- 61% run more than one type of ABM program at once.
- 71% of B2B marketers overall now run an ABM strategy, up 4 points year over year.
- 30% of ABM programs target just 1-25 accounts, 21% target 26-50.
- Sales teams select the account list at 70% of organizations.
- Proving ROI is the top ABM challenge, cited by 47% of practitioners.
- 92% of ABM practitioners use email to engage the account list.
- No major ABM platform publishes a rate card - pricing is custom-quoted throughout.
ABM's home turf is high-tech, not an emerging use case
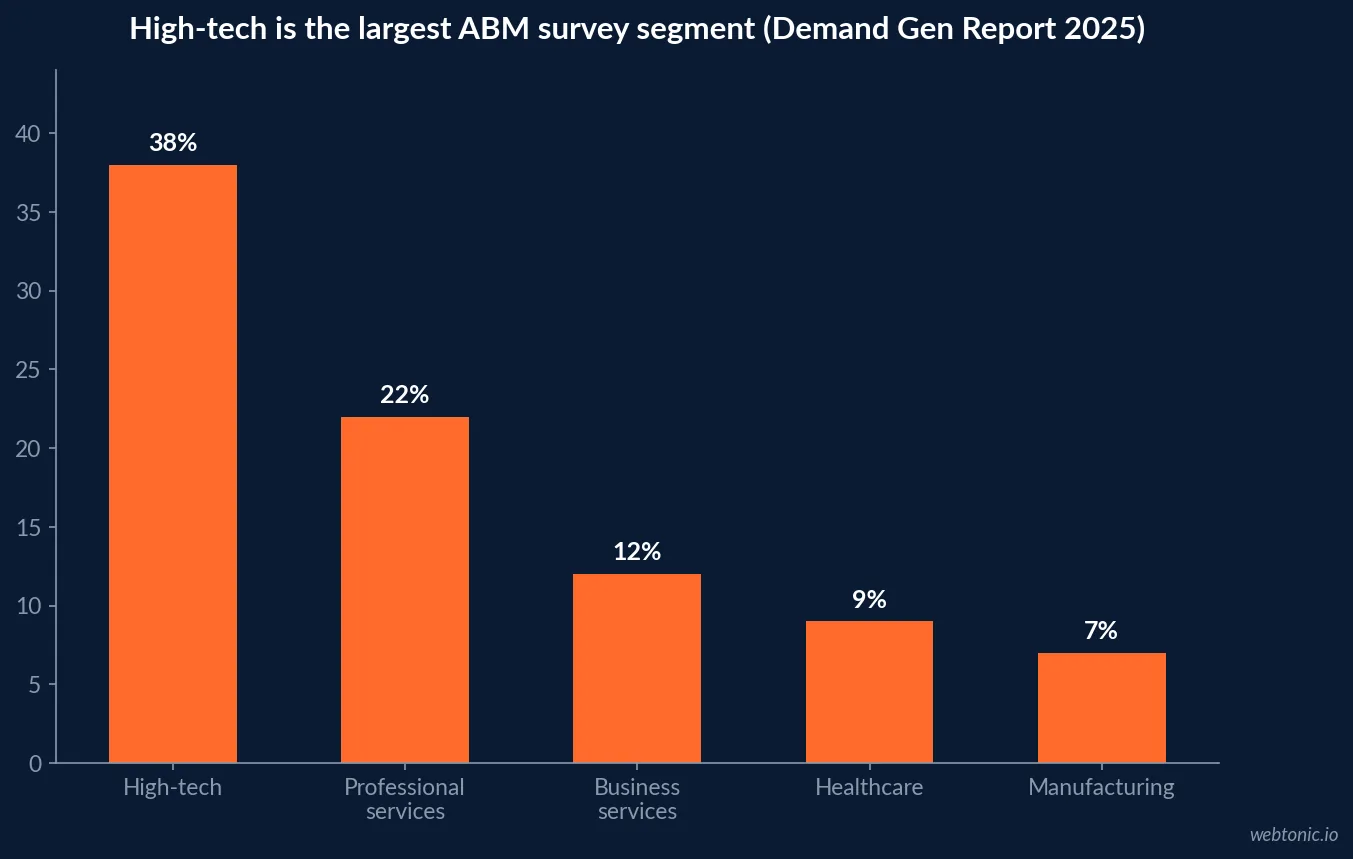
Demand Gen Report's 2025 Account-Based Marketing Benchmark Survey drew 38% of its respondents from the high-tech sector - more than professional services (22%), business services (12%), healthcare (9%) and manufacturing (7%) combined against any single one of them. ABM's benchmark data is disproportionately SaaS-and-tech data already; a software marketer reading a generic ABM survey is mostly reading about companies like their own.
| Industry share of ABM survey respondents (Demand Gen Report 2025) | Figure |
|---|---|
| High-tech | 38% |
| Professional services | 22% |
| Business services | 12% |
| Healthcare | 9% |
| Manufacturing | 7% |
The buying committee problem is bigger than the visible list
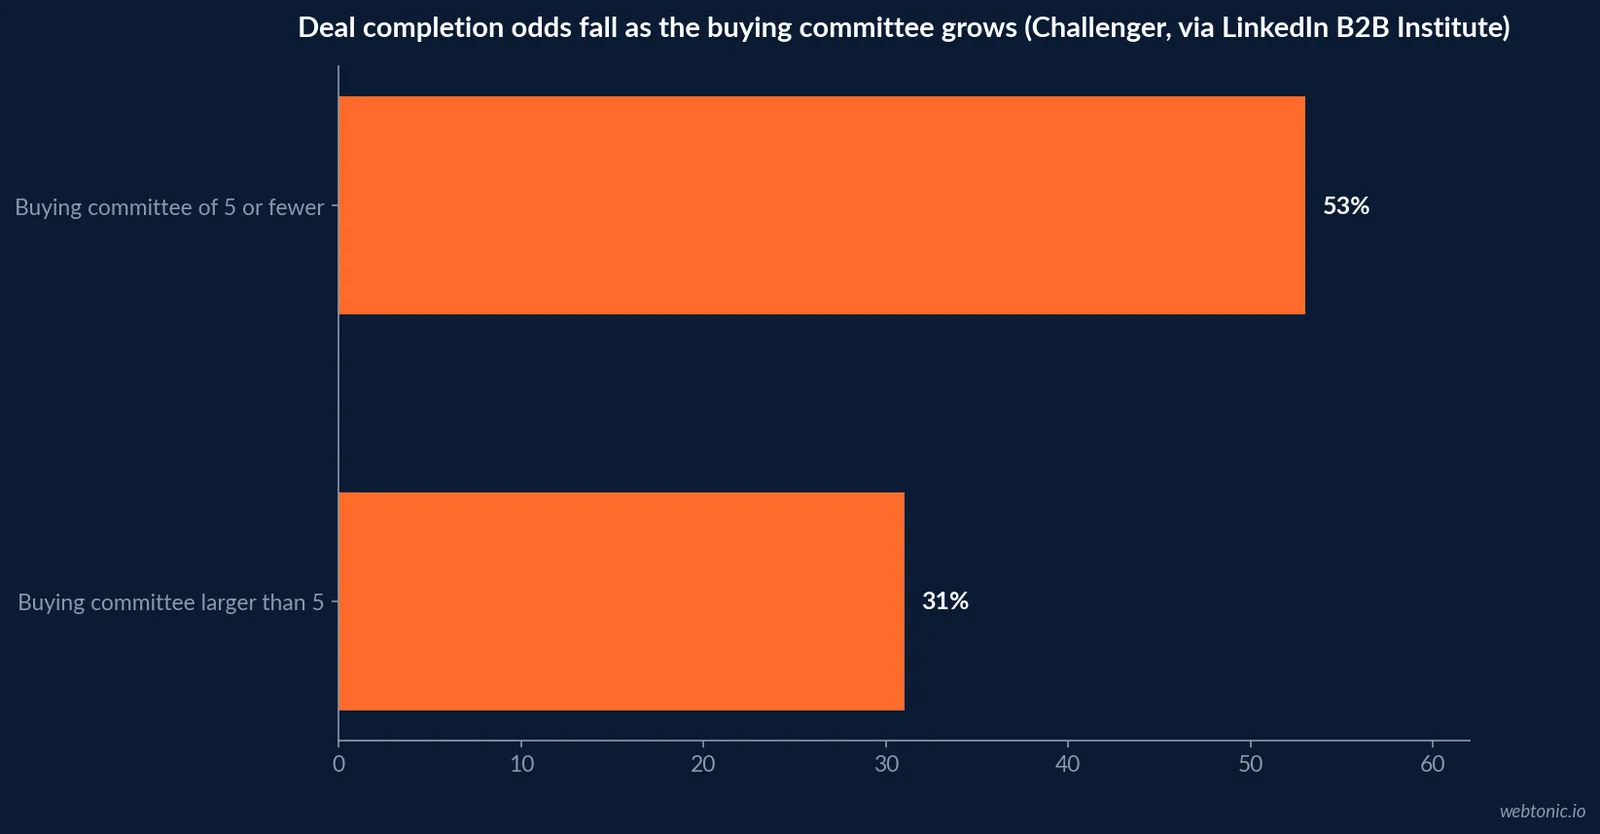
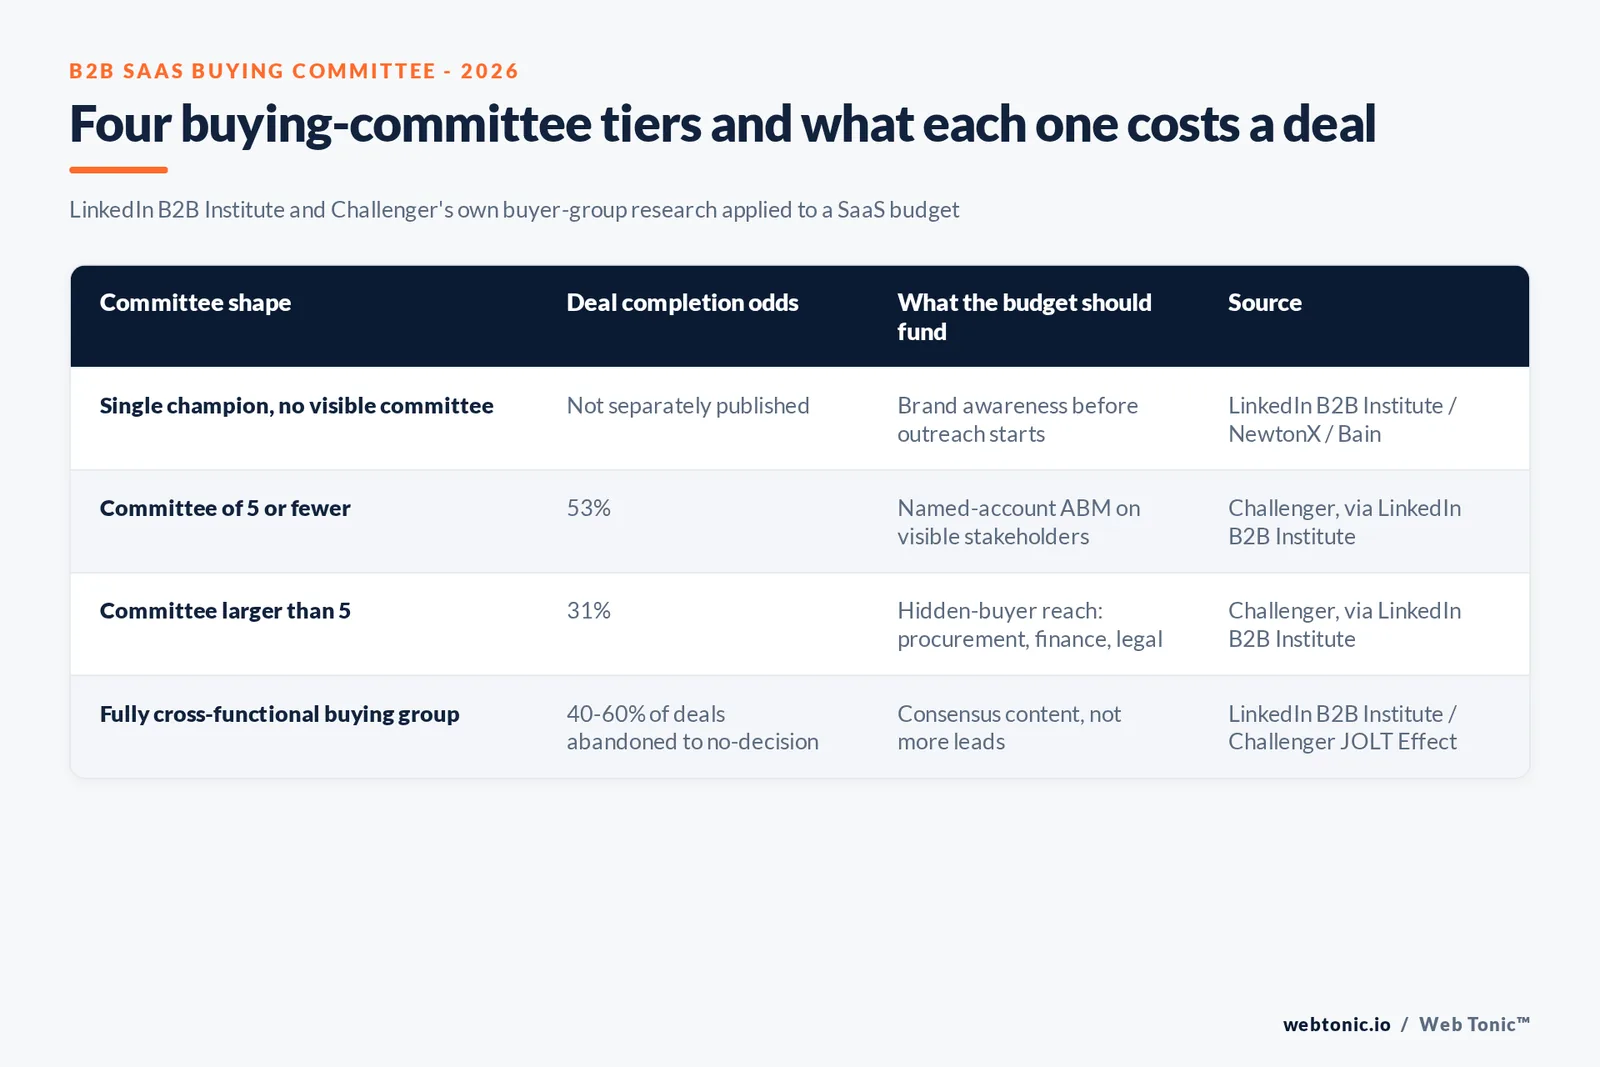
LinkedIn's B2B Institute, partnering with NewtonX and Bain & Company, researched the social and emotional dynamics of B2B group decision-making and found that "Hidden Buyers" - stakeholders in procurement, finance or legal who never engage with ads, content or intent signals - hold 49% of decision-making sway inside the buying group, against 51% for the visible "Target Buyers" most ABM programs are built to reach. That same LinkedIn research cites Challenger's own analysis of buying-group gridlock: once the decision-making team grows beyond five people, the likelihood of completing a deal drops from 53% to 31%.
Brand familiarity is what closes that gap: 81% of respondents in the same research said "everyone" or "almost everyone" on the buying team knew the brand that was eventually bought, and only 4% bought a product known solely to the person who recommended it. The overall estimate is that 40% to 60% of B2B deals are abandoned specifically because the buying group could not reach consensus.
| Buying-group dynamic | Figure | Source |
|---|---|---|
| Decision-making sway, Hidden Buyers vs Target Buyers | 49% vs 51% | LinkedIn B2B Institute / NewtonX / Bain |
| Deal completion odds, committee of 5 or fewer | 53% | Challenger, via LinkedIn B2B Institute research |
| Deal completion odds, committee larger than 5 | 31% | Same Challenger analysis |
| Buyers who all knew the eventual brand at the start | 81% | LinkedIn B2B Institute / NewtonX / Bain |
| Deals bought on the recommender's knowledge alone | 4% | Same research |
| B2B deals abandoned over buying-group disagreement | 40-60% | Same research |
Challenger's own site corroborates the trend line, if not the exact drop-off figure above: its buying-group gridlock research tracked the typical B2B buying group growing from 5.4 people in 2009 to 6.8, then 10.2, then just under a dozen by 2019, and found up to 38% of purchase attempts end in "no decision" - a buyer starting the process only to quit before changing anything. Separately, Matt Dixon and Ted McKenna's The JOLT Effect, cited on the same Challenger page, attributes 40-60% of all lost deals to exactly that no-decision outcome, not to a competitor win - the same range LinkedIn's research reaches independently for buying-group disagreement above.
What the budget and ROI benchmarks say
Applied to a SaaS team already running ABM, Momentum ITSMA's 2024 Global State of Account-Based Marketing Benchmark reports 40% of 2024 marketing budget dedicated to ABM among practitioners, 87% planning to increase 2025 spend by an average of 9%, and 81% reporting an average 6.5% ROI lift over other marketing initiatives. Demand Gen Report's 2025 survey separately found 71% of B2B marketers overall now run an ABM strategy, up four points year over year, with proving ROI or attribution the top cited challenge at 47% - a harder problem when the buying group itself is only half visible, as the LinkedIn research above shows.
| ABM budget and ROI benchmark (cross-industry, high-tech heavily represented) | Figure | Source |
|---|---|---|
| Share of 2024 marketing budget dedicated to ABM | 40% | Momentum ITSMA 2024 |
| Practitioners planning to increase 2025 ABM spend | 87% | Momentum ITSMA 2024 |
| Average planned spend increase | 9% | Momentum ITSMA 2024 |
| Average reported ROI lift over other initiatives | 6.5% | Momentum ITSMA 2024 |
| B2B marketers overall now running ABM | 71% | Demand Gen Report 2025 |
| Practitioners citing proving ROI as the top challenge | 47% | Demand Gen Report 2025 |
That ABM allocation competes for a shrinking overall pool. The CMO Survey 2026 reports marketing budgets have fallen to 9.0% of revenue and 9.6% of overall company budgets, their lowest share in several years, with companies now spending almost 60% of that budget on retaining and expanding existing customers rather than pursuing new accounts. A SaaS ABM program justifying a 40% share of a smaller pie has to make the buying-committee case above explicitly, not just cite the cross-industry ROI average.
Account-list size and who picks the accounts
Most ABM programs, in software as elsewhere, run a short list. Demand Gen Report's survey found 30% of practitioners target 1-25 accounts and 21% target 26-50 - a majority under 50 named accounts. Sales teams drive that selection at 70% of organizations, ahead of firmographic data (66%) and behavioral/intent signals (58%), and 92% of practitioners use email as an account-engagement channel, ahead of in-person events at 72%.
| ABM account-list practice (Demand Gen Report 2025) | Figure |
|---|---|
| Target 1-25 accounts | 30% |
| Target 26-50 accounts | 21% |
| Sales team selects the account list | 70% |
| Use firmographic data to build the list | 66% |
| Use behavioral/intent signals | 58% |
| Use email to engage the account list | 92% |
| Use in-person events to engage the account list | 72% |
What content earns trust with a half-invisible committee
If half the buying group never touches an ad or a webinar, content strategy has to work through the visible half to reach the hidden one. Demand Gen Report's 2025 survey found 71% of marketers cite content tailored to specific industries or roles as their top ABM messaging format, followed by content built around account-specific challenges at 43% and fully personalized, per-account content at 38%. Case studies (19%) and guides or e-books (15%) rank as the most-valued formats overall - both are exactly the kind of third-party-credibility content a Hidden Buyer in finance or legal is more likely to trust than a product demo aimed at the visible champion.
That maps directly onto the LinkedIn B2B Institute finding above: Hidden Buyers rated 'reliable brands,' 'peace-of-mind' and 'vendors trusted by my peers' as their top decision drivers, versus 'advanced features' and 'innovation' for Target Buyers. A content plan built only around product capability is optimized for the half of the committee that was never going to block the deal.
| ABM content format (Demand Gen Report 2025) | Cited as top priority | Which buyer segment it serves best |
|---|---|---|
| Tailored to industry or role | 71% | Both - baseline relevance for the whole committee |
| Built around account-specific challenges | 43% | Target Buyers - product-fit evaluation |
| Fully personalized per account | 38% | Target Buyers - the visible champion |
| Case studies | 19% | Hidden Buyers - third-party proof, low product detail |
| Guides / e-books | 15% | Hidden Buyers - credibility without a sales pitch |
Tooling: still no rate card
None of the major ABM platforms publishes pricing. Demandbase's own pricing page states outright that a plan is customized after a form submission, with no tier or dollar figure disclosed publicly. RollWorks (AdRoll ABM), 6sense and Terminus (now part of DemandScience) follow the same custom-quote pattern. Budgeting a SaaS ABM platform purchase means budgeting for a sales process before a price, which is itself a reason to nail down the account list and buying-committee map first - a vendor demo call is a poor place to be discovering that the real committee is twice the size you assumed.
Our data and analytics practice builds the buying-committee mapping layer most SaaS teams skip before they license an ABM platform, and our growth marketing practice sequences that account strategy against paid demand for the stakeholders still outside the named account list. For the cross-industry ABM baseline this page draws on, see our account-based marketing statistics hub. Talk to us about sizing a program against your own pipeline data.
Frequently Asked Questions
Why does ABM matter more for SaaS than for a typical B2B category?
Because the high-tech sector is the single largest segment already running it. Demand Gen Report's 2025 Account-Based Marketing Benchmark Survey drew 38% of its respondents from high-tech, more than professional services (22%), business services (12%), healthcare (9%) or manufacturing (7%) combined against any one of them - ABM is not an emerging tactic in SaaS, it is the default motion for the category's most mature marketing teams.
How big is the buying group a SaaS ABM program actually has to reach?
Bigger than the visible stakeholder list. LinkedIn's B2B Institute, partnering with NewtonX and Bain & Company, found that 'Hidden Buyers' - influential stakeholders from procurement, finance or legal who never engage with ads or content - hold almost equal decision-making sway to the visible 'Target Buyers' who do: 49% versus 51%. Challenger's own analysis, cited in that same research, found deal completion odds drop from 53% to 31% once the buying group grows beyond five people.
What does the ABM budget actually look like for teams already running it?
Momentum ITSMA's 2024 Global State of Account-Based Marketing Benchmark, surveying B2B ABM practitioners, found they already dedicate 40% of their 2024 marketing budget to ABM, that 87% plan to increase 2025 spend by an average of 9%, and that 81% report ABM delivers an average 6.5% higher ROI than other marketing initiatives. None of that is SaaS-specific data - it is the cross-industry benchmark a SaaS team is being measured against.
What size account list do most B2B teams actually target?
Small. Demand Gen Report's 2025 survey found 30% of ABM practitioners target 1-25 accounts and 21% target 26-50 - a majority run a tight, named list rather than a broad programmatic one. Sales teams select that list at 70% of organizations, ahead of firmographic data (66%) and intent signals (58%).
What does ABM tooling cost for a SaaS go-to-market team?
There is no published rate card. Demandbase's own pricing page states plainly that a plan is customized after a form submission, with no tier or dollar figure disclosed; RollWorks (AdRoll ABM), 6sense and Terminus (now part of DemandScience) follow the same custom-quote pattern across the category. Budget conversations with any of these vendors start from a demo call, not a price list.
Sources
Demand Gen Report - 2025 Account-Based Marketing Benchmark Survey
LinkedIn B2B Institute (with NewtonX, Bain & Company) - The Hidden Buyer Gap
Momentum ITSMA - 2024 Global State of Account-Based Marketing Benchmark
Demandbase - Pricing (custom quote, no published tier)
ABM Leadership Alliance / ITSMA - ABM benchmark study series
Challenger - Growing B2B buying groups are driving purchasing gridlock
The CMO Survey 2026 - Highlights and Insights Report


