Table of contents
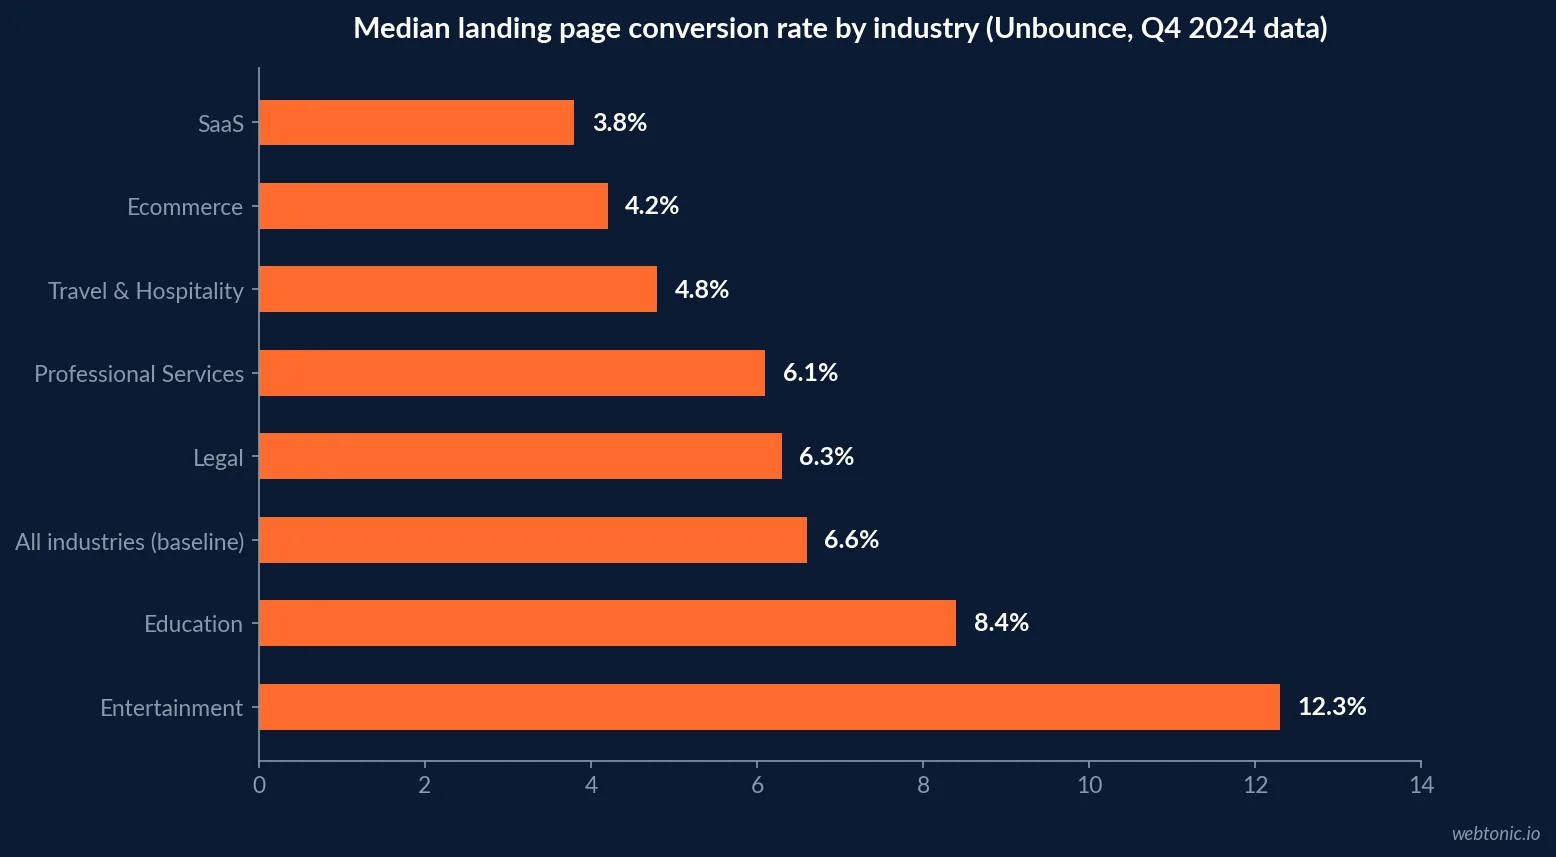
Unbounce's 2024 Conversion Benchmark Report puts the median landing page conversion rate at 6.6% across all industries — but that single figure buries a spread from 3.8% in SaaS to 12.3% in entertainment. Most industries land somewhere in a 4%–8% band, well short of the double-digit numbers often quoted out of context. Here is the industry-by-industry data, the traffic-source data behind it, and where each number stops being useful.
Key Takeaways
- The median landing page conversion rate across all industries is 6.6%, based on Unbounce's analysis of more than 57 million conversions and 41,000+ landing pages (Q4 2024 data).
- SaaS landing pages median just 3.8% — the lowest of the industries Unbounce has published a deep dive for.
- Entertainment pages median 12.3%, nearly double the all-industry baseline, largely driven by low-commitment sweepstakes offers.
- Travel & hospitality pages median 4.8%, about 37% below the all-industry baseline.
- Education pages median 8.4%, roughly 27% above the baseline.
- Legal pages median 6.3% and professional services pages median 6.1%, both close to the overall line.
- Traffic source moves conversion rate more than most redesigns can: email converts at 19.3% versus 10.9% for paid search on the same style of page.
- Ecommerce landing pages median 4.2%, its own distinct category rather than a lead-gen comparison point.
The industry-by-industry median, in context
Unbounce's Conversion Benchmark Report is built from landing pages hosted on its own platform, so the sample skews toward marketers running dedicated campaign pages rather than full websites — a distinction worth keeping in mind before applying these figures to a homepage or a product listing page. Within that sample, Unbounce has published a deep dive into several individual industries, each measured against the same 6.6% all-industry median.
| Industry | Median landing page conversion rate | vs. all-industry median (6.6%) | Source page |
|---|---|---|---|
| SaaS | 3.8% | -42% | unbounce.com — SaaS conversion rate |
| Ecommerce | 4.2% | -36% | unbounce.com — Ecommerce conversion rate |
| Travel & Hospitality | 4.8% | -27% | unbounce.com — Travel & hospitality conversion rate |
| Commercial & Professional Services | 6.1% | -8% | unbounce.com — Professional services conversion rate |
| Legal | 6.3% | -5% | unbounce.com — Legal conversion rate |
| All industries (baseline) | 6.6% | Baseline | unbounce.com — Conversion Benchmark Report |
| Education | 8.4% | +27% | unbounce.com — Education conversion rate |
| Entertainment | 12.3% | +86% | unbounce.com — Entertainment conversion rate |
Why SaaS sits at the bottom of the range
Unbounce's SaaS-specific analysis frames the gap around commitment level: a SaaS landing page usually asks for a free trial signup, a demo booking, or a paid subscription — actions that carry more perceived risk or effort than an ecommerce purchase or a short contact form. Within SaaS itself, the report found hardware-category pages converting best at 4.1%, while data and infrastructure pages converted lower still, reinforcing that "SaaS" is not one uniform buying motion either.
This has a direct implication for page owners: a SaaS marketing team benchmarking against the 6.6% all-industry median, rather than the 3.8% SaaS median, will read a perfectly normal page as underperforming by nearly half. The correct comparison is always the closest available industry line, not the blended figure.
| What the page is asking for | Typical industry example | Median conversion rate | Commitment level |
|---|---|---|---|
| Enter a sweepstakes with an email address | Entertainment | 12.3% | Very low |
| Request a quote or consultation | Education | 8.4% | Low–medium |
| Submit a contact form | Commercial & professional services | 6.1% | Medium |
| Book a case review or consultation | Legal | 6.3% | Medium |
| Complete a purchase | Ecommerce | 4.2% | Medium–high (payment required) |
| Book a trip or reservation | Travel & hospitality | 4.8% | High (dated commitment) |
| Start a free trial or demo | SaaS | 3.8% | High (ongoing relationship implied) |
Traffic source outweighs most page redesigns
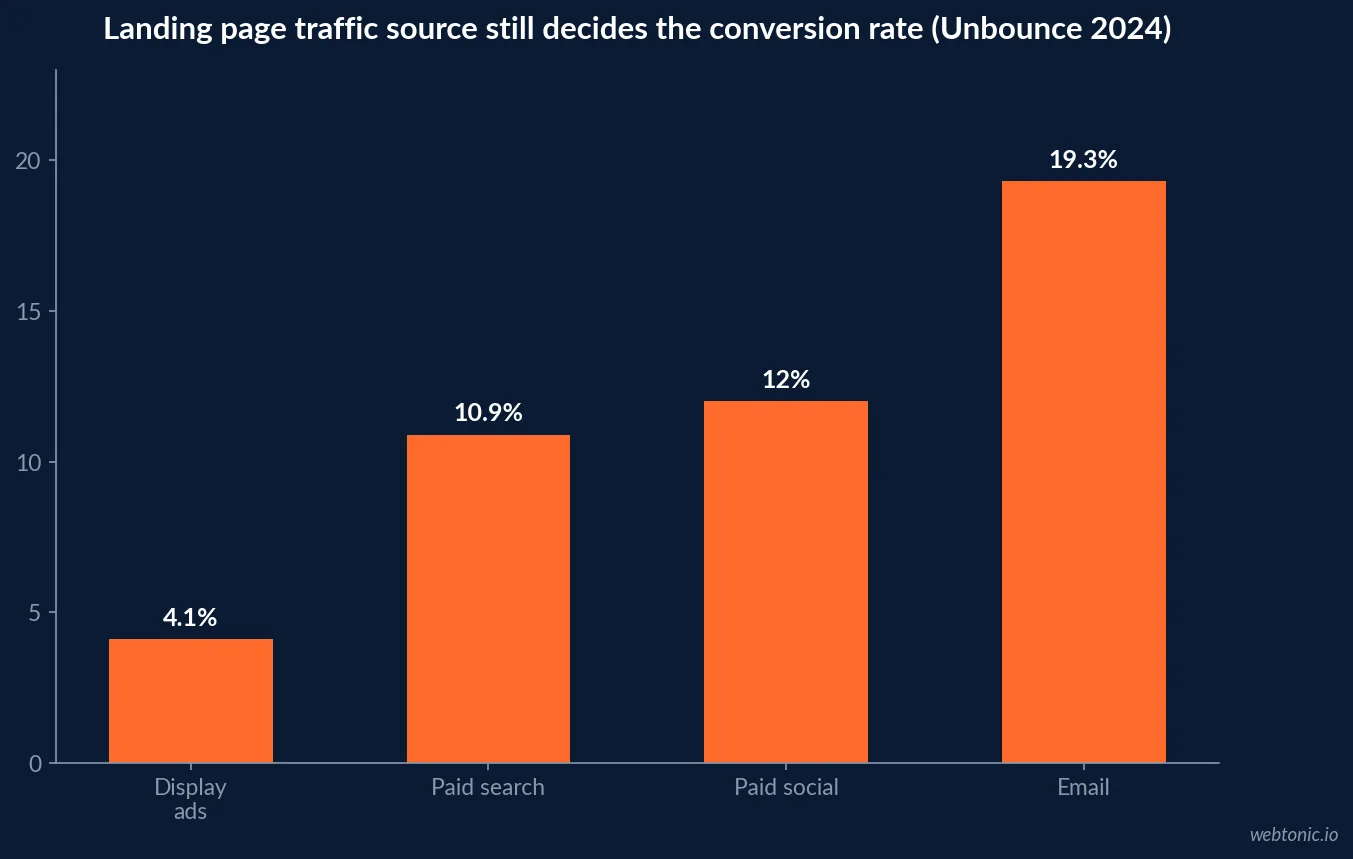
Unbounce's headline insight for 2024 was not industry — it was channel. Landing pages reached from email converted at a median of 19.3%, compared with 12.0% for paid social and 10.9% for paid search reaching a comparable page. The report states that email traffic converts 60% better than paid social, 77% better than paid search, and 370% better than display advertising, on the same conversion-tracking methodology.
This is not evidence that email is a "better" channel in isolation — Unbounce notes email is typically a middle-to-bottom-of-funnel tactic, so the audience is already warmer by the time they click. It is evidence that comparing conversion rate across channels without controlling for funnel stage will systematically make paid acquisition look worse than it is.
| Traffic source | Median conversion rate (Unbounce, Q4 2024) | Funnel position (typical) | Caution |
|---|---|---|---|
| 19.3% | Middle-to-bottom funnel | Audience is pre-qualified; not a clean comparison to cold paid traffic | |
| Paid social | 12.0% | Top-to-middle funnel | Outperforms paid search here but varies heavily by platform and objective |
| Paid search (all industries) | 10.9% | Middle funnel, high intent | Google paid search alone converts higher, at 11.3%, than the paid-search blend |
| Display advertising | Lowest of the four channels measured | Top funnel, low intent | Unbounce reports email converts 370% better than display, without stating an absolute display rate |
Reading a 404 in the benchmark: not every industry has a public deep dive
Unbounce has not published individual deep-dive pages for every industry in its sample — Financial Services & Insurance and Health & Wellness, for example, appear in the report's overview navigation but do not yet have a dedicated breakdown page at the time of this analysis. Where a specific vertical has no published figure, the honest move is to use the nearest analogous category and the 6.6% all-industry median as bounds, rather than inventing a precise number that was never published.
The report is also explicit that its figures are medians, not averages, specifically because medians resist distortion from a handful of outlier pages — a useful methodological note before comparing this dataset to another benchmark report that may report a mean instead.
| Benchmarking question | What Unbounce's report answers | What it does not answer |
|---|---|---|
| Is my page's conversion rate typical for my industry? | Yes, for SaaS, ecommerce, travel, legal, professional services, education, entertainment | No published figure yet for financial services or health & wellness specifically |
| Does traffic source matter more than page design? | Yes — a 8.4-point spread between email and paid search | Does not isolate design quality from audience warmth within a channel |
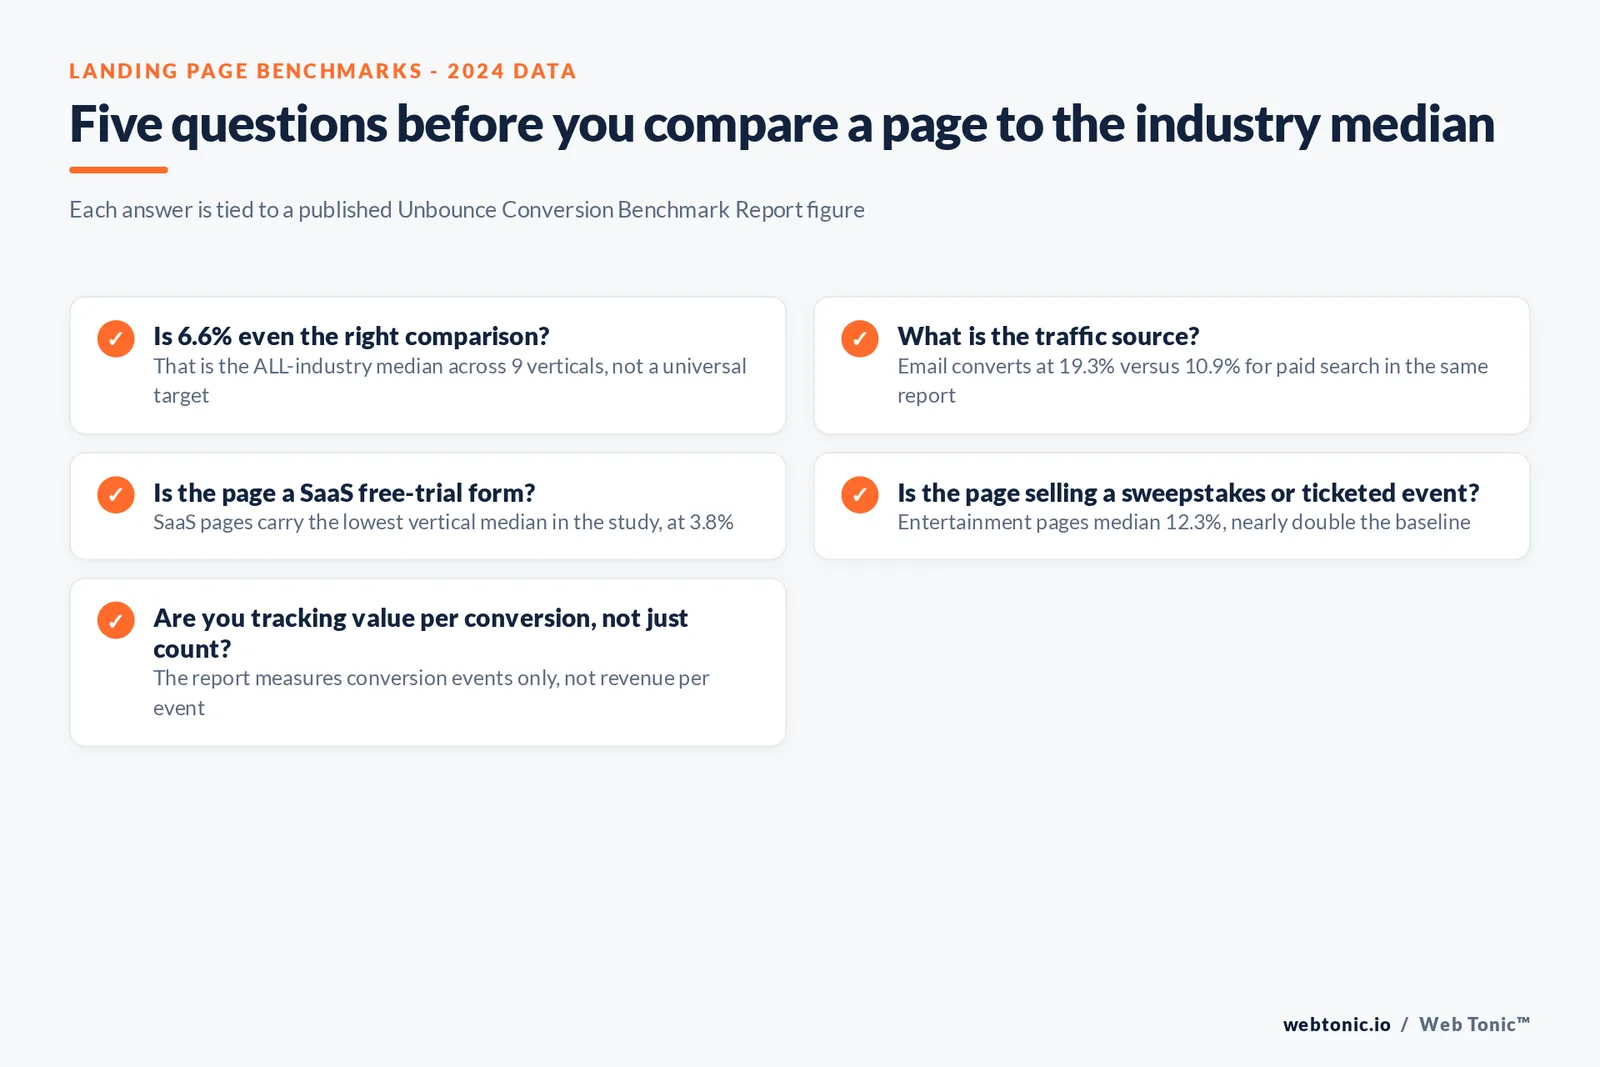
| Is 6.6% the right target for every page? | No — it is a median across 9 categories, not a floor or ceiling | Does not tell you the target for a category outside those 9 |
| Should I compare mean or median figures across reports? | Unbounce reports medians to reduce outlier distortion | A different report using means on the same data could show a different number |
What to do with the number once you have it
Start by matching your page to the closest published industry and, where possible, the closest traffic-source split. A SaaS free-trial page reached mostly by paid search should be benchmarked against the 3.8% SaaS median adjusted toward the lower end of the 10.9% paid-search conversion band — not against the 19.3% email figure or the 12.3% entertainment figure. From there, track your own trend over several weeks before concluding a benchmark gap reflects a real problem rather than normal week-to-week variance.
If your page sits meaningfully below its closest published category and traffic-source combination, the report's own emphasis areas — page readability, word count, and mobile experience — are documented starting points, each covered with its own data in Unbounce's full report. Our landing page statistics hub tracks these benchmarks as they update.
Page speed and Quality Score sit underneath every one of these numbers
Nielsen Norman Group's research history on page speed documents a consistent pattern across two decades: Akamai's 2017 study of 17 retailers and 7 billion pageviews found conversion rates highest on pages loading in under 2 seconds, with longer load times correlating to 50% drops in conversion rate. That effect sits underneath every industry median in this report — a technically slow SaaS or ecommerce page will underperform its category's benchmark regardless of copy or offer quality.
For any page reached through Google's paid search — the 10.9% average channel in Unbounce's data — Google's own Quality Score documentation names landing page experience as one of three core inputs alongside expected click-through rate and ad relevance. A page that scores poorly on Quality Score's landing page component often converts below its category median for the same underlying reasons: slow load times, weak content match, or poor mobile navigation. Web Tonic's performance creative team and data intelligence practice typically diagnose a below-benchmark page against this exact list before touching the media plan. For a rough cross-check on engagement, Databox's own GA4 benchmark data shows average session duration by industry ranging from 2m 22s (Construction) to 3m 1s (Travel & Leisure) — a separate dataset from Unbounce's, but a useful sanity check that a page attracting shorter-than-typical sessions for its category may be losing visitors before the conversion action ever appears.
Benchmark summary
The single most quoted figure — 6.6% — is a median across nine industries with real, sizable spread on either side of it. Treat it as a sanity check rather than a target, match your page to the nearest industry and traffic-source combination, and revisit the benchmark whenever Unbounce or a comparable primary source refreshes its dataset, since these figures move year to year with the broader advertising and search landscape.
Frequently Asked Questions
What is the average landing page conversion rate by industry?
Unbounce's Conversion Benchmark Report, drawn from more than 57 million conversions across 41,000+ landing pages, found a median conversion rate of 6.6% across all industries as of its Q4 2024 data. Individual industries vary widely around that median: SaaS pages median 3.8%, entertainment pages median 12.3%, travel & hospitality pages median 4.8%, and legal pages median 6.3%. The 6.6% figure is a useful sanity check, not a target for every page.
Why do SaaS landing pages convert so much lower than the median?
Unbounce's SaaS-specific report attributes the gap to the nature of the offer: a SaaS landing page usually asks a visitor to start a free trial or book a demo, a higher-commitment action than an ecommerce purchase or a simple contact form. The report found the SaaS median sitting at 3.8%, 42% below the 6.6% all-industry baseline, with hardware-category SaaS pages converting best within that vertical at 4.1%.
Does traffic source change the conversion rate more than industry does?
In Unbounce's data, yes, and by a wide margin. Visitors arriving from email converted at 19.3% on average — 60% better than paid social (12.0%), 77% better than paid search (10.9%), and 370% better than display advertising. A page redesign can move conversion rate a few points; shifting the traffic mix toward email can move it by multiples. Compare pages only within the same traffic source when possible.
Is a 12.3% conversion rate always a sign of a great landing page?
Not necessarily. Unbounce found the entertainment category's 12.3% median was heavily influenced by its sweepstakes sub-category, where the ask (an email address to enter a giveaway) is far lower-commitment than a purchase or a signed contract. High conversion rates in low-commitment categories are not directly comparable to conversion rates in categories asking for money or long-term commitment, like SaaS or legal.
How should a page owner use these benchmarks?
Identify the closest matching industry category and traffic source, not just the all-industry average. If no exact match exists — Unbounce currently publishes deep dives for a handful of categories — use the nearest analogous vertical and note the difference in the write-up. Track your own conversion rate over time as the primary signal, and use the published median only to flag whether a page is in a plausible range before digging into a full audit.
Sources
Unbounce — Conversion Benchmark Report
Unbounce — What Is the Average Landing Page Conversion Rate?
Unbounce — SaaS Conversion Rate Benchmark
Unbounce — Travel & Hospitality Conversion Rate Benchmark
Unbounce — Education Conversion Rate Benchmark
Unbounce — Legal Conversion Rate Benchmark
Unbounce — Professional Services Conversion Rate Benchmark
Unbounce — Entertainment Conversion Rate Benchmark
Unbounce — Ecommerce Conversion Rate Benchmark
Nielsen Norman Group — The Need for Speed, 23 Years Later
Google Ads Help — About Quality Score for Search Campaigns
WordStream — 2025 Google Ads Benchmarks by Industry
Databox — Content Marketing Benchmarks by Industry