Table of contents

Customer acquisition cost (CAC) - the fully-loaded cost of landing one paying customer, not one lead or one click - ranges from $86 in ecommerce to $791 in real estate across the 16 general B2B industries HubSpot's 2026-updated benchmarks track. Read alone, none of these numbers mean anything; paired with an LTV:CAC ratio and a payback period, they become an annual scorecard.
Key Takeaways
- Ecommerce has the lowest combined B2B CAC at $86.
- Real Estate has the highest combined B2B CAC at $791 among 16 general industries.
- B2B SaaS combined CAC averages $239, with organic running $205 and inorganic $341.
- Fintech SaaS has the highest sub-industry CAC at $1,450.
- Ecommerce SaaS tools have the lowest sub-industry CAC at $274.
- Median B2B SaaS LTV:CAC ratio is 4.1x industry-wide (Benchmarkit, CY-2025).
- Vertical SaaS LTV:CAC runs 5.6x, well above the 3:1 healthy-ratio floor.
- Median CAC payback period is 16 months, down from 18 months in CY-2024.
- Strong-quartile CAC payback is 10 months; the weak quartile runs 24 months.
- Top-performing companies recover CAC in 6 months or less.
- Aviation carries a combined CAC of $683, the second-highest general industry tracked.
- Aerospace & Defense CAC runs $624 combined, split $526 organic / $918 inorganic.
- Construction CAC is $281 combined, the second-cheapest general industry tracked.
- Blended CAC ratio across B2B SaaS is USD 1.30 (Benchmarkit, CY-2025).
- Median revenue per employee across B2B SaaS is USD 175,000 (Benchmarkit, CY-2025).
What this report measures, and what it does not
Customer acquisition cost, as this annual report defines it, is total sales and marketing spend divided by new customers won - the fully loaded number a board reviews once a year, not a per-click or per-lead figure a media buyer checks weekly. That distinction matters: a $650 legal-services CAC and a $9.87 attorney search-ads cost per click both describe the same industry but answer completely different questions about completely different stages of the funnel.
The data below is drawn from HubSpot's 2026-updated CAC and CPL benchmarks, which combine First Page Sage's 2026 client-engagement research with HubSpot's own reporting, and from Benchmarkit's CY-2025 B2B SaaS Performance Metrics Benchmarks, built from real B2B SaaS company financials.
Customer acquisition cost by industry: the 2026 annual table
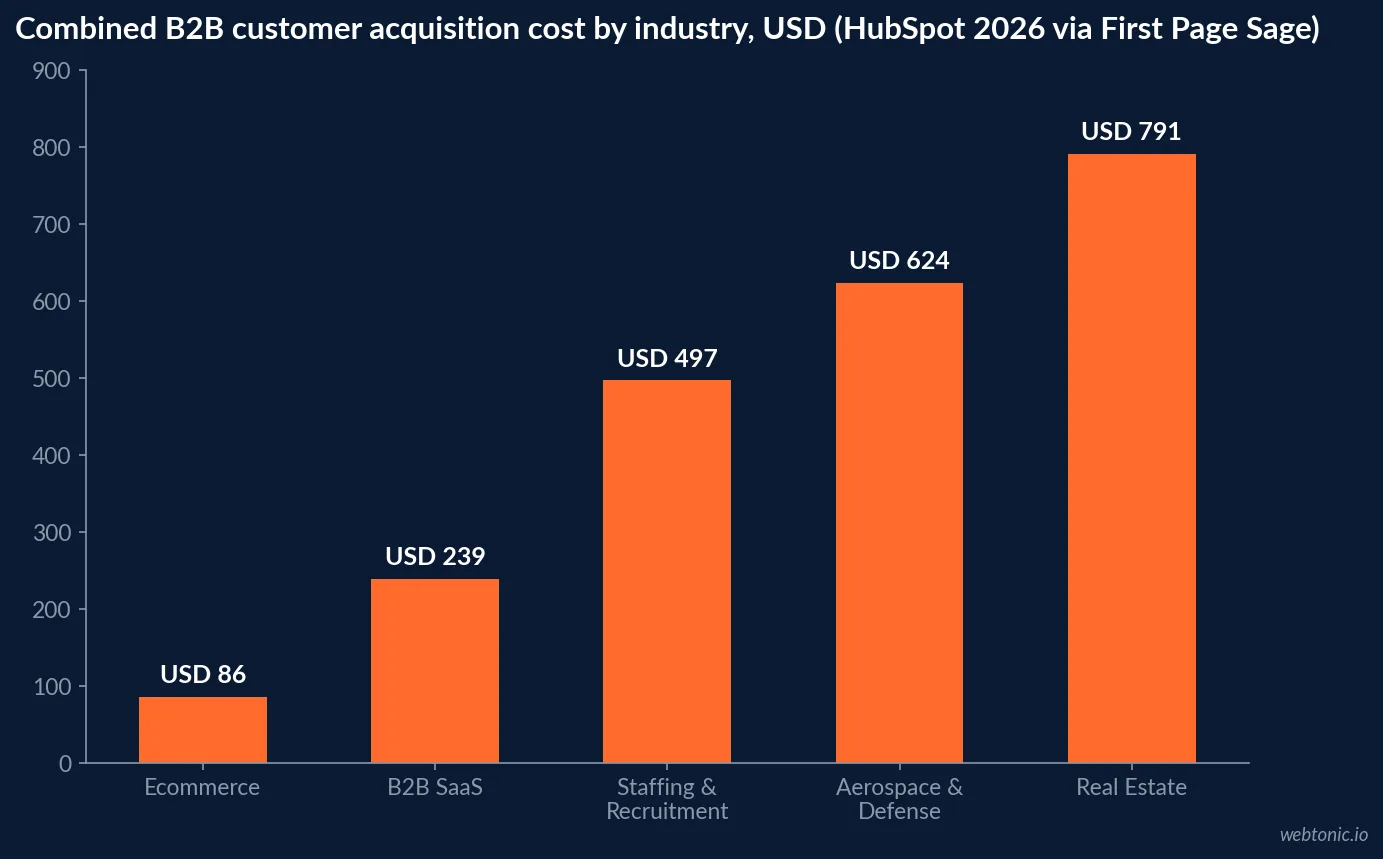
Here is the combined (organic plus inorganic) average CAC across the 16 general B2B industries HubSpot's 2026-updated benchmarks track, sourced from First Page Sage's client-engagement data.
| Industry | Organic CAC | Inorganic (paid) CAC | Combined average CAC |
|---|---|---|---|
| Ecommerce | $87 | $81 | $86 |
| Construction | $212 | $486 | $281 |
| B2B SaaS | $205 | $341 | $239 |
| Transportation & Logistics | $436 | $732 | $510 |
| Engineering | $459 | $672 | $512 |
| Staffing & Recruitment | $518 | $476 | $497 |
| Cybersecurity | $345 | $512 | $387 |
| Automotive | $491 | $893 | $592 |
| Software Development | $680 | $841 | $720 |
| Manufacturing | $662 | $905 | $723 |
| Legal Services | $584 | $1,245 | $749 |
| Oil & Gas | $710 | $1,003 | $783 |
| Financial Services | $644 | $1,202 | $784 |
| Aerospace & Defense | $526 | $918 | $624 |
| Aviation | $588 | $967 | $683 |
| Real Estate | $660 | $1,185 | $791 |
Two patterns stand out. First, organic acquisition is cheaper than inorganic (paid) in every single industry on this list - the gap simply varies from marginal (Staffing & Recruitment, where paid is actually cheaper) to enormous (Legal Services, where paid runs more than double organic). Second, capital-intensive B2B categories with long sales cycles - Aerospace & Defense, Aviation, Oil & Gas, Real Estate - cluster at the top regardless of channel, because closing one customer there means closing one contract worth funding an entire acquisition budget.
Inside SaaS: CAC by sub-industry
B2B SaaS as a single category averages $239 combined CAC, but that number hides a nearly 5.3x spread once SaaS is broken into its own sub-industries. HubSpot's 2026-updated benchmarks, again drawing on First Page Sage's research, list 16 SaaS verticals separately.
| SaaS industry | Combined average CAC | Source |
|---|---|---|
| Ecommerce (SaaS tools) | $274 | HubSpot / First Page Sage |
| Legaltech | $299 | HubSpot / First Page Sage |
| Industrial | $542 | HubSpot / First Page Sage |
| Engineering | $551 | HubSpot / First Page Sage |
| Cleantech | $674 | HubSpot / First Page Sage |
| Construction | $610 | HubSpot / First Page Sage |
| Agtech | $712 | HubSpot / First Page Sage |
| Transportation & Logistics | $483 | HubSpot / First Page Sage |
| Staffing & HR | $694 | HubSpot / First Page Sage |
| Security | $805 | HubSpot / First Page Sage |
| Education | $806 | HubSpot / First Page Sage |
| Chemical & Pharmaceutical | $816 | HubSpot / First Page Sage |
| Design | $658 | HubSpot / First Page Sage |
| Project Management | $891 | HubSpot / First Page Sage |
| Medtech | $921 | HubSpot / First Page Sage |
| Fintech | $1,450 | HubSpot / First Page Sage |
The number that actually judges a CAC: LTV:CAC ratio
A CAC figure alone cannot be judged healthy or unhealthy - it has to be measured against how much that customer is worth over their lifetime. Benchmarkit's CY-2025 B2B SaaS benchmarks put the median LTV:CAC ratio at 4.1x industry-wide, and 5.6x for vertical SaaS specifically - both above the widely cited 3:1 healthy-ratio floor.
| LTV:CAC benchmark (CY-2025) | Ratio | Reading | Source |
|---|---|---|---|
| Widely cited healthy floor | 3.0x | Minimum sustainable ratio | Industry convention |
| Median B2B SaaS (industry-wide) | 4.1x | Comfortably above the floor | Benchmarkit |
| Vertical SaaS median | 5.6x | Best-performing segment tracked | Benchmarkit |
| Blended CAC ratio | USD 1.30 | Revenue generated per CAC dollar spent | Benchmarkit |
CAC payback period: the annual clock that matters
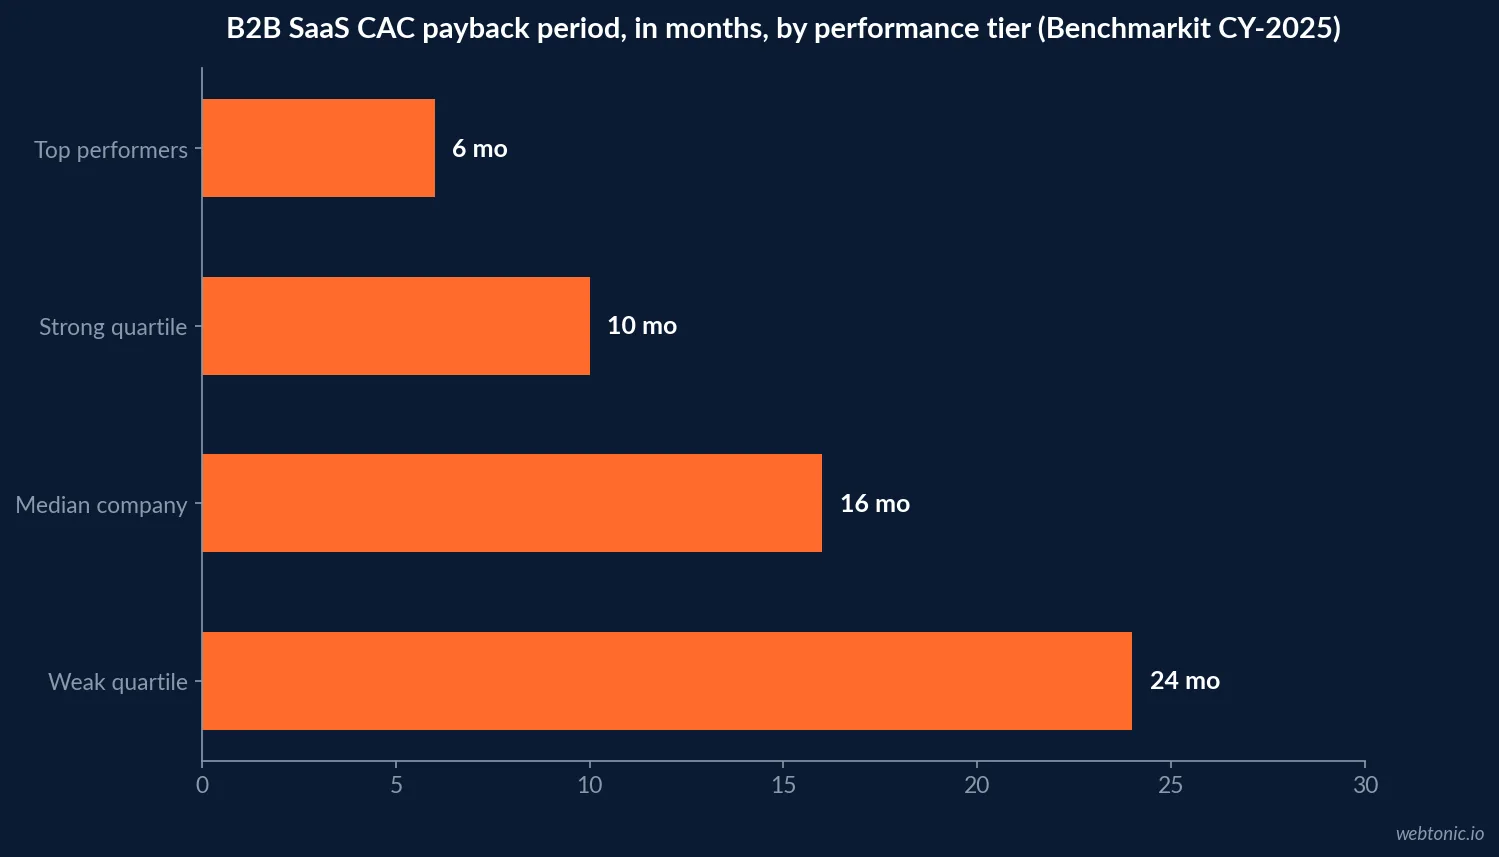
Payback period measures how many months of gross margin it takes to recover the cost of acquiring a customer - the number a board actually watches quarter over quarter. Benchmarkit's CY-2025 data puts the median payback period at 16 months, an improvement from 18 months in CY-2024 and 14 months in CY-2023, with strong performers recovering CAC far faster than the median.
| Performance tier | CAC payback period | Source |
|---|---|---|
| Top performers | 6 months or less | Benchmarkit CY-2025 |
| Strong quartile | 10 months | Benchmarkit CY-2025 |
| Median company | 16 months | Benchmarkit CY-2025 |
| Weak quartile | 24 months | Benchmarkit CY-2025 |
| Median, one year earlier (CY-2024) | 18 months | Benchmarkit CY-2024 (via CY-2025 report) |
The direction matters as much as the level: payback period compressing from 18 to 16 months year over year signals that median B2B SaaS companies are getting more efficient at converting acquisition spend into recovered margin, even as top-line growth rates have cooled industry-wide over the same period.
Why this report tracks payback, not just cost
A single CAC figure, published once a year, invites the wrong question - "is $239 too much?" - when the useful question is "how fast does $239 come back, and how many times does it repeat?" That is why this annual report pairs every CAC table with a payback and ratio table rather than stopping at cost. A company acquiring customers for $1,450 in Fintech SaaS but recovering that cost in 9 months, on contracts that renew for years, is in a far stronger position than a company acquiring customers for $86 in Ecommerce with a payback period stretching past 20 months on low-repeat purchases.
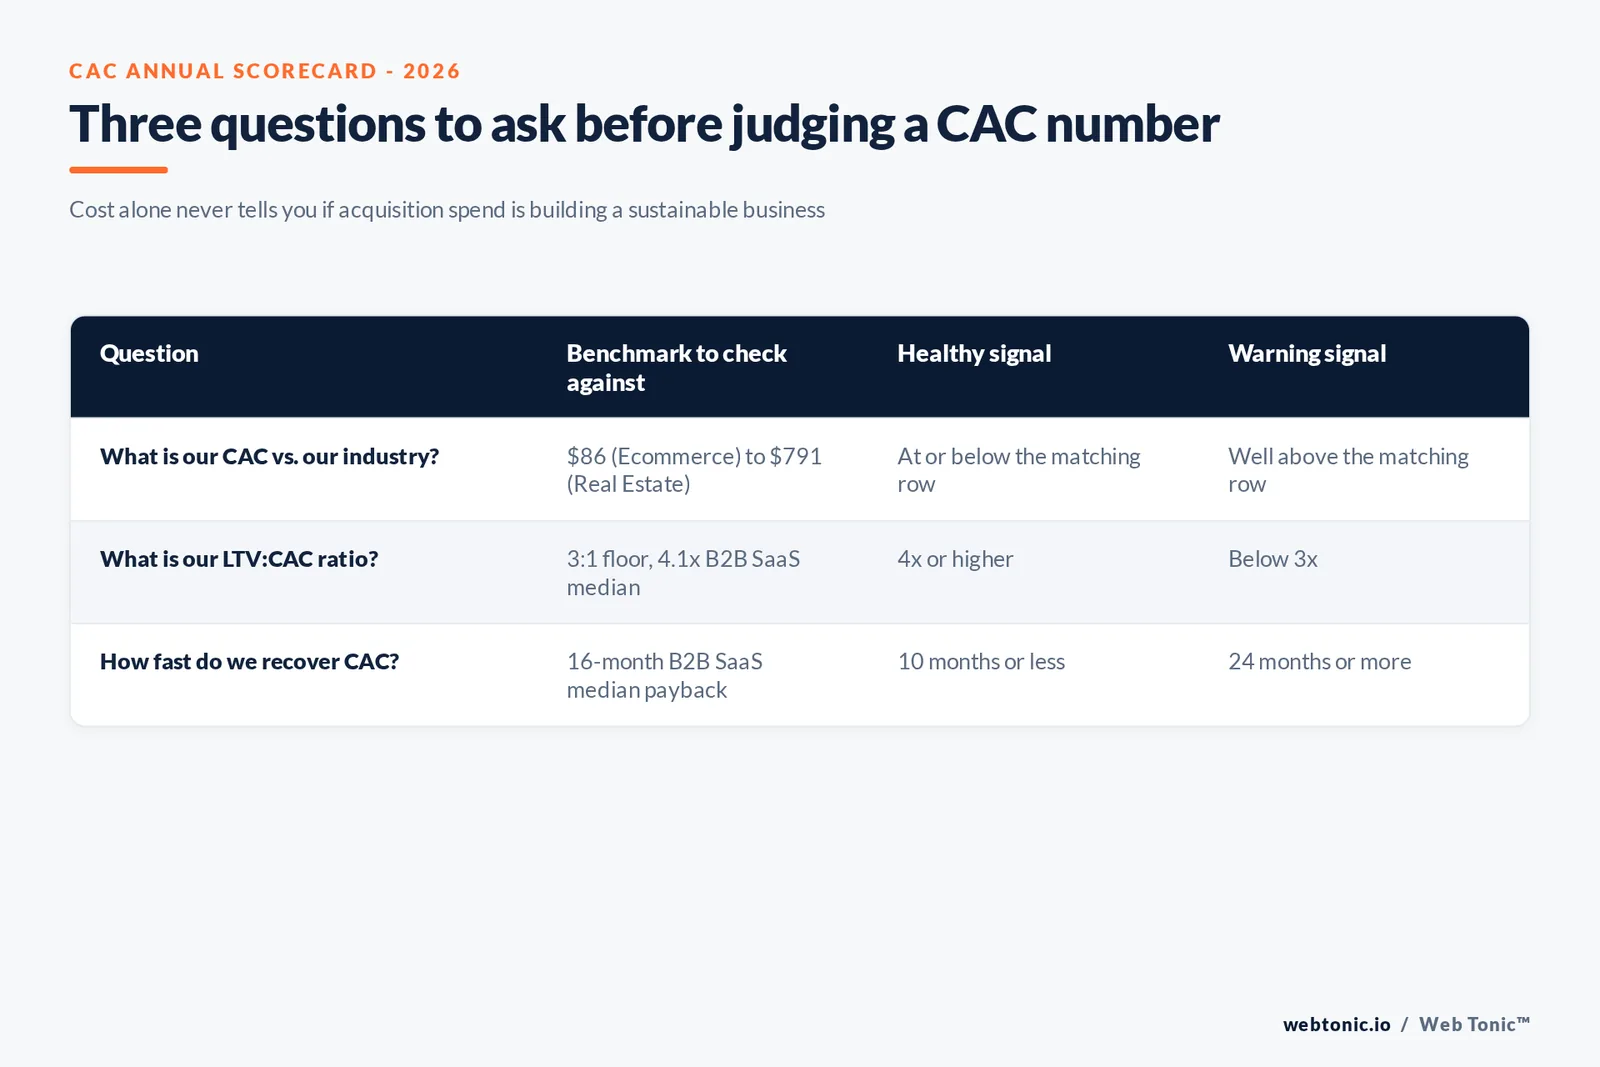
Boards reviewing this kind of report annually should ask three questions in order: what is our CAC against the closest matching industry row, what is our LTV:CAC ratio against the 3:1 floor, and how many months does it take to recover the acquisition cost against the 16-month median. Answering only the first question, which is what most internal dashboards default to, misses the two numbers that actually determine whether the acquisition spend is building a sustainable business.
Why sales-cycle length explains most of the spread
Line up the cheapest and most expensive rows in the general-industry table and one variable explains most of the gap: how long it takes to close a deal. Ecommerce closes in minutes and carries the lowest CAC on the list at $86. Real Estate, Aviation, and Aerospace & Defense close over months or years of relationship-building, procurement cycles and multi-stakeholder sign-off, and they carry the highest CAC on the list - $791, $683 and $624 respectively. A longer sales cycle means more sales headcount hours, more marketing touches, and more nurture content per closed deal, and every one of those costs rolls into CAC.
This is also why comparing CAC across industries without adjusting for deal size is misleading in the other direction: a $791 real estate CAC funds itself easily against a five- or six-figure commission, while an ecommerce brand at that same CAC on a $60 average order value would be insolvent within a quarter. The dollar figure only means something once it is set against what the business earns per closed customer.
How to use this report against your own number
Start with the industry row closest to your business model, not the all-industry blend - a $86 ecommerce CAC and a $791 real estate CAC are both defensible in their own category and meaningless compared against each other. Then check the ratio, not just the cost: a $1,450 fintech SaaS CAC funded by a customer worth $10,000 over their lifetime is a healthier business than a $239 average B2B SaaS CAC funded by a customer worth $500. Our data and analytics practice builds that LTV comparison before setting a CAC target for any account we run.
For the channel-level and lead-level costs that roll up into these annual CAC figures, see our breakdown of what Facebook Ads cost, or talk to our team about benchmarking your acquisition cost and payback period against the closest matching industry above.
How CAC is actually calculated, and where it breaks
The formula behind every number on this page is simple: total sales and marketing spend divided by new customers won in the same period. Klipfolio's CAC formula guide and Shopify's own CAC breakdown both add the same caveat: the formula is only as honest as what gets included in "marketing spend." Leave out sales headcount, tooling, or agency fees, and CAC looks artificially cheap - which is the most common reason a company's internal CAC number disagrees with every published benchmark on this page.
The fix is not a different formula; it is fully loading the number the same way the benchmark studies did - all people, tools and media spend tied to acquisition, divided by new customers in the same window - before comparing it against an industry row above.
Frequently Asked Questions
What is the average customer acquisition cost in 2026?
It depends entirely on industry. HubSpot's 2026-updated benchmarks, combining First Page Sage's research, show combined average B2B CAC ranging from $86 for Ecommerce to $791 for Real Estate across 16 industries, with B2B SaaS averaging $239. There is no single defensible 'average' figure across all industries because sales-cycle length and deal size vary too widely to blend meaningfully.
Which industry has the lowest customer acquisition cost?
Ecommerce has the lowest combined average CAC at $86, split between $87 organic and $81 inorganic (paid), per HubSpot's 2026-updated benchmarks. Short purchase cycles and high inbound traffic volume keep ecommerce CAC well below every other B2B-adjacent category tracked.
Which industry has the highest customer acquisition cost?
Real Estate has the highest combined average CAC among the 16 general B2B industries tracked, at $791. Among SaaS sub-industries specifically, Fintech is highest at $1,450, more than five times the $274 CAC reported for Ecommerce SaaS tools in the same dataset.
What is a healthy LTV to CAC ratio?
A ratio of 3:1 or higher is the widely cited healthy benchmark - a customer needs to be worth at least three times what it cost to acquire them. Benchmarkit's CY-2025 B2B SaaS data puts the median LTV:CAC ratio at 4.1x across the industry, and 5.6x for vertical SaaS specifically, both comfortably above the 3:1 floor.
What is CAC payback period and what is a good number?
CAC payback period is how many months of gross margin from a customer it takes to recover what it cost to acquire them. Benchmarkit's CY-2025 data puts the median B2B SaaS payback period at 16 months, with the strong quartile at 10 months and the weak quartile stretching to 24 months. Top performers recover CAC in 6 months or less.
Sources
HubSpot - 2026 CPL and CAC Benchmarks
Benchmarkit - CY-2025 B2B SaaS Performance Metrics Benchmarks
Klipfolio - Customer Acquisition Cost formula and benchmarks
Shopify - Customer Acquisition Cost: Calculate and Reduce It
Web Tonic - How Much Do Facebook Ads Cost
Web Tonic - Customer Lifetime Value Statistics