



Table of contents

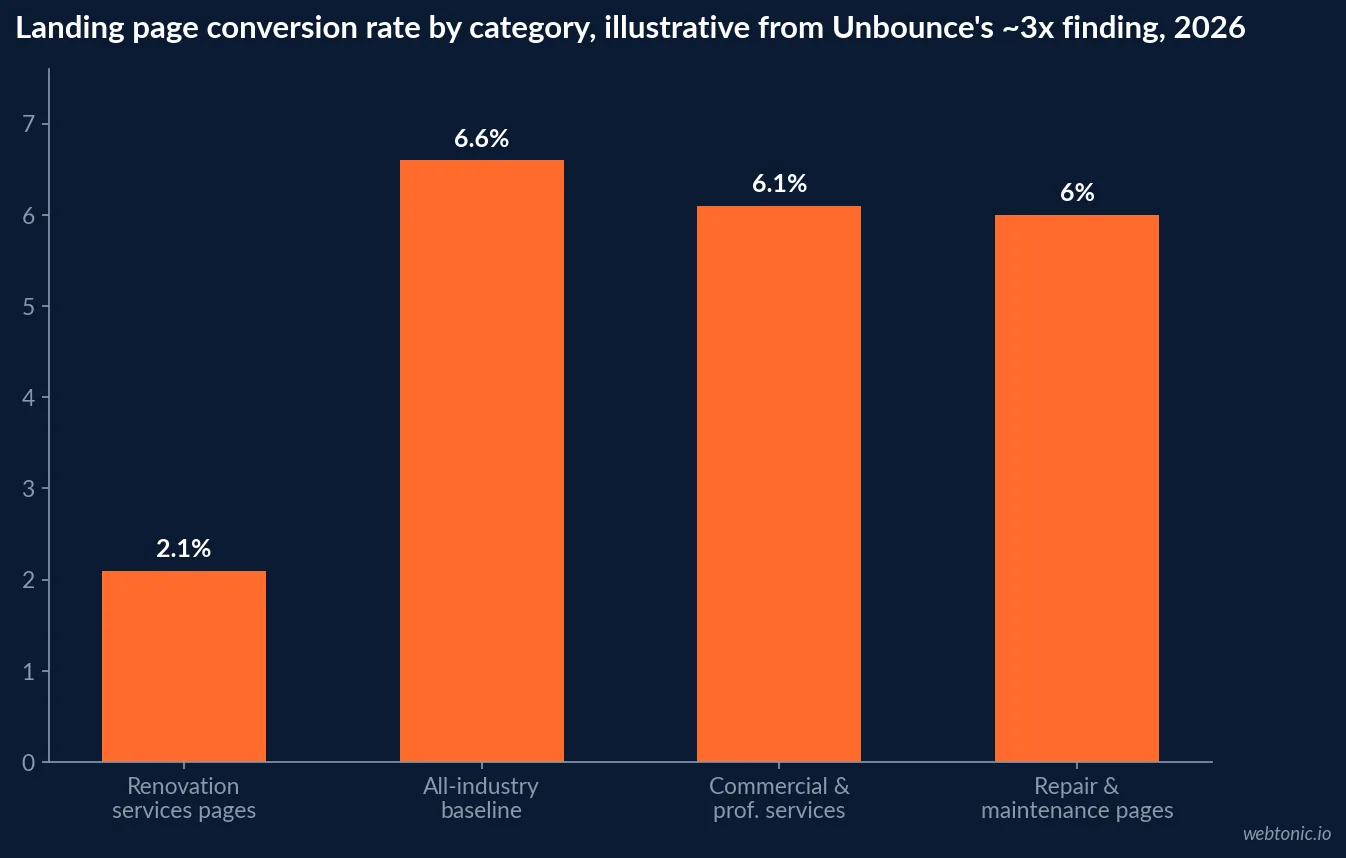
Unbounce's 2026 benchmark data found repair and maintenance landing pages converting almost 3x better than home and renovation pages in the same broader category. That single finding sets the measurement agenda for auto repair CRO: urgency is already working in the shop's favor, and the job is to stop losing it to a slow, complex, desktop-only page.
Key Takeaways
- Repair and maintenance pages convert almost 3x better than renovation pages (Unbounce 2026).
- The parent category median conversion rate is 6.1%, just under the 6.6% all-industry baseline.
- 81% of landing page visits in this category are on mobile.
- But mobile converts 40% worse than desktop here, against an 8% gap industry-wide.
- Desktop converts at 11.6%; mobile converts at 8.3%.
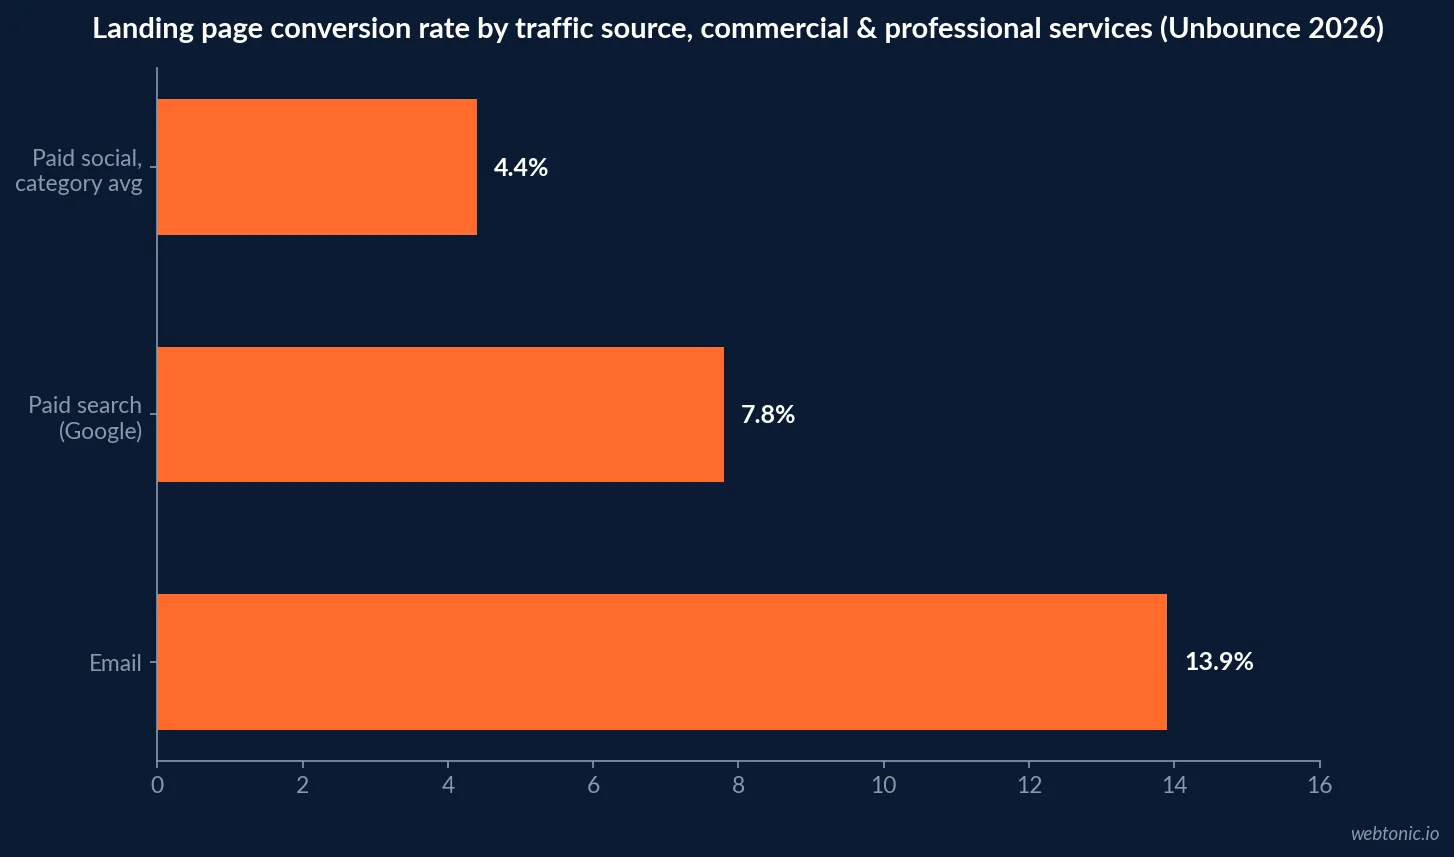
- Email converts at 13.9%, the top channel measured.
- Paid search converts at 7.8%, versus 4.4% for paid social.
- Google search ads convert 87% better than Bing and 160% better than Yahoo.
- Instagram converts at 11.7% among paid social channels, nearly 2x Facebook.
- Reading level below 7th grade converts at 12.9%, against 6.6% at 8th-9th grade.
- That is a 49% conversion drop from harder copy alone.
- The ideal word count band is 275-745 words.
- 45% of consumers trust a repair recommendation more with photo or video proof (Cox Automotive).
- General repair now averages USD 275 per visit, ahead of dealership service at USD 261.
The urgency advantage the data already confirms
Unbounce's 2026 Conversion Benchmark Report, drawn from over 57 million conversions and 41,000 landing pages, places commercial and professional services at a 6.1% median conversion rate, just under the 6.6% all-industry baseline. Inside that category, Unbounce explicitly calls out that repair and maintenance services pages convert almost 3x better than home and renovation services pages, framing it as a need-versus-want distinction: a stalled car forces a decision a kitchen remodel does not.
That means an auto repair page starts with a real conversion advantage baked into the intent behind the click. The measurement job is not to manufacture urgency copy - it already exists - but to stop losing it to page friction.
| Landing page benchmark (2026) | Figure | Source |
|---|---|---|
| Commercial & professional services, median CVR | 6.1% | Unbounce |
| All-industry baseline, median CVR | 6.6% | Unbounce |
| Repair & maintenance vs. renovation pages | ~3x higher conversion | Unbounce |
| Share of visits on mobile, this category | 81% | Unbounce |
| Desktop conversion rate | 11.6% | Unbounce |
| Mobile conversion rate | 8.3%, a 40% gap | Unbounce |
The device gap is the single biggest lever
Unbounce's all-industry data shows desktop converting only 8% better than mobile. Narrowed to commercial and professional services, that gap widens to 40% - desktop at 11.6%, mobile at 8.3% - even though 81% of the category's landing page visits happen on a phone. A repair shop sending paid traffic to a page that was designed and tested on a laptop is measuring the wrong device by a four-to-one visit ratio.
For a category where the search itself is often made from a breakdown or a dashboard warning light, that gap is not a UX nicety. It is the difference between a driver on the shoulder finishing the booking flow and one who gives up and calls the next result instead. A Google-commissioned 2019 study run with Deloitte, "Milliseconds Make Millions", found that a mere 0.1-second improvement in mobile load speed lifted retail conversion progression by roughly 9%, and Google's own Mobile Site Speed Playbook found the average mobile page across 900,000 sites tested still takes 22 seconds to fully load - most of a driver's patience gone before the booking form even renders.
| Traffic source (2026, this category) | Conversion rate | Source |
|---|---|---|
| 13.9% | Unbounce | |
| Paid search (Google) | 7.8% | Unbounce |
| Paid social (Instagram) | 11.7% | Unbounce |
| Paid social (Facebook) | ~6% | Unbounce |
| Paid social, category average | 4.4% | Unbounce |
| Paid social, YouTube | 1.2% | Unbounce |
What separates a page that converts from one that doesn't
Unbounce isolated two page-level variables with a measurable effect. Reading level: pages at a 5th-to-7th-grade level converted at 12.9% against 6.6% for 8th-to-9th-grade copy, a 49% decline from complexity alone. Word count: the highest-converting band ran 275 to 745 words, centered near 500, with no more than roughly 15% of the words counted as three-syllable-plus "difficult" words.
Neither variable requires new traffic or new spend to test. They are rewrite work, and the data says the rewrite is worth more than most creative tweaks a shop would try first.
What Cox Automotive adds about trust on the page itself
Cox Automotive's 2026 Fixed Ops and Ownership Study found that consumers who receive photo or video proof of a recommended repair report 45% higher trust and are more likely to approve the work, and that transparency and time certainty are what convert an estimate into an approval. General repair shops now average USD 275 per visit against USD 261 at a dealership, so the page's job is increasingly to justify that ticket, not just book the appointment.
For a landing page, that translates into a specific, testable element: a photo or short video slot inside the estimate or booking flow, not just a stock image of a wrench.
What the whole-market number confirms about the segment
Unbounce's broader "what's a good conversion rate" analysis, built on the same 41,000-page, 57-million-conversion dataset, sets the top-10% "elite" tier at conversion rates above roughly 11% across all industries, with the median sitting near 6.6%. A repair-and-maintenance page already starting from a ~3x urgency advantage over its renovation-page sibling is a page that should realistically be aiming for that elite tier, not settling for the category median once mobile and copy issues are fixed.
| Conversion tier (all industries, 2026) | Approx. rate | Where an auto repair page should sit |
|---|---|---|
| Bottom quartile | Below ~3% | A page with an unresolved mobile or copy problem |
| Median, all industries | 6.6% | The floor once basic hygiene is fixed |
| Median, this category | 6.1% | Close to the all-industry floor |
| Top 10% ("elite") | ~11%+ | The realistic target given the urgency advantage |
A separate percentile-band read from Benchmarketing's 2026 conversion rate dataset, which sources every figure to a named study (WordStream, Meta Business Insights, HubSpot, Unbounce and its own platform data), puts the automotive industry's median conversion rate at 6.03%, with a top quartile of 9.8% - consistent with Unbounce's category figures above and a second, independent confirmation that automotive sits close to, not far below, the strongest-converting verticals it tracks.
| CRO lever | Benchmark evidence | Priority |
|---|---|---|
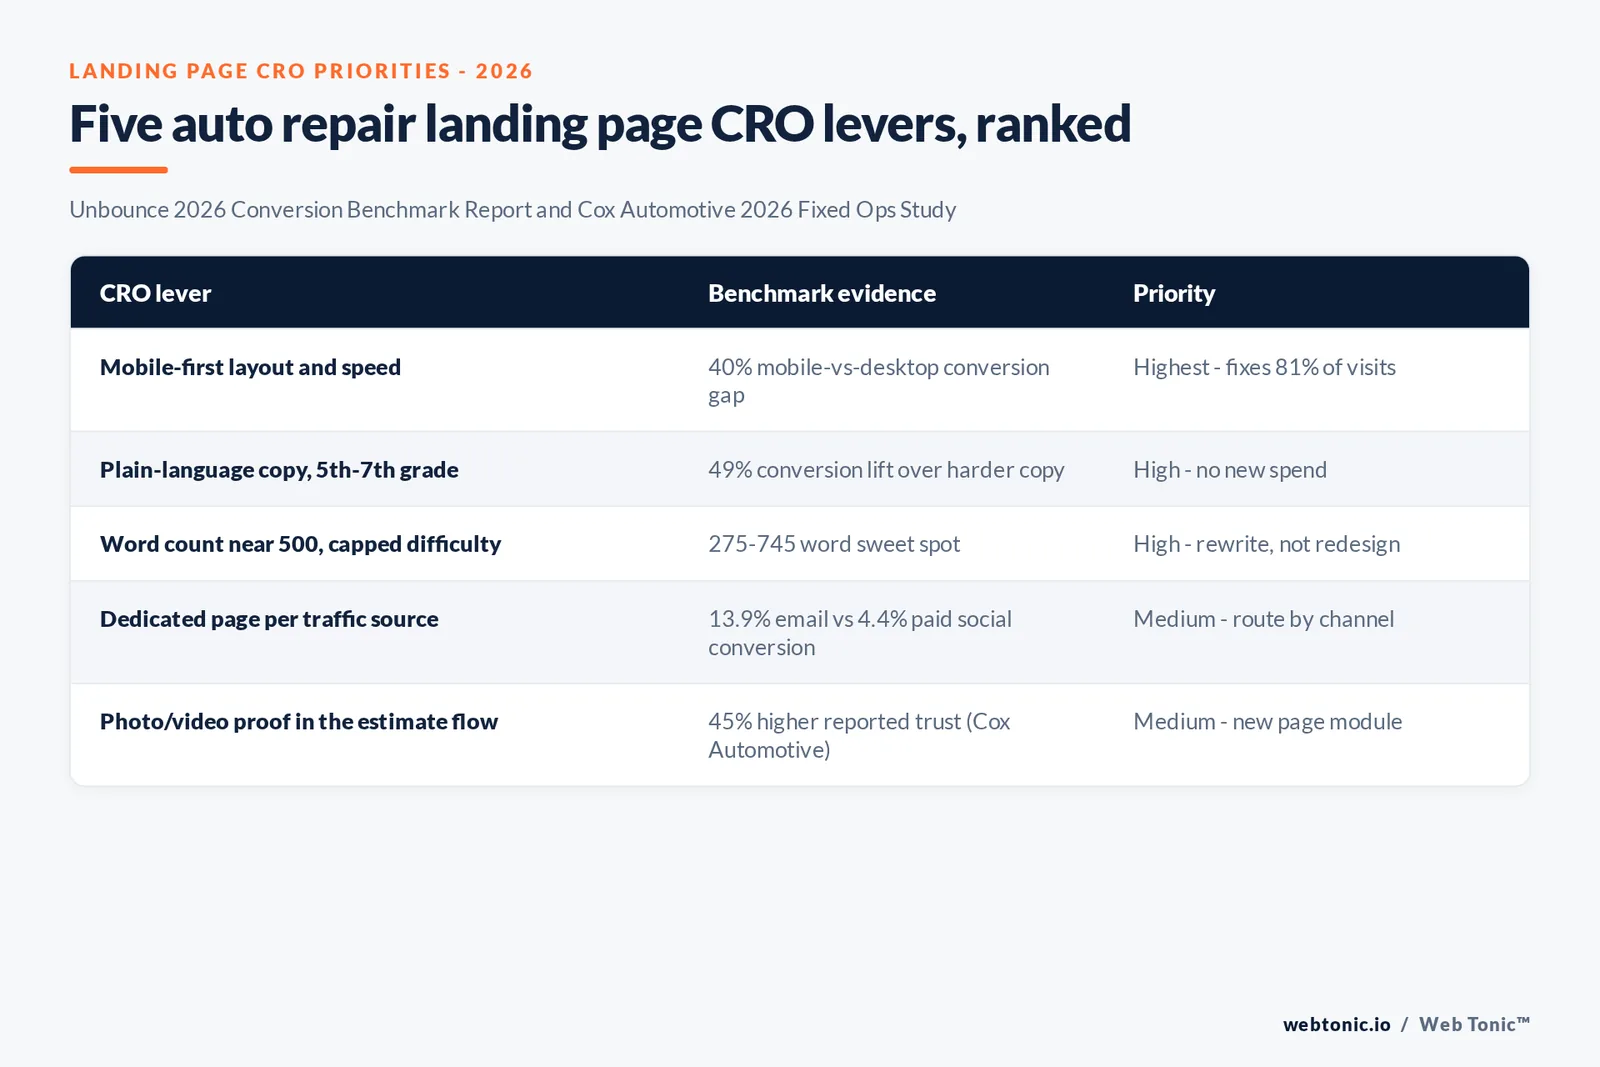
| Mobile-first layout and speed | 40% mobile-vs-desktop conversion gap (Unbounce) | Highest - fixes 81% of visits |
| Plain-language copy, 5th-7th grade | 49% conversion lift over harder copy (Unbounce) | High - no new spend |
| Word count near 500, capped difficulty | 275-745 word sweet spot (Unbounce) | High - rewrite, not redesign |
| Dedicated page for email + paid search traffic | 13.9% and 7.8% conversion vs. 4.4% paid social (Unbounce) | Medium - route by channel |
| Photo/video proof in the estimate flow | 45% higher trust reported (Cox Automotive) | Medium - new page module |
Why speed and copy compound each other
None of the four levers above work in isolation. A fast page with dense, 9th-grade copy still loses the driver who is reading it one-handed at a gas station; a plain-language page that takes 22 seconds to load - the average Google measured across 900,000 mobile sites - never gets read at all. The practical order of operations is speed first, since it is a pass/fail gate on whether the page is seen, then reading level and word count, since those are the variables Unbounce isolated with a measurable conversion effect once the page actually loads.
Treat the desktop-vs-mobile split, the traffic-source split and the reading-level test as three separate rows on the same dashboard, reviewed together rather than as three different owners' projects. A shop that fixes speed but never revisits copy, or rewrites copy but never checks the mobile split, will only ever collect half of the available lift this data describes.
What marketers should put on the CRO dashboard
Split every conversion report by device before looking at anything else - a category-average 40% gap will otherwise hide inside a blended number. Track conversion rate by traffic source separately, since email, paid search and paid social do not perform alike in this category. And treat reading level and word count as page-level variables worth A/B testing, not just as copywriting preference. Our performance creative team builds that testing cadence directly into a landing page brief, our data and analytics practice instruments the device and source splits this page depends on, and our conversion rate statistics piece is the right companion read for the cross-industry baseline this page builds from.
Frequently Asked Questions
What conversion rate should an auto repair landing page hit?
Unbounce's data on the parent category is the closest published benchmark: commercial and professional services landing pages convert at a median of 6.1%, slightly below the 6.6% all-industry baseline. Inside that category, Unbounce found repair and maintenance pages converting almost 3x better than home and renovation services pages, which Unbounce attributes to urgency - a broken car is a need, a remodel is a want. Use 6.1% as a floor and expect an urgent-repair page to clear it comfortably if it is built well.
Should the page be built mobile-first?
Yes, and the gap is worse than the all-industry pattern. Across all industries Unbounce found desktop converting only 8% better than mobile. Inside commercial and professional services specifically, that gap widens to 40% - desktop converts at 11.6%, mobile at 8.3% - despite 81% of visits happening on mobile. A repair shop losing 40% of its conversion rate on the device carrying four out of five visitors is the single biggest fixable gap in this data.
Which traffic source should get the dedicated landing page first?
Email, by a wide margin, if the shop has a list to send to - Unbounce found email converting at 13.9% for this category, roughly double paid search. But for cold acquisition, paid search at 7.8% clearly outperforms paid social at 4.4% for commercial and professional services, and Google search ads convert 87% better than Bing and 160% better than Yahoo inside that channel. Build the dedicated page for whichever of those already carries the most volume, not for the channel that feels newest.
Does page copy complexity actually change the conversion rate?
Measurably. Unbounce found conversion rate dropping 49% when copy moved from a 5th-to-7th-grade reading level (12.9% conversion) to an 8th-to-9th-grade level (6.6%). The report's sweet spot for word count is 275 to 745 words, roughly 500 words with no more than 15% of them counted as three-syllable-plus 'difficult' words. A repair page written like a service manual is measurably costing conversions against one written at a plain, urgent, 6th-grade level.
What should be tracked after the page goes live, not just before?
Desktop-versus-mobile conversion rate split, since the category gap (40%) is wider than the all-industry average and the fastest lever to pull. Traffic-source conversion rate, since paid search and paid social convert at meaningfully different rates in this category (7.8% versus 4.4%). And approval/booking completion once Cox Automotive's data is factored in: 45% of consumers say photo or video proof of a recommended repair increases their trust, which is a testable page element, not just a copy note.
Sources
Unbounce - Commercial & Professional Services Conversion Benchmarks 2026
Unbounce - 2026 Conversion Benchmark Report overview
Unbounce - What's a good conversion rate, 41,000-page analysis
Benchmarketing - 2026 Conversion Rate Benchmarks
web.dev (Google) - Milliseconds Make Millions mobile speed case study
Think with Google - Mobile Site Speed Playbook
Cox Automotive - 2026 Fixed Ops and Ownership Study
Cox Automotive - Dealerships lose service share to general repair, 2026


