



Table of contents
The B2B customer journey Dreamdata measured in 2026 runs 88 touchpoints across 4 channels and 10 stakeholders over 272 days, and 81% of it never touches a tracked pipeline. That is the environment attribution marketing has to model in 2026, and it is why the industry is quietly replacing one attribution model with a portfolio of them.
Key Takeaways
- 88 average touchpoints per B2B deal in 2026, up from 76 a year earlier.
- 81% of the buyer journey happens outside the pipeline, up from 70%.
- 10 stakeholders now touch a typical deal, up from 6.8.
- 272-day average buying journey length (Dreamdata 2026).
- 4 channels per journey on average, up from 3.7.
- 80% of revenue traces to roughly 20% of journeys, data and tools (CaliberMind).
- Marketers we can name were unable to answer 3 core revenue questions on the spot in 9 of 10 interviews.
- 85% of marketers feel confident measuring ROI (Nielsen).
- Only 32% of those marketers measure ROI holistically across channels.
- 38% of marketers now prioritize sales or ROI as their top success metric.
- 60% incorporate both reach/frequency and ROI into cross-media measurement.
- 27% still measure sponsorship spend in isolation from the rest of the media mix.
- Only 28% of marketers call their organization very effective at acting on MMM output.
- B2C confidence in marketing measurement is projected to fall roughly 7 points from 79% (Forrester).
- 65% to 70% of the self-directed purchase journey often completes before a rep is contacted.
- A cross-screen BARC | Nielsen One Ads study found under 10% duplication between TV and digital audiences.
- Meta reported $42.3 billion in Q1 2026 ad revenue, up 19% year over year, crediting AI-assisted products.
The journey got longer, wider and less visible at the same time
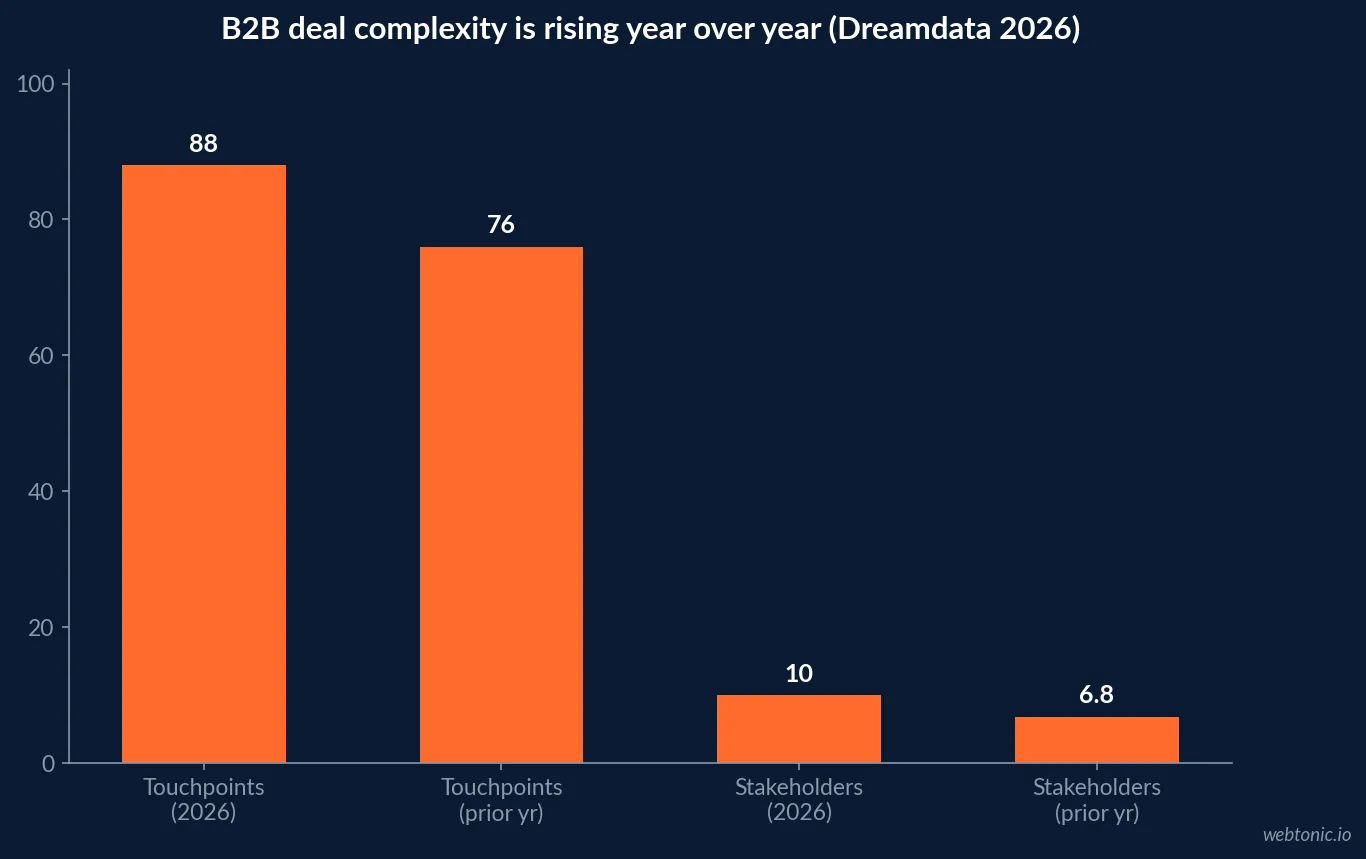
Dreamdata's 2026 LinkedIn Ads Benchmarks Report, aggregated across more than 66 million B2B sessions and 3.5 million customer journeys, is the most direct primary measurement of what a modern deal actually looks like. Buyers now touch a brand across 88 touchpoints on average, up from 76 the year before, spread over 4 channels (up from 3.7) and involving 10 stakeholders (up from 6.8). The full cycle now runs 272 days.
Every one of those figures moved in the same direction: more people, more channels, more time, and -- the number that should worry anyone building a dashboard -- 81% of that journey now happens outside the sales pipeline a CRM can see, up from 70% a year earlier.
| Journey metric (2026) | This year | Prior year | Source |
|---|---|---|---|
| Average touchpoints per deal | 88 | 76 | Dreamdata 2026 |
| Channels touched per deal | 4 | 3.7 | Dreamdata 2026 |
| Stakeholders involved per deal | 10 | 6.8 | Dreamdata 2026 |
| Journey length, average | 272 days | Not disclosed | Dreamdata 2026 |
| Journey happening outside the pipeline | 81% | 70% | Dreamdata 2026 |
What "dark funnel" means once you put a number on it
Dark funnel is not a metaphor once 81% of the journey sits outside anything a CRM records. Gartner research cited across the industry places 65% to 70% of the self-directed purchase journey ahead of any conversation with a sales rep. That figure has held roughly steady even as AI research tools multiply the number of places a buyer can quietly evaluate a vendor before ever filling out a form.
The practical consequence is that channel-level attribution answers the wrong question. It reports on the roughly one-fifth of the journey that happened to leave a digital trace, and stays silent on the four-fifths that decided the outcome.
The 80/20 finding that reframes what to measure
The 2026 State of Marketing Attribution Report, researched by Scott Brinker and Frans Riemersma with CaliberMind, found that roughly 80% of revenue flows from about 20% of customer journeys, data sources and tools. Interviewed teams that could name their most profitable customers, what those customers buy most, and where the margin sits were the ones running attribution programs that actually changed budget decisions. Nine out of ten marketers interviewed could not answer those three questions on the spot.
The report's own framing is blunt about where value concentrates: often just 3 to 5 decisive moments per segment move the revenue needle, not all 88 touchpoints equally. Attribution built to track everything evenly is attribution built to answer the wrong question at scale.
Confidence in ROI measurement is not the same as holistic measurement
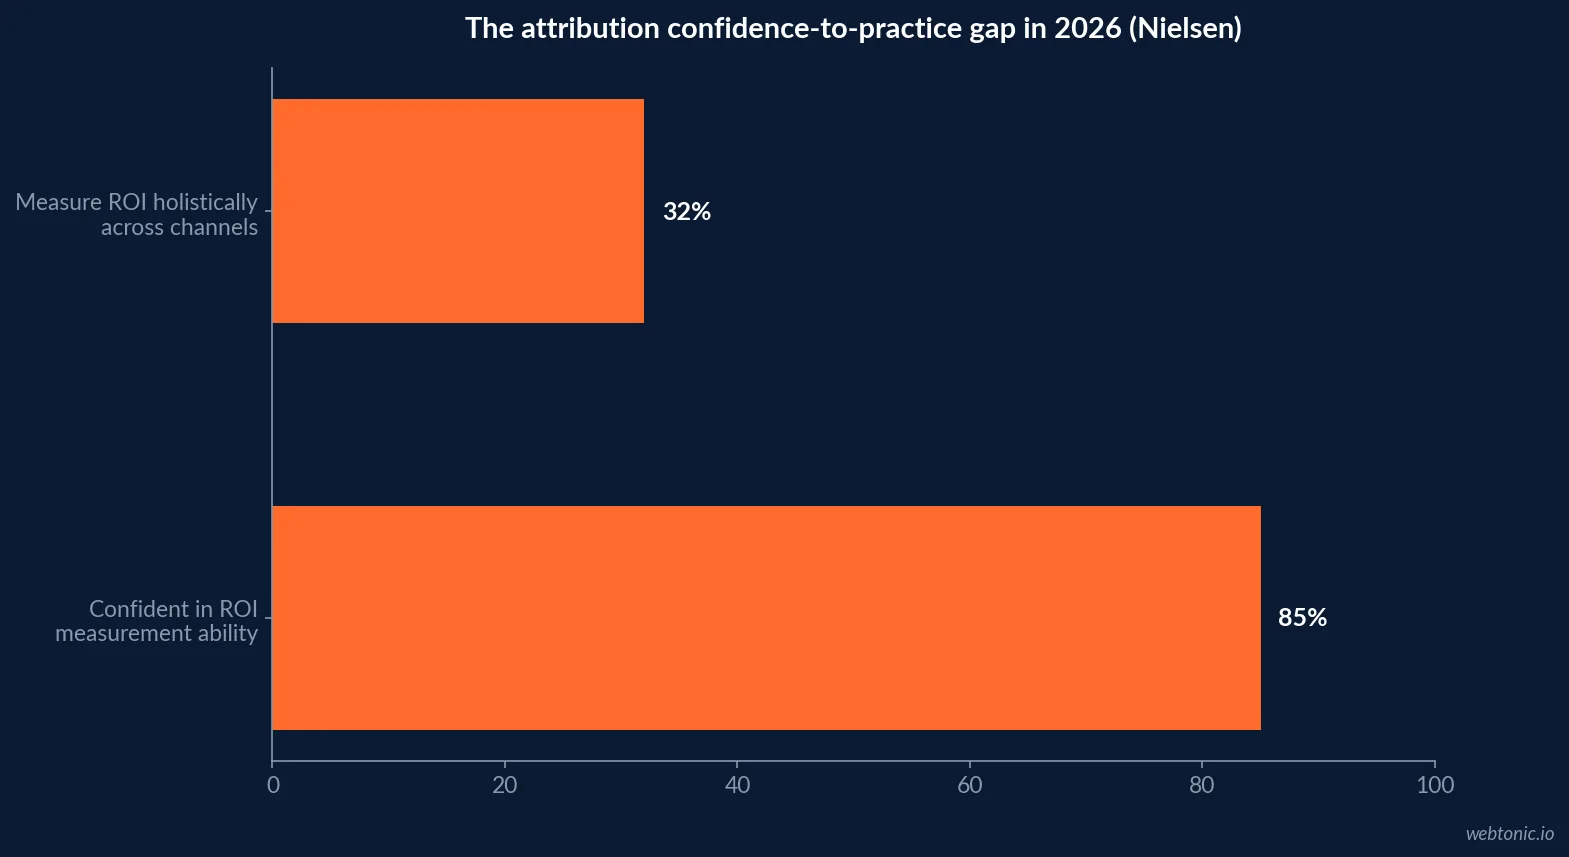
Nielsen's Marketing ROI Blueprint surveyed brand and media investment leaders and found 85% express confidence in their ability to measure ROI, but only 32% actually measure ROI holistically across traditional and digital media. The same report found 38% of marketers now prioritize sales or ROI as their top success metric over reach, 60% incorporate both reach/frequency and ROI into cross-media measurement, and 27% still measure sponsorship separately from the rest of the mix. A confidence-to-practice gap of 53 points is not a rounding error; it is most of the market overestimating what its stack can actually tell it.
| Measurement behavior (2026) | Share of marketers | Source |
|---|---|---|
| Confident in ROI measurement ability | 85% | Nielsen Marketing ROI Blueprint |
| Actually measure ROI holistically across media | 32% | Nielsen Marketing ROI Blueprint |
| Prioritize sales/ROI as top success metric | 38% | Nielsen Marketing ROI Blueprint |
| Incorporate both reach and ROI in cross-media measurement | 60% | Nielsen Marketing ROI Blueprint |
| Still measure sponsorship in isolation | 27% | Nielsen Marketing ROI Blueprint |
Multi-touch attribution and marketing mix modeling are converging, not competing
The old debate over which single model is "right" is giving way to a dual-model norm. eMarketer's Media Mix Modeling Trends 2026 report frames MMM as evolving from a reporting tool into a decision engine, but finds only 28% of marketers say their organization is very effective at converting MMM insight into action. Data and governance, not the model math, are the report's stated limiter.
That mirrors what CaliberMind's report calls "context engineering": clean campaign tagging, consistent field definitions and shared terminology across marketing, sales and finance are the unglamorous prerequisite that decides whether either model produces a decision or just another dashboard nobody trusts.
| Measurement posture | What it answers | 2026 adoption / effectiveness | Primary risk |
|---|---|---|---|
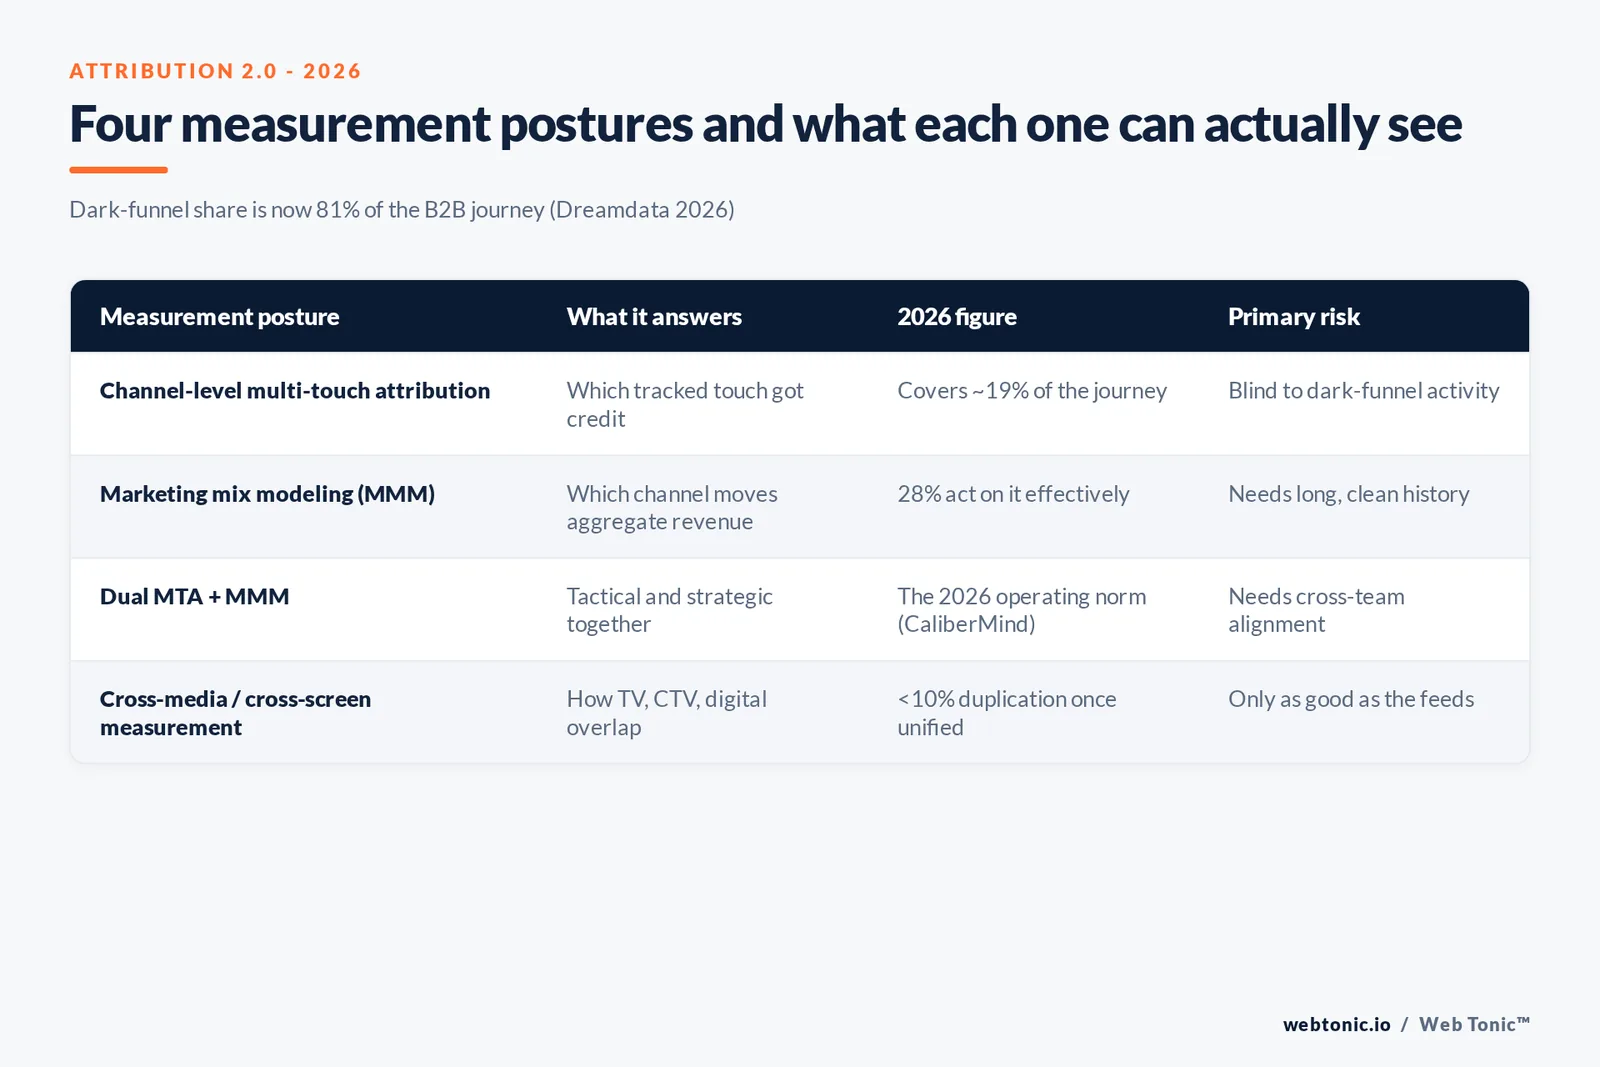
| Channel-level multi-touch attribution | Which tracked touch got credit | Standard on top of ~19% of the journey | Blind to 81% dark-funnel activity |
| Marketing mix modeling (MMM) | Which channel moves aggregate revenue | 28% call their org very effective at acting on it | Needs long, clean historical data |
| Dual MTA + MMM ("Attribution 2.0") | Tactical and strategic decisions together | Framed by CaliberMind as the 2026 operating norm | Requires cross-team alignment, not just tooling |
| Cross-media / cross-screen measurement | How TV, CTV and digital overlap | BARC/Nielsen One Ads: under 10% duplication observed | Only as good as the platforms feeding it |
Where confidence is actually expected to fall in 2026
Forrester's Predictions 2026 report expects confidence in marketing measurement to decline by roughly 7 points from the 79% of US B2C marketing leaders who felt confident measuring business impact in 2025. Forrester's own explanation is not that measurement got worse -- it is that open-source MMM methods are now exposing data and culture gaps that closed vendor dashboards used to hide. Sunlight on the process, in other words, is temporarily lowering the confidence score even as the underlying practice improves.
What cross-screen data adds when it works
A BARC | Nielsen One Ads cross-screen measurement deployment during the ICC Men's T20 World Cup 2026 found cross-platform duplication under 10% across participating campaigns, meaning television and digital were mostly reaching distinct audiences rather than double-counting the same eyeballs. That is the kind of finding attribution built on single-platform dashboards cannot produce on its own: it takes a unified, deduplicated view across screens to see that reach is additive rather than repeated.
It is also a reminder that Meta itself is leaning on automated, AI-assisted products to grow: the company reported $42.3 billion in Q1 2026 advertising revenue, up 19% year over year, with leadership crediting Advantage+ products as a primary driver. Platform-side automation is scaling faster than most advertisers' ability to attribute what it is actually doing.
| What the evidence supports for 2026 attribution work | Why |
|---|---|
| Run MTA and MMM in parallel, not as a debate | CaliberMind found dual-model use is the operating norm among mature teams |
| Instrument the 3 to 5 decisive moments per segment first | The report found ~80% of revenue traces to ~20% of journeys |
| Treat dark-funnel share as a KPI, not an excuse | Dreamdata: 81% of the journey is untracked and rising |
| Audit the confidence-to-practice gap before buying new tooling | Nielsen: 85% confident vs. 32% measuring holistically |
| Fix data hygiene before scaling MMM cadence | eMarketer: only 28% convert MMM insight into action |
| Where attribution research is heading next | What changed | Source |
|---|---|---|
| Model debate | Single-model arguments giving way to dual MTA + MMM use | CaliberMind 2026 |
| Unit of analysis | Shifting from channel credit to the 3-5 decisive moments per segment | CaliberMind 2026 |
| Confidence trend | B2C confidence in measurement projected to fall ~7 points from 79% | Forrester Predictions 2026 |
| Dark-funnel share | Rising from 70% to 81% of the journey in one year | Dreamdata 2026 |
| AI's role | Shifting from data cleanup toward reasoning over structured context | chiefmartec / CaliberMind 2026 |
How to act on this without another 12-month measurement project
Start by naming the 3 to 5 moments per segment that CaliberMind's interviews kept surfacing as the ones that actually move revenue, and instrument those first rather than every channel evenly. Pair a lightweight MMM read with existing multi-touch attribution so budget conversations reference both a tactical signal and a directional one -- the dual-model pattern the 2026 research keeps describing as the norm among the teams that trust their own numbers. Our data and analytics team and growth marketing practice both build against this dual model rather than a single dashboard. If the honest answer right now is "we don't fully know," that finding alone is worth reporting -- it is more useful than a number nobody on the team actually trusts, and it is the same gap Nielsen measured across the wider market. For a related read on where budget actually converts once it is tracked, see our breakdown of conversion rate benchmarks, or talk to us about building a measurement stack that survives a board question.
Frequently Asked Questions
How many touchpoints does a B2B customer journey have in 2026?
Dreamdata's 2026 LinkedIn Ads Benchmarks Report, built from more than 66 million B2B sessions, puts the average B2B deal at 88 touchpoints across 4 channels and 10 stakeholders, up from 76 touchpoints, 3.7 channels and 6.8 stakeholders a year earlier. The buying journey itself now runs 272 days on average. Older "7 touches to a meeting" heuristics were never measured against a journey this long and this crowded.
What share of the B2B buyer journey happens outside a tracked pipeline?
Dreamdata reports that 81% of the B2B customer journey now happens outside the sales pipeline, up from 70% the year before. That is the practical definition of the dark funnel: research, peer conversation and self-directed evaluation that a CRM never sees a record of, only the eventual opportunity that survives it.
Are marketers actually confident in what their attribution tells them?
Not evenly. Nielsen's Marketing ROI Blueprint reports 85% of marketers express confidence in measuring ROI, but only 32% actually measure it holistically across traditional and digital media. That 53-point gap between stated confidence and holistic practice is the single most reproducible finding in 2026 attribution research.
Is multi-touch attribution or marketing mix modeling the right model for 2026?
Increasingly both, run in parallel rather than argued over. CaliberMind's 2026 State of Marketing Attribution Report, researched with Scott Brinker and Frans Riemersma, found that roughly 80% of revenue traces to about 20% of customer journeys, data sources and tools - which argues for concentrating measurement effort on the few decisive moments per segment rather than instrumenting every channel evenly. eMarketer's 2026 Media Mix Modeling Trends report separately found only 28% of marketers call their organization very effective at turning MMM output into a decision.
Will confidence in attribution keep climbing through 2026?
Forrester's Predictions 2026 report expects the opposite for B2C: confidence in marketing measurement declining by roughly 7 points from the 79% who felt confident in 2025, as open-source MMM methods expose gaps in data and culture that vendor dashboards used to paper over.
Sources
Dreamdata - 2026 LinkedIn Ads Benchmarks Report
CaliberMind - The 2026 State of Marketing Attribution Report
Scott Brinker (chiefmartec) - Attribution 2.0, on the 2026 State of Marketing Attribution Report
Nielsen - The Marketing ROI Blueprint
eMarketer - Media Mix Modeling Trends 2026
Forrester - Predictions 2026: CMOs Hunker Down But Don't Retreat
JioStar - BARC | Nielsen One Ads cross-screen findings, ICC Men's T20 World Cup 2026
OrbitalX - Forget 7 Touchpoints: B2B Buyers Now Take 80+ Interactions to Convert


