



Table of contents
No published benchmark tells a media planner exactly what percentage of a budget to reserve for attention metrics, so this page builds the number from adoption data, outcome data and martech spend data instead of quoting a single figure. The unit of analysis is the campaign budget line, not a platform or an industry.
Key Takeaways
- 47% of US buy-side decision-makers expected to focus more on attention metrics.
- That is up from 36% a year earlier, per IAB data.
- 88% of media experts use attention measurement in some capacity.
- 54% rely on proxy signals rather than direct eye-tracking data.
- 39% have built an in-house solution instead of buying a vendor.
- The IAB/MRC guidelines published in November 2025 are the first standardized framework.
- Adelaide's 2026 Outcomes Guide covers 60 case studies across 16 industries.
- Attention-powered campaigns saw a 33% average lift in upper-funnel KPIs.
- Lower-funnel impact rose 53% on the same campaigns.
- One bank holding company drove 2.8x more conversions at a lower cost.
- A global e-commerce brand generated 3.8x more checkouts from high-attention audio.
- A food and beverage advertiser saw up to 60% lifts in unaided awareness.
- Adelaide's benchmarks draw on over 100,000 domains.
- That is more than 11 million monthly placements representing 173 billion impressions.
- Martech now takes just 19.4% of the marketing budget, a five-year low.
- That is down from 26.6% in 2021, per Gartner.
- 56% of marketers moved martech budget to consumption pricing in the past year.
- Video viewability alone reached 79.7% globally in 2026, setting the pre-attention floor.
Why there is no fixed attention-budget percentage yet
Attention measurement is priced by the vendor relationship, not by a published category rate - unlike, say, a martech license fee. The IAB and Media Rating Council only released standardized Attention Measurement Guidelines in November 2025, giving the industry its first common reference point for comparing vendors. Before that framework existed, planners were budgeting on intent signals rather than a rate card: IAB survey data found 47% of US buy-side decision-makers expected their organization to focus more on attention metrics, up from 36% the year before.
That is the honest starting point for a 2026 budget conversation: treat attention verification as a growing line with real outcome evidence behind it, not as a mature category with a settled price.
How much adoption has actually reached
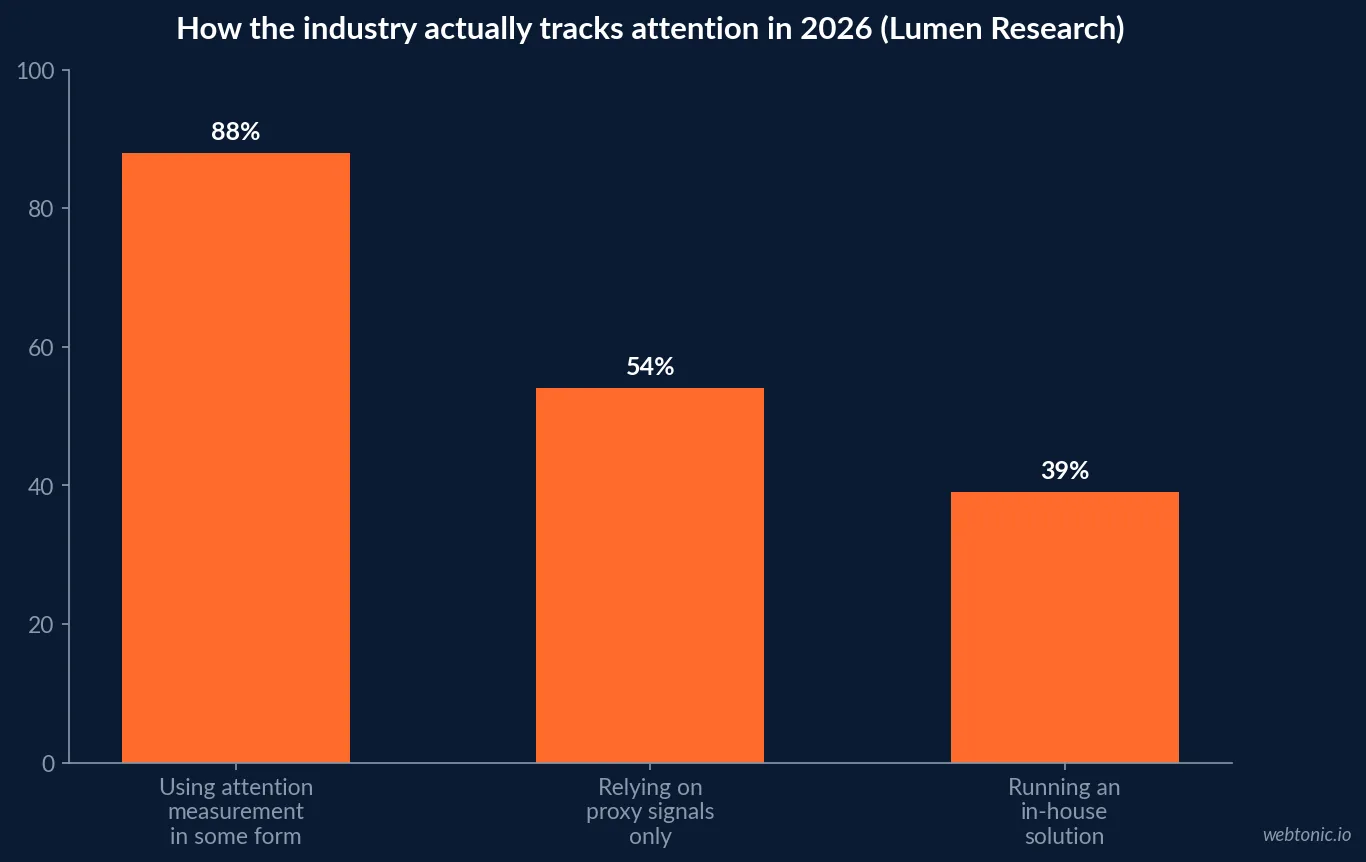
Lumen Research's landscape survey found 88% of media experts already use attention measurement in some capacity. But the same survey found the rigor behind that adoption varies widely: 54% use proxy signals - dwell time, hover, or scroll-depth stand-ins for genuine eye-tracking data - and 39% have built an in-house solution rather than licensing a specialist vendor. A budget line that funds only a proxy-signal dashboard is not buying the same thing as one that funds MRC-aligned eye-tracking data, and the two should not carry the same price expectation.
| Adoption metric (2026) | Figure | Source | Budget implication |
|---|---|---|---|
| Using attention measurement in some form | 88% | Lumen Research | Near-universal awareness |
| Relying on proxy signals only | 54% | Lumen Research | Cheaper, lower rigor |
| Running an in-house solution | 39% | Lumen Research | No vendor fee, but no benchmark scale |
| Expecting more attention focus (2026 vs. prior year) | 47% vs. 36% | IAB | Budget pressure is rising |
| IAB/MRC guidelines published | November 2025 | IAB / MRC | First common vendor yardstick |
What the outcome data says the spend is worth
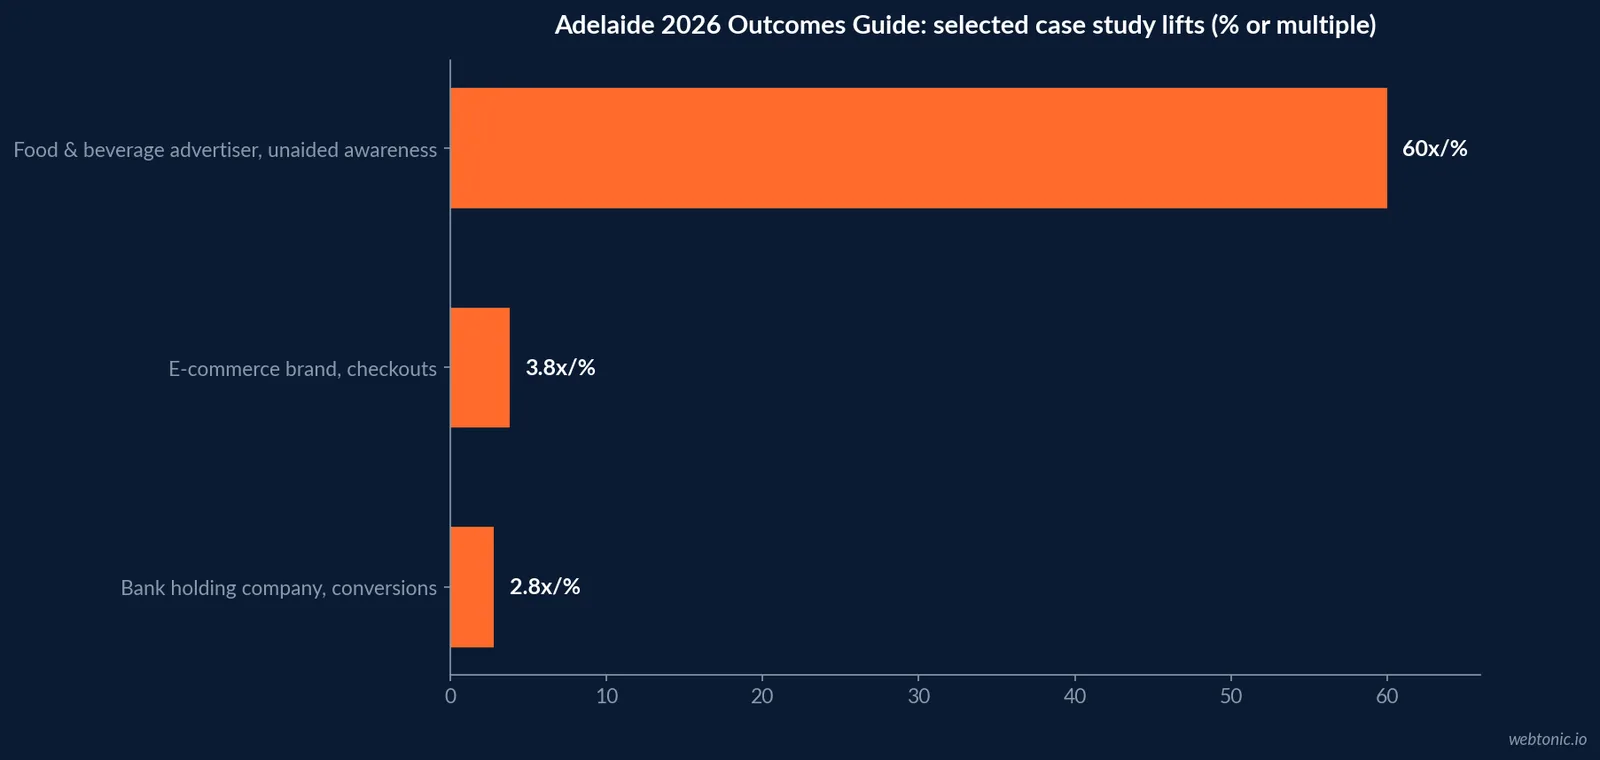
Adelaide's 2026 Outcomes Guide compiles 60 case studies across 16 industries, each backed by third-party outcome measurement. Across attention-powered campaigns run in 2025, advertisers saw an average 33% lift in upper-funnel KPIs and a 53% increase in lower-funnel impact. Individual results go further: a bank holding company drove 2.8x more conversions at a lower cost while lifting familiarity and recall, a global e-commerce brand generated 3.8x more checkouts by prioritizing high-attention audio placements, and a food and beverage advertiser saw lifts of up to 60% in unaided awareness from CTV inventory that cleared its attention floor.
Those numbers argue for funding attention verification out of the media budget, where its ROI is visible, rather than treating it as a pure overhead line competing with tooling spend.
The scale behind the benchmark a planner is actually buying
Benchmark scale is the difference between a directional signal and a planning input. Per EMARKETER's industry-KPI listing, Adelaide's data is built from more than 11 million monthly placements, representing over 173 billion impressions, across more than 1,000 global campaigns, with an average of 380,000 domains and 18 industries measured monthly. Adelaide's own resource pages put the underlying domain count at over 100,000. Any vendor a planner budgets for should be able to state a comparable figure - if they cannot, the "benchmark" being sold is a single client's history, not an industry norm.
| Scale metric | 2026 figure | Source | Why it matters for budgeting |
|---|---|---|---|
| Monthly placements measured | 11M+ | EMARKETER / Adelaide | Statistical reliability of the norm |
| Monthly impressions measured | 173B+ | EMARKETER / Adelaide | Depth behind the score |
| Domains in the benchmark | 100,000+ | Adelaide | Coverage across the open web |
| Industries measured | 18 | EMARKETER / Adelaide | Relevance of the norm to your category |
| Global campaigns represented | 1,000+ | EMARKETER / Adelaide | Breadth across advertiser types |
What a planner is actually being asked to trust
The playbook behind the guidelines matters as much as the guidelines themselves. CIMM and the IAB's jointly developed Attention Measurement Playbook, built from more than 40 industry interviews, explicitly warns marketers against treating attention as a currency or a binary pass/fail outcome, and frames it instead as a probabilistic signal to complement viewability and outcome data - not replace either one. That framing should shape the budget conversation directly: a planner funding "attention" as if it were a guaranteed KPI is buying something the playbook's own authors say the metric cannot deliver.
Practically, that means budgeting for attention data as a planning and optimization input inside an existing media or measurement line, rather than carving out a dedicated "attention success" bonus pool tied to the score alone.
| What the Playbook says attention is | What it says attention is not | Budget implication |
|---|---|---|
| A probabilistic, dynamic signal | A guaranteed currency | Fund as an input, not a KPI bonus |
| A complement to viewability and outcomes | A replacement for either | Keep existing measurement lines |
| Useful for planning, creative testing, MMM | A binary pass/fail gate | Route to optimization budget |
Competing for budget with a shrinking martech line
Attention tools do not get funded in a vacuum. The 2026 Gartner CMO Spend Survey, covering 401 CMOs, found martech's share of the marketing budget has fallen to a five-year low of 19.4%, down from 26.6% in 2021, even though 62% of respondents planned to invest more in marketing technology this year. Part of the shift is structural: 56% of respondents increased the share of their martech budget allocated to consumption-based pricing in the past year, against just 9% who decreased it.
The practical read for a planner: a standalone attention SaaS subscription is fighting for space inside a shrinking martech pool, while attention verification bundled into media activation - like Adelaide's pre-bid segments inside Amazon DSP - draws on the media budget instead, which is not shrinking at the same rate.
| 2026 budget context | Figure | Source |
|---|---|---|
| Martech share of marketing budget | 19.4% | Gartner CMO Spend Survey |
| Martech share of budget, 2021 | 26.6% | Gartner CMO Spend Survey |
| CMOs planning to invest more in martech | 62% | Gartner CMO Spend Survey |
| Shifted martech budget to consumption pricing | 56% | Gartner CMO Spend Survey |
| Global video viewability floor | 79.7% | Integral Ad Science |
| Budget scenario | Recommended source line | Why |
|---|---|---|
| Vendor with 100,000+ domain benchmark and case-study outcomes | Media budget | ROI is visible per Adelaide's 33%/53% averages |
| Proxy-signal dashboard, no accreditation | Small martech line | Cheaper, matches what 54% already run |
| In-house build | Engineering time, not a media or martech fee | 39% of the industry already does this |
| Vendor pursuing MRC accreditation | Media budget, reviewed annually | Compliance trail justifies the premium |
A working budget rule for 2026
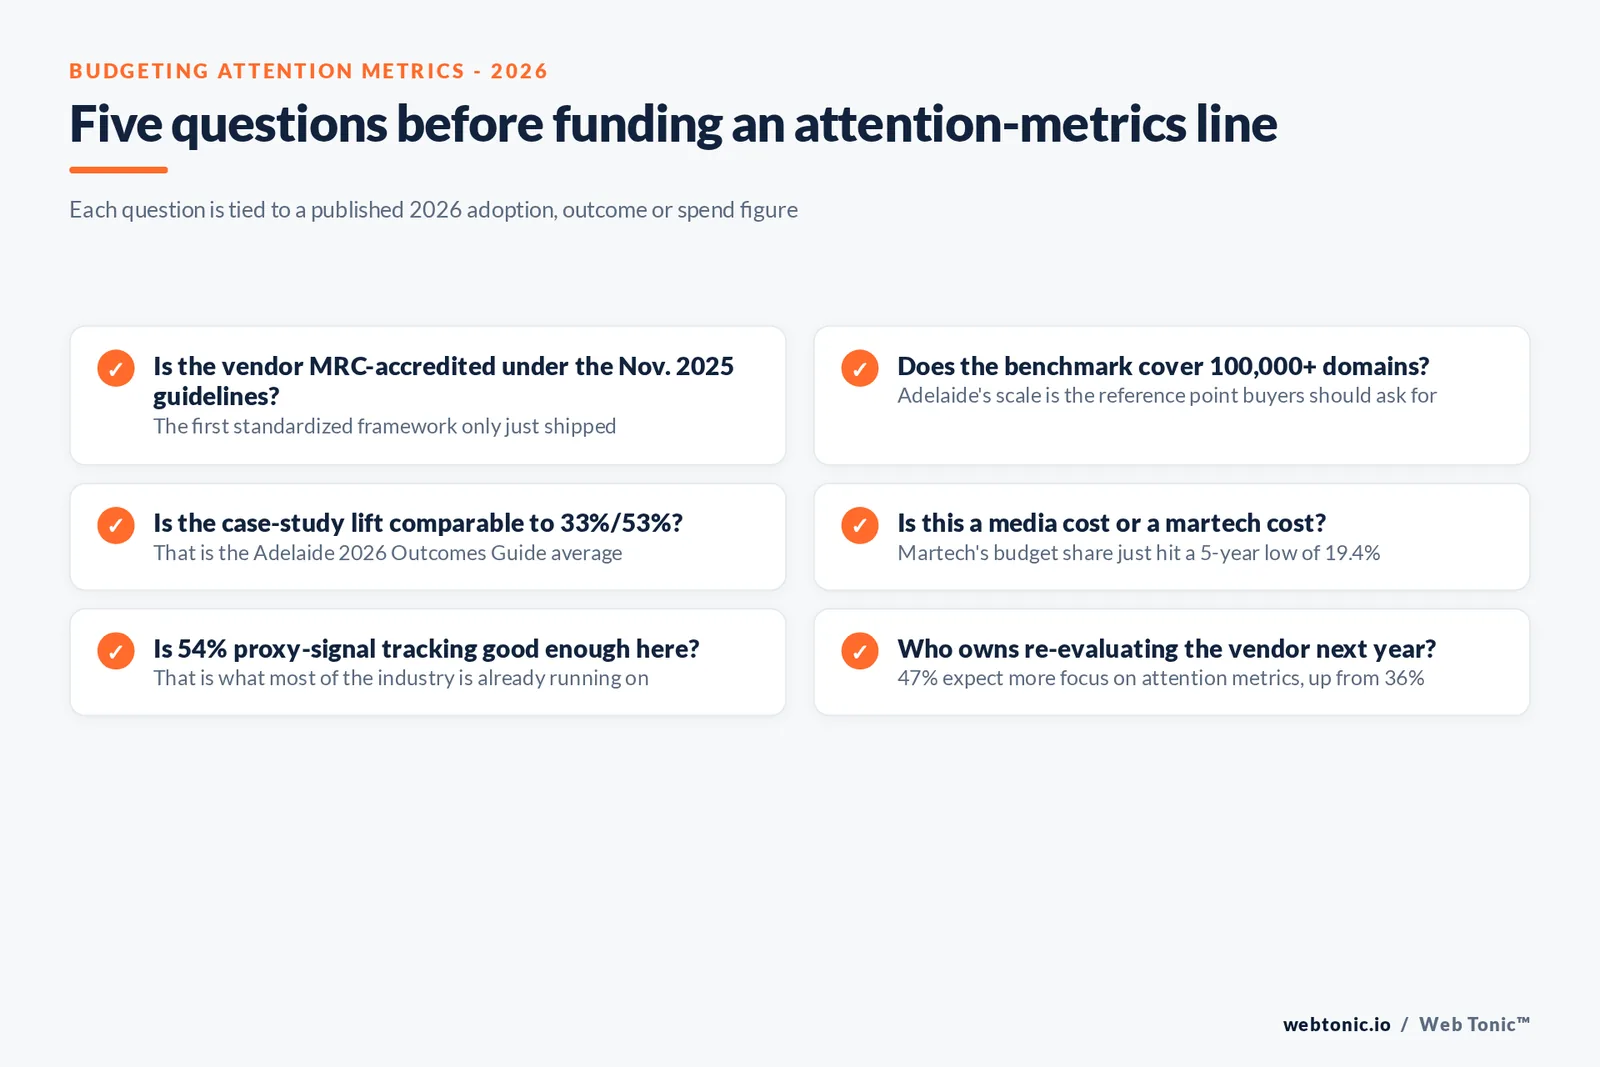
Fund attention verification from the media line for any channel where a vendor can show a 100,000-domain-scale benchmark and a case-study outcome comparable to Adelaide's 33%/53% averages; treat a martech-line attention dashboard built on proxy signals as a smaller, separate spend, since 54% of the industry is already using exactly that as a stop-gap. Re-evaluate the split once IAB/MRC accreditation becomes common, which should let planners compare vendor claims on equal footing rather than on marketing collateral.
Our growth marketing team builds that split into the channel plan itself rather than bolting it on after the media is booked, and our Google Ads strategy guide covers where a verification budget line fits alongside bidding and creative testing. For broader spend benchmarks, see our digital marketing statistics roundup or talk to our media planning team directly.
Frequently Asked Questions
Do media planners actually need a separate line item for attention metrics?
The industry is moving that way but has not standardized it yet. The IAB and Media Rating Council released the first standardized Attention Measurement Guidelines in November 2025, giving planners a common framework to compare vendors for the first time. Ahead of that, IAB survey data already had 47% of US buy-side decision-makers expecting their organization to focus more on attention metrics, up from 36% a year earlier - evidence of intent outrunning formal process.
What is a realistic budget lift for adding attention verification?
Adelaide's 2026 Outcomes Guide, covering 60 case studies across 16 industries with third-party outcome measurement, reports advertisers seeing an average 33% lift in upper-funnel KPIs and a 53% increase in lower-funnel impact from attention-powered campaigns in 2025. Those are outcome lifts, not cost lifts - most attention vendors price the measurement layer as a percentage add-on to existing media spend rather than a separate media line.
Should attention budget come out of the martech line or the media line?
Most of it belongs in media, because attention vendors increasingly sell activation, not just reporting - Adelaide's AU now runs inside Amazon DSP as pre-bid targeting, meaning the spend shifts media dollars toward higher-scoring inventory rather than adding a separate tool fee. The Gartner CMO Spend Survey found martech's share of the marketing budget has fallen to a five-year low of 19.4% in 2026 from 26.6% in 2021, so a new tool line is competing for a shrinking pool.
How many advertisers are already using attention measurement in some form?
Lumen Research's landscape survey found 88% of media experts were using attention measurement in some capacity, though more than half - 54% - were relying on proxy signals rather than direct eye-tracking or gaze-prediction data, and 39% had built an in-house solution instead of buying a vendor. That gap between broad adoption and rigorous measurement is exactly what the IAB/MRC guidelines are meant to close.
What should a planner ask a vendor before allocating budget to attention scores?
Ask for the underlying benchmark size and whether the vendor is pursuing MRC accreditation under the November 2025 guidelines. Adelaide, for example, discloses benchmarks built from over 100,000 domains and, per its industry-KPI listing, more than 11 million monthly placements representing over 173 billion impressions - the kind of scale that makes an AU floor a planning input rather than a guess.
Sources
IAB - Attention Measurement: The Industry Framework
EMARKETER - FAQ on attention metrics
Lumen Research - The attention metrics landscape survey
Adelaide - 2026 Outcomes Guide
EMARKETER - Attention Metric (AU) by channel and platform
Chief Marketer - 2026 Gartner CMO Spend Survey
Integral Ad Science - 21st Media Quality Report
CIMM / IAB - Attention Measurement Playbook for Marketers


