Table of contents

AI advisory is measurable, but not with the metrics most teams reach for first. Adoption and prompt volume rise everywhere; they prove nothing about the engagement you paid for.
Key Takeaways
- Measure in four layers — readiness, adoption depth, output economics, then business impact — and read each at the date it can actually move.
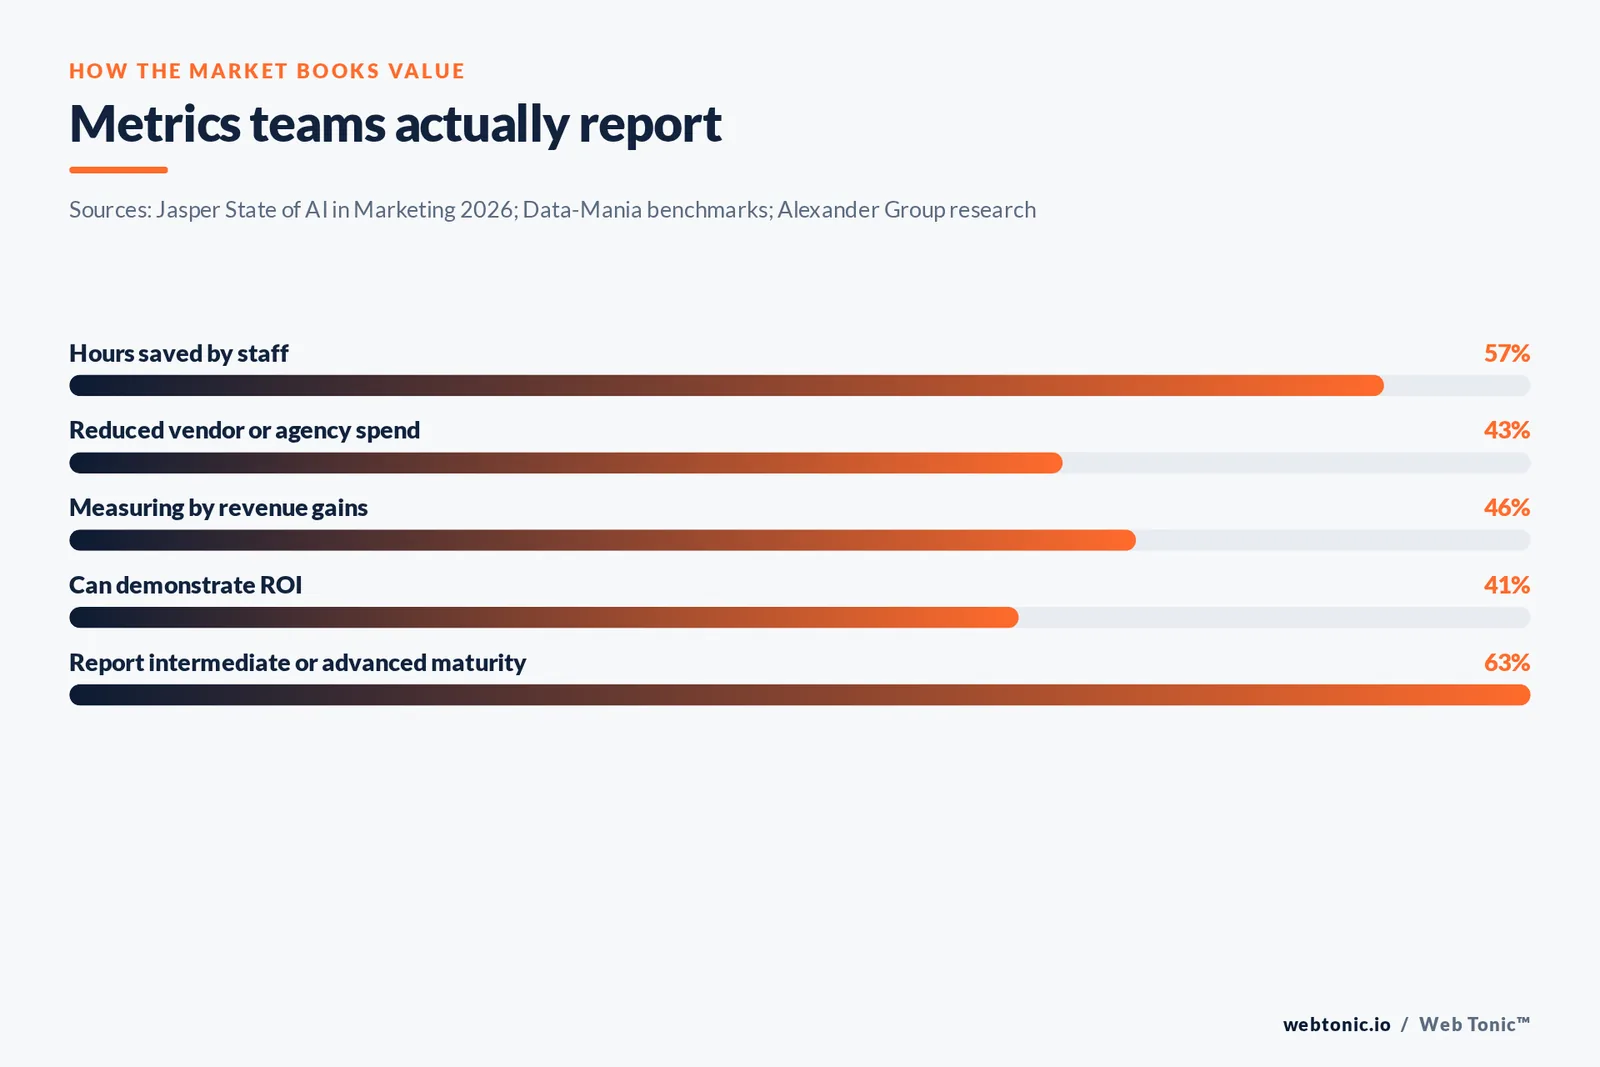
- The metric the market uses most is hours saved by full-time staff at 57% of teams, followed by reduced outsourced or agency spend at 43%.
- The benchmark to beat is a median 6.1 hours saved per person per week; senior staff report nearer 8–10, junior staff 3–4.
- Business-outcome tracking pays off: teams tracking business outcomes are 45% more likely to report meaningful AI impact.
- Depth of automation is the honest maturity read — 87% of teams use generative AI in recurring workflows, but only 9% have fully automated journeys, 59% are partial and 32% orchestrated.
- Near-universal adoption without proof is the norm: about 96% of marketers use AI while only 41% can demonstrate ROI, and AI performs a mean 24.2% of optimisation effort.
- Expect programme payback at 90–180 days, so the day-90 report shows a trend and a projection, not a settled return.
Why the obvious metrics mislead
Seat counts, prompt counts and "percentage of the team using AI weekly" all go up on their own. Adoption research puts 87% of marketers using generative AI in at least one workflow, up from 51% in 2024. One 2026 research release puts adoption at 96% of marketers while only 41% can demonstrate ROI. If a metric would improve without your advisor, it cannot grade your advisor.
The second trap is grading everything on revenue. Benchmark research found 46% of marketers primarily measure AI tool performance by revenue gains, and notes the discrepancy between that and what they actually use AI for. Most AI marketing work attacks production cost and cycle time; asking a content workflow to prove revenue lift in one quarter guarantees an unfalsifiable answer.
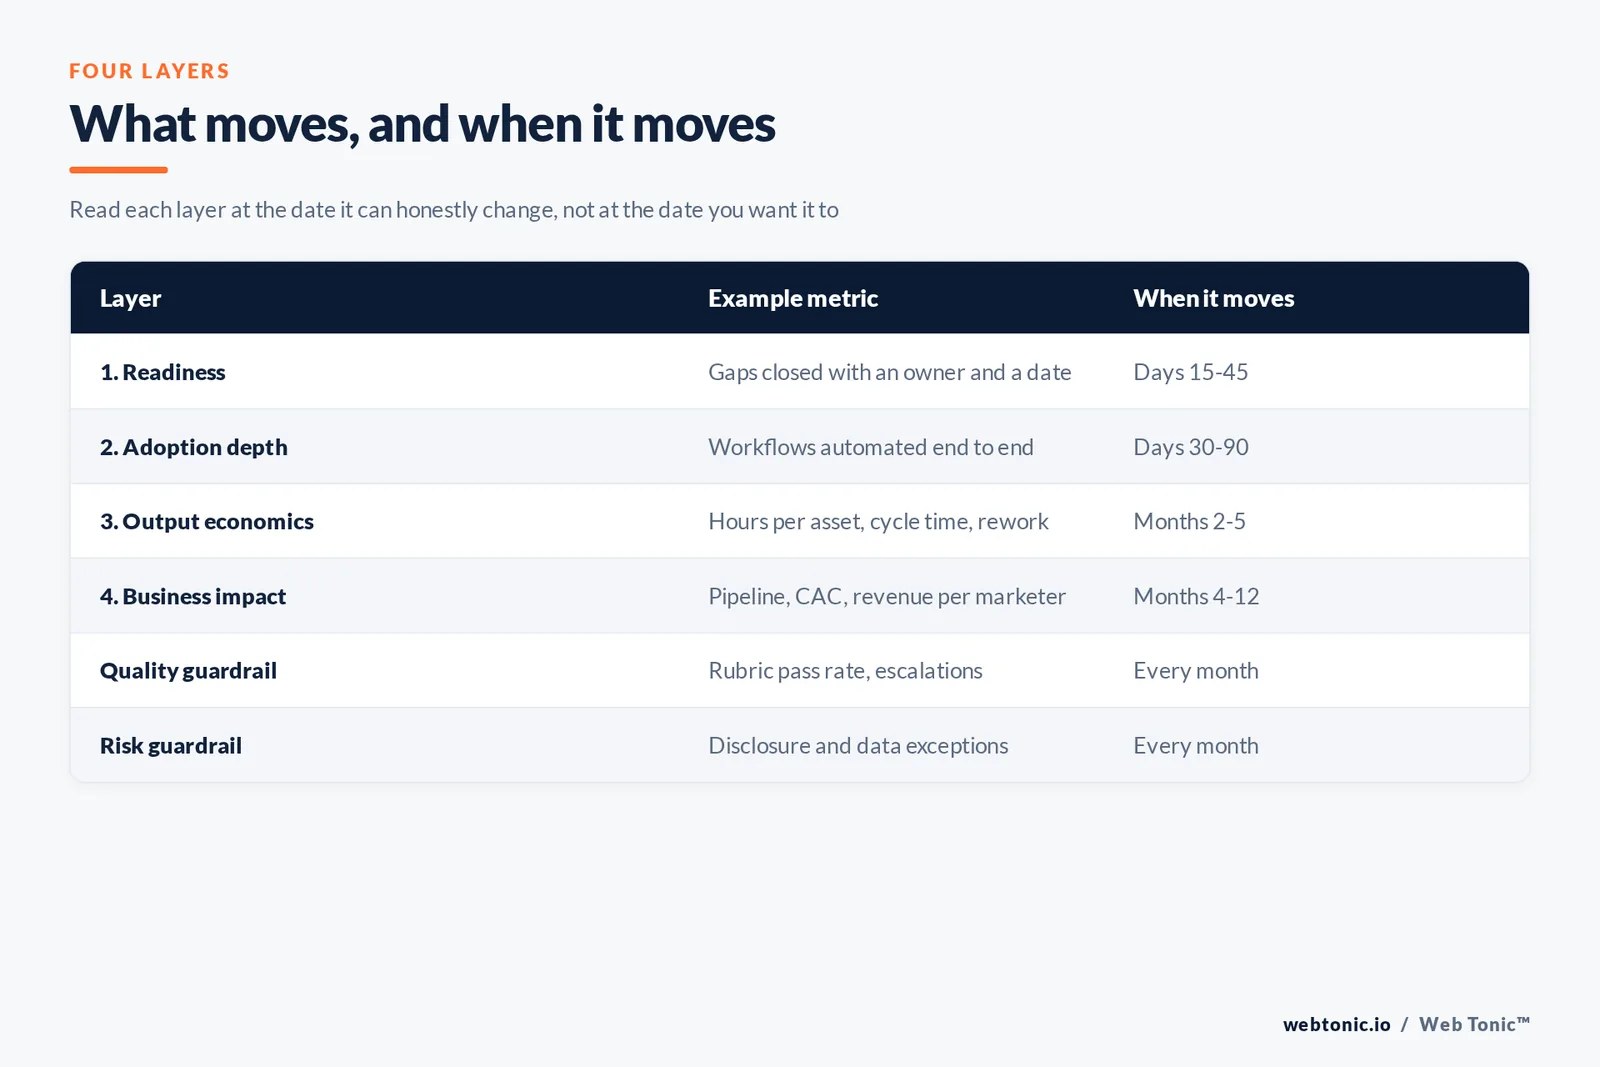
| Layer | Example metric | When it moves |
|---|---|---|
| 1. Readiness | Data, access and governance gaps closed vs opened | Days 15–45 |
| 2. Adoption depth | Workflows automated end to end, not seats used | Days 30–90 |
| 3. Output economics | Hours per asset, cycle time, rework rate | Months 2–5 |
| 4. Business impact | Pipeline contribution, CAC, revenue per marketer | Months 4–12 |
| Quality guardrail | Rubric pass rate and escalation count | Reported every month |
| Risk guardrail | Disclosure and data-handling exceptions | Reported every month |
Layer one: readiness, measured as gaps closed
In the first six weeks the only fair question is whether the advisory work has made the ground firmer. That is countable: how many data gaps were identified and how many now have an owner and a date; whether an approved-tools list exists with data-handling notes; whether every content type has a written review rule. A readiness score is only useful if it is the same instrument at day 0 and day 90 — re-scoring with a new rubric is how engagements manufacture progress.
Depth matters here because breadth is already assumed. Compiled survey data citing the CMO Survey finds AI performing a mean 24.2% of optimisation and automation effort and generative AI used a mean 22.4% of the time — broad but shallow. Advisory that raises depth on three workflows beats advisory that raises awareness across thirty people.
Layer two: adoption depth, not adoption
Count workflows, not users. Operations benchmarks give the shape of the market: generative AI in recurring workflows at 87% of teams, partial automation at 59%, orchestrated automation at 32% and fully automated customer journeys at only 9%. Placing your own count on that scale is a more honest maturity read than any vendor questionnaire.
Two supporting counts make the layer usable. First, how many workflows have a written owner, a rubric and a retirement decision for the step they replaced — a workflow that runs alongside the old process has not been adopted. Second, exception volume: how often output is escalated to a human beyond the standard sign-off. Falling exceptions with stable quality is the signal that a build is maturing.
Layer three: output economics, where the money is
This is the layer where AI advisory usually earns its fee, and the market agrees. Jasper's 2026 State of AI in Marketing reports that AI ROI is concentrated at the cost-reduction and execution layers, with the most common metric being hours saved by full-time employees at 57%, followed by reduced outsourced vendor or agency spend at 43%. The same research puts AI use at 91% of marketing organisations, up from 63% a year earlier, with 63% reporting intermediate or advanced maturity.
Set the bar with the published median. Benchmark data puts median time saved at 6.1 hours per person per week. Convert that into your own currency rather than quoting it: hours per asset before and after, multiplied by monthly volume, priced at loaded hourly cost. A team of 8 marketers saving 4 hours each per week recovers roughly 128 hours a month, and that number is defensible in a way that "productivity improved" is not.
Cycle time is the second economic metric and often the more strategic one. One CMO measurement framework pairs productivity metrics such as hours saved with operational metrics such as time to launch, using examples like 120 hours saved per month and a campaign build cut from 14 days to 5. Always publish rework rate beside both. Halved production time with doubled revisions is a cost transfer, not a saving.
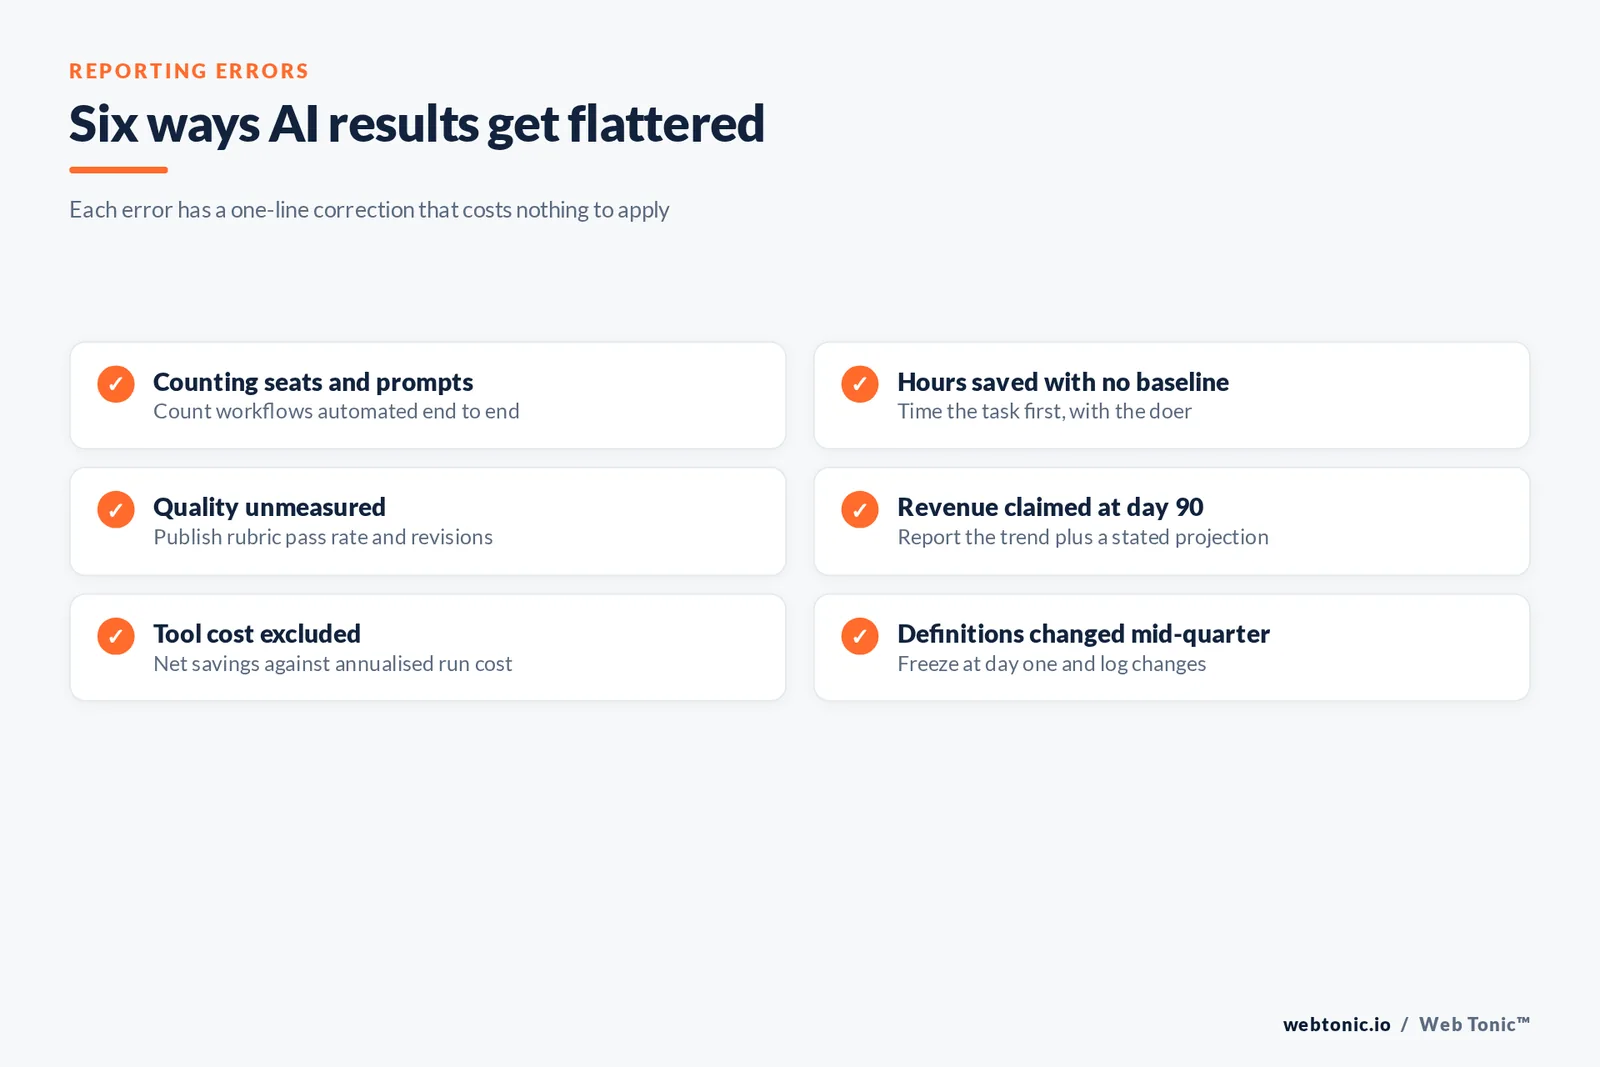
| Reporting error | Why it flatters the work | Correction |
|---|---|---|
| Counting seats and prompts | Rises without any intervention | Count workflows automated end to end |
| Hours saved with no baseline | Estimated after the fact by the buyer | Time the task before the build, from the doer |
| Quality left unmeasured | Rework moves out of the tracked step | Publish rubric pass rate and revision counts |
| Revenue claimed at day 90 | Payback usually lands at 90–180 days | Report the trend plus a projection with assumptions |
| Tool cost excluded | Licences and API spend sit in another budget | Net savings against total run cost |
| Definitions changed mid-quarter | New rubric makes progress appear | Freeze definitions at day one and log changes |
Layer four: business impact, read late and carefully
Business metrics belong in the report, but with an honest clock. ROI guidance citing the same 2026 research notes that teams tracking business outcomes are 45% more likely to report meaningful AI impact, and that setting baselines is the single most important step. The useful business metrics are the ones your finance team already trusts: pipeline contribution, cost per qualified lead, CAC, and revenue per marketing full-time employee.
Attribute conservatively. If a personalisation workflow shipped in month two and conversion rose in month four, publish the coverage rate of your measurement alongside the claim, and prefer holdouts where volume allows. Where volume is small, a pre-versus-post comparison with the limitation stated in one sentence is more credible than a confident number nobody can reproduce. Building that reporting layer properly is ordinary data intelligence work, and it is what makes the AI conversation auditable at board level.
The one-page report to insist on
Ask for a single page, monthly, with the same six rows every time: workflows live and automated end to end, hours saved against baseline, cycle time against baseline, rubric pass rate, net saving after tool cost, and one business metric with its coverage rate. Below it, three lines — what shipped, what failed, what changes next month. Anything longer becomes a narrative document, and narrative documents do not get compared month to month.
The same discipline applies to the engagement itself. Fees, tool licences and internal hours all belong on the cost side, so the number you are judging is net. Where measurement discipline is the wider problem rather than AI specifically, a marketing scorecard engagement fixes the reporting frame first, and a marketing audit establishes the baselines that make any AI claim testable.

What "working" looks like at 6 and 12 months
At six months, expect two or three workflows automated end to end with owners, a measured saving in the region of the 6.1-hour median across the affected roles, stable or improved quality scores, and a net saving after tool cost. At twelve months, expect the efficiency gain to show up in revenue per marketer or in avoided hiring, plus at least one business metric moving with a stated coverage rate. If neither has happened, the problem is usually workflow selection — high-frequency, low-risk processes were skipped in favour of visible ones.
And accept the discipline of stopping. Killing a workflow that failed its rubric is a cheap, correct outcome, and reporting it builds the credibility that makes the next scale decision easy. If you want this measurement frame set up before the next engagement starts, get in touch, or read more on the Web Tonic blog.
Reading the numbers with a finance audience
Finance teams do not distrust AI numbers because they dislike AI; they distrust them because the denominators keep moving. Three habits fix that. Freeze the baseline period and state it in every report — "hours per asset, measured across 6 weeks before go-live" — so the comparison never drifts. Show the workings once: volume times hours saved times loaded hourly cost, minus run cost. And separate confirmed savings from projected ones on the page, so a reader can accept the first without arguing about the second.
Then decide in advance what would count as failure. A workflow that saves under an hour per person per week against a median benchmark of 6.1, or one whose rework rate rises while its cycle time falls, has failed on its own terms and should be retired or rebuilt. Writing that threshold down before the engagement starts is what makes the eventual report credible, whichever way it goes, and it is the same discipline any good scorecard imposes on the rest of the marketing function.
One structural warning. Do not let the measurement plan become larger than the work it measures. Six rows on a page, refreshed monthly, with frozen definitions, beats a dashboard nobody opens and a quarterly deck nobody can compare. If a metric has not changed a decision in three months, drop it and keep the four layers thin enough that the whole engagement can be judged in about five minutes of reading. That brevity is not a shortcut; it is what makes the numbers survive contact with a board meeting, and it is the difference between an AI programme that can defend its budget and one that quietly loses it at the next planning cycle.
Beyond efficiency: the models finance teams already use
Larger organizations rarely judge marketing technology on productivity alone. Where media investment is significant, the existing measurement suite — marketing mix modelling, incrementality tests, and other causal analysis — is the frame a CFO already trusts, and AI-powered workflows should be inserted into that frame rather than reported beside it. If your enterprise stack contains an MMM or a geo-test capability, treat AI-driven output as one more variable in that model: does the brand or performance channel it touches show incremental profit, or only faster production?
For most mid-market companies that machinery does not exist, and building it is not the point of an AI engagement. The practical substitute is a small set of data-driven services metrics your team can maintain: cost per unit of output, cycle time, share of search and audience growth where relevant, and one revenue-side number per quarter. Keep the customer view attached to each — a workflow that improves internal efficiency while degrading the experience of leading segments is a loss the tools will never report on their own.
Frequently Asked Questions
What is the single best metric for AI advisory?
Hours saved per week against a measured baseline, published net of tool cost. It is what 57% of teams already use, and it is the metric AI work most reliably moves.
How soon should we expect ROI?
Programme payback including setup typically appears at 90–180 days. Efficiency signals on a single workflow can appear in 2–4 weeks, which is why the day-90 report should separate the two.
Is adoption ever worth reporting?
Only as depth. Workflows automated end to end is meaningful; percentage of staff with a licence is not, given that around 96% of marketers already use AI somewhere.
How do we stop savings from being imaginary?
Time the task before the build, with the person who does it, and retire the replaced step formally. Savings claimed while the old process still runs in parallel are accounting, not efficiency.
Should the advisor report their own numbers?
They can produce the report, but the definitions and the baseline should be frozen by you at day one and logged if changed. That one rule removes most of the ambiguity from AI reporting.
Sources
Jasper, The State of AI in Marketing 2026 · AI marketing operations benchmarks 2026 · How to measure AI marketing ROI · The AI marketing ROI framework CMOs use · 2026 benchmark study, marketing's AI inflection point · AI marketing statistics 2026 · AI in marketing statistics, verified data · Alexander Group 2026 research on AI ROI.