



Table of contents
Affiliate networks in 2026 are getting more clicks and paying out more per sale, while converting a smaller share of the traffic they receive. This page benchmarks the network itself - commission rates, payouts, CTR-adjacent click behavior and conversion rates - using 2026 data from Rewardful, Impact.com, the IAB and the Performance Marketing Association, not a single vertical case study.
Key Takeaways
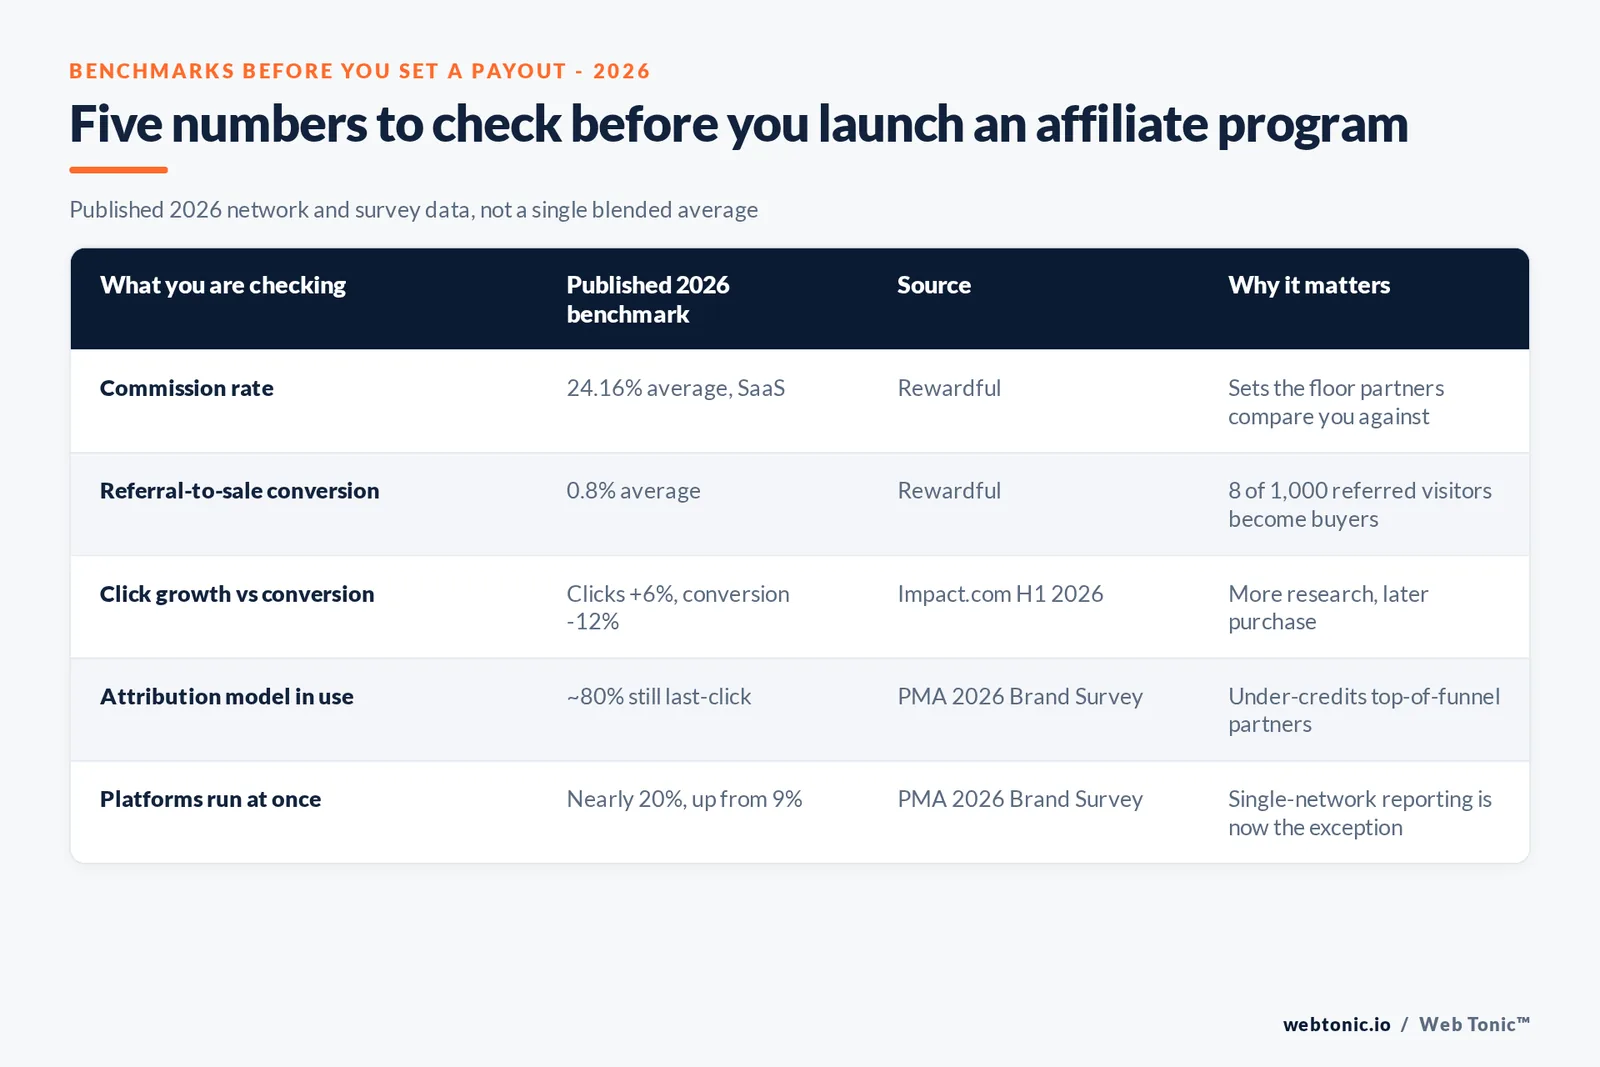
- Average affiliate commission rate is 24.16% across SaaS programs.
- Average payout per commission is USD 14.10, versus an all-time average of USD 13.56.
- Referral-to-sale conversion rate averages 0.8% - 8 of every 1,000 clicks.
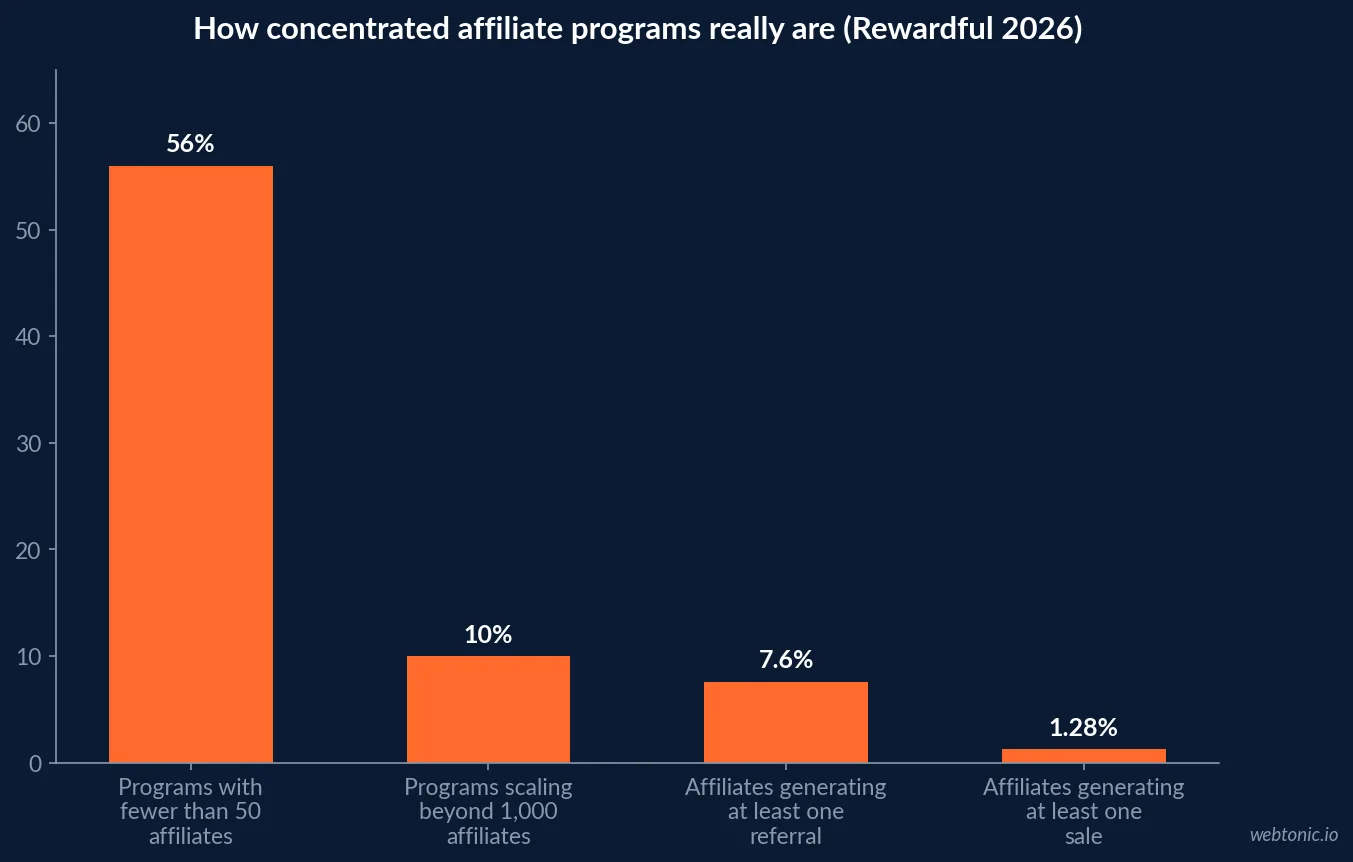
- Only 7.6% of affiliates generate at least one referral.
- Just 1.28% of affiliates generate at least one sale.
- 56% of programs run with fewer than 50 active affiliates.
- Only 10% of programs scale beyond 1,000 affiliates.
- H1 2026 clicks rose 6% year on year while conversion rate fell 12%.
- Full-year 2025 clicks rose 2% while conversions fell 5% and conversion rate fell 6%.
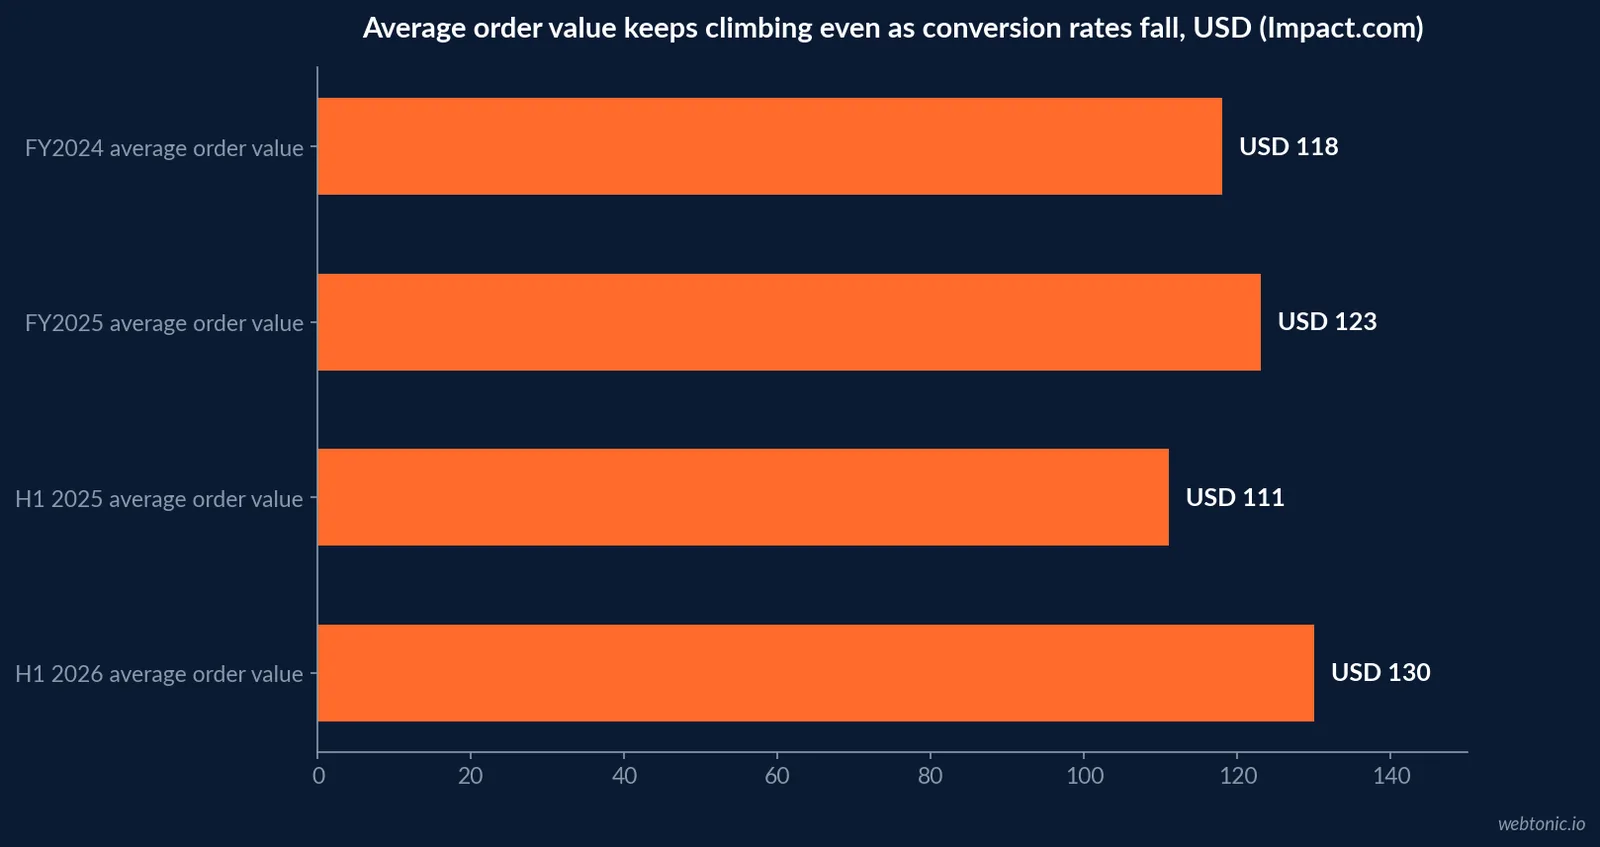
- Average order value climbed from USD 118 to USD 130 across the same period.
- Commission now absorbs 90% of total brand spend, up from 86% in 2025.
- Network Partners grew from 44% to 50% of clicks year over year.
- Loyalty and Rewards partners drove 55% of transactions in H1 2026.
- 87% of advertisers report satisfaction with affiliate marketing ROI.
- That compares with 71% satisfaction for retail media over the same period.
- Roughly 80% of programs still measure success on last-click attribution.
- Multi-platform programs nearly doubled, from under 9% to nearly 20%.
- A third of the industry is unprepared for upcoming privacy legislation.
What counts as a healthy affiliate network in 2026
There is no single passing score for an affiliate program, but three 2026 studies converge on a similar shape: modest commission rates, low-single-digit referral rates, and a small top tier of affiliates carrying most of the volume. Compare your own dashboard against the ranges below before concluding a program is under- or over-performing.
| Metric | 2026 benchmark | Source | What it tells you |
|---|---|---|---|
| Average commission rate | 24.16% | Rewardful | The rate most SaaS programs converge on |
| Average payout per commission | USD 14.10 | Rewardful | What a single conversion is worth in cash |
| Referral-to-sale conversion rate | 0.8% | Rewardful | 8 of 1,000 referred visitors become buyers |
| Programs under 50 affiliates | 56% | Rewardful | Most programs never reach meaningful scale |
| Programs beyond 1,000 affiliates | 10% | Rewardful | Scale is the exception, not the rule |
| Advertiser ROI satisfaction | 87% | IAB Australia 2025 | Confidence in the channel remains high |
Commission and payout benchmarks
Rewardful's 2026 State of SaaS Affiliate Programs report, drawn from live program data rather than a survey of opinions, is the most granular public source on what programs actually pay. The commission rate a manager sets and the payout a program actually delivers are two different numbers, and both matter when you are pricing a new program against the market.
| Payout metric | 2026 figure | How it is measured |
|---|---|---|
| Average commission rate | 24.16% | Rate set by the program manager |
| Average payout per commission | USD 14.10 | Cash value of a single approved commission |
| All-time average payout | USD 13.56 | Historical baseline across all programs measured |
| Typical commission cluster | 20%-30% | Where most SaaS programs land, regardless of category |
| Long-term program survival | 15.6% | Share of programs still operating long after launch |
Why clicks are up and conversions are down
Impact.com's benchmark work, drawn from its own network data across thousands of North American brands, is the largest publicly reported behavioral dataset on affiliate buyer behavior. Two consecutive studies now show the same shift: shoppers click more affiliate content to research, then take longer to actually buy.
| Metric | Full-year 2025 (2,368 brands) | H1 2026 (2,319 brands) |
|---|---|---|
| Clicks, year on year | +2% | +6% |
| Transactions, year on year | -5% | -7% |
| Conversion rate, year on year | -6% | -12% |
| Average order value | USD 118 to USD 123 (+4%) | USD 111 to USD 130 (+16%) |
| Commission share of total spend | 86%, up from 87% (roughly flat) | 90% of total brand spend |
Where the money actually goes now
The reallocation inside that spend is as telling as the totals. Impact.com's H1 2026 data shows Network Partners taking a growing share of clicks, Content Review Partners commanding a quarter of brand spending, and Loyalty and Rewards partners still closing the most transactions - three different partner types doing three different jobs in the same funnel.
| Partner type | H1 2026 share | What it is doing |
|---|---|---|
| Network Partners | 50% of clicks, up from 44% | Broad distribution across the network |
| Content Review Partners | 26% of brand spending | Top-of-funnel research and comparison content |
| Loyalty and Rewards Partners | 55% of transactions | Closing the sale at the point of purchase |
| Non-commission payments | 10% of total spend, down from 14% | Fixed fees and placement bonuses |
Attribution: still last-click, still risky
The Performance Marketing Association's 2026 US Brand Survey, conducted between April and June among in-house managers, agencies and networks, found attribution practice has not caught up with the publisher mix it is trying to measure. Around 80% of respondents still rely primarily on last-click attribution, a model that structurally under-credits the content and influencer partners driving the research phase Impact.com's data shows lengthening.
The same survey found programs getting more selective rather than simply bigger: fewer allow toolbars, extensions or subnetworks than in 2024, and AI-influenced search content is now an explicit line item roughly a fifth of programs report investing in.
Advertiser satisfaction versus other channels
The IAB Australia Affiliate Marketing Industry Review, now in its fifth wave since 2020, surveyed 74 advertisers and agencies operating affiliate programs in March 2025. ROI and sales volume remain the top success metrics, and satisfaction with affiliate ROI is meaningfully higher than satisfaction with the channel programs are most often compared against.
| Channel | ROI satisfaction (advertisers using both) | Source |
|---|---|---|
| Affiliate and partnership marketing | 87% | IAB Australia 2025 |
| Retail media | 71% | IAB Australia 2025 |
Platform sprawl: running more than one network
Diversifying beyond a single network used to be an enterprise-only decision. The PMA's 2026 data shows that shifting fast: the share of businesses running multiple affiliate platforms jumped from just under 9% to nearly 20% year on year, more than doubling in a single survey cycle. A third of the industry, per IAB Australia, still says it is unprepared for the privacy legislation reforms that multi-platform tracking will have to survive.
The attribution gap last-click cannot see
Partnerize's 2026 Zero-Click Commerce Index, built on its VantagePoint tool, gives the clearest published estimate of how much affiliate-driven influence last-click reporting is actually missing. Its HaloIndex measures the ratio of publisher-driven influence inside Google AI Overviews to what traditional click-through attribution registers, across six US consumer categories - Luxury Fashion, Smart Wearables, Casual Apparel, Beauty and Personal Care, Data Storage and Consumer Audio. The average across those categories is 3.84x, meaning publisher-driven purchase influence running through AI Overviews occurs at nearly four times the rate last-click programs can measure or compensate for. The same report flags 1,056 total citation gaps, 47 of them critical, where a program's own content partners are influencing purchases without being credited at all.
| Zero-click attribution signal (Partnerize 2026) | Figure |
|---|---|
| Average HaloIndex across six categories | 3.84x |
| Total citation gaps identified | 1,056 |
| Critical-priority citation gaps | 47 |
| Categories measured | 6 (fashion, wearables, apparel, beauty, storage, audio) |
How the survey has tracked this industry since 2020
The IAB Australia review is now in its fifth wave, which makes its year-over-year sample sizes a useful gut check on how the industry's own confidence has moved as affiliate budgets scaled. Response counts have grown steadily even as the questions have stayed consistent, which is part of why its 87% ROI-satisfaction figure carries more weight than a single-year snapshot would.
| IAB Australia survey wave | Respondents (advertisers/agencies) | Focus |
|---|---|---|
| November 2020 | 130 | Baseline affiliate marketing adoption |
| December 2021 | 140 | Post-pandemic growth in program count |
| March 2023 | 94 | Attribution and tracking pressure |
| April 2024 | 95 | Retail media comparison introduced |
| March 2025 | 74 | Privacy legislation readiness, ROI satisfaction |
What an audit actually checks before you touch payouts
Every number on this page describes an average program. Before changing a live program's commission structure, the more useful exercise is comparing your own dashboard against each benchmark individually - a program can be above the referral-to-sale average and still below the commission-rate average, and the fix for each is different. A commission rate that sits well outside the 20%-30% cluster without a strategic reason is usually the first thing worth re-examining, followed by whichever partner tier (network, content, loyalty) is carrying a disproportionate share of transactions relative to its share of spend.
The order in which you check these matters. Start with the referral-to-sale conversion rate, because it is the number most likely to be quietly wrong if tracking has drifted - a program reporting well above 0.8% on paper often turns out to be double-counting cross-device journeys rather than genuinely outperforming the benchmark. Only once that number is trusted does it make sense to compare commission rate, payout consistency and partner-tier concentration against the ranges above.
Setting a realistic payout for a new program
Start from the 20%-30% commission band Rewardful documents as the industry cluster, not from a competitor's headline rate. Budget for a 0.8% referral-to-sale conversion rate as the baseline case, not the floor - most new programs launch below it before their top affiliates ramp. And plan the reporting stack around more than last-click from day one; retrofitting attribution after a program has already signed its first 50 partners is far more expensive than building it in from the start.
Our growth marketing practice builds affiliate and partner programs against exactly this kind of benchmark data, and our data and analytics team sets up attribution that survives a multi-network stack rather than defaulting to last-click.
Where to go next
If affiliate marketing is one channel in a broader paid and organic mix, our affiliate marketing statistics hub covers the wider channel landscape beyond network-level benchmarks. For a program that is underperforming these benchmarks specifically, talk to us before you cut the channel entirely - the 2026 data suggests most of the gap is measurement, not the channel itself.
Frequently Asked Questions
What is a good affiliate commission rate in 2026?
Rewardful's 2026 SaaS benchmark puts the average affiliate program manager's commission rate at 24.16%, with rates commonly clustering between 20% and 30% across the industry. The average payout per commission is USD 14.10, against an all-time average of USD 13.56. Rates outside that band are not wrong, but they should be a deliberate choice, not a default.
Why did affiliate clicks rise while conversion rates fell?
Impact.com's H1 2026 analysis of 2,319 North American brands found clicks up 6% year on year while conversion rate fell 12%, continuing a pattern its full-year 2025 report (2,368 brands) also recorded: clicks up 2%, conversions down 5%, conversion rate down 6%. Shoppers are clicking through more affiliate content to compare before buying, then converting later or elsewhere, which is a buyer-behavior shift, not a channel failure.
How many affiliates in a program actually drive revenue?
Not many. Rewardful reports that only 7.6% of affiliates in a typical SaaS program generate at least one referral, and just 1.28% generate at least one sale. Most of the program's revenue concentrates in a small top tier, which is why churn among your best few partners matters more than total roster size.
Is last-click attribution still the norm for affiliate reporting?
Yes. The Performance Marketing Association's 2026 US Brand Survey found roughly 80% of respondents still rely on last-click attribution, even as programs invest more in top-of-funnel content and influencer partners whose contribution that model structurally undercounts.
Should a brand run more than one affiliate network?
More brands are. The same PMA 2026 survey found the share of businesses running multiple affiliate platforms jumped from just under 9% to nearly 20% year on year, as programs diversify away from a single network's publisher mix and reporting blind spots.
Sources
Rewardful - State of SaaS Affiliate Programs Report 2026
Impact.com - Affiliate Benchmark 2025: Fewer Buys, Higher Order Value
Impact.com - H1 2026 Consumer Shopping Trends
IAB Australia - Affiliate Marketing Industry Review 2025
Performance Marketing Association - 2026 US Brand Survey Results
Partnerize - 2026 Zero-Click Commerce Index


