



Table of contents
U.S. digital advertising generated USD 294.6 billion in 2025, and Alphabet alone reported more in global advertising revenue than the entire industry's U.S. total the year before. This page separates the industry-wide number from what the individual sellers report in their own financial filings, because the two are measuring different things and get conflated constantly.
Key Takeaways
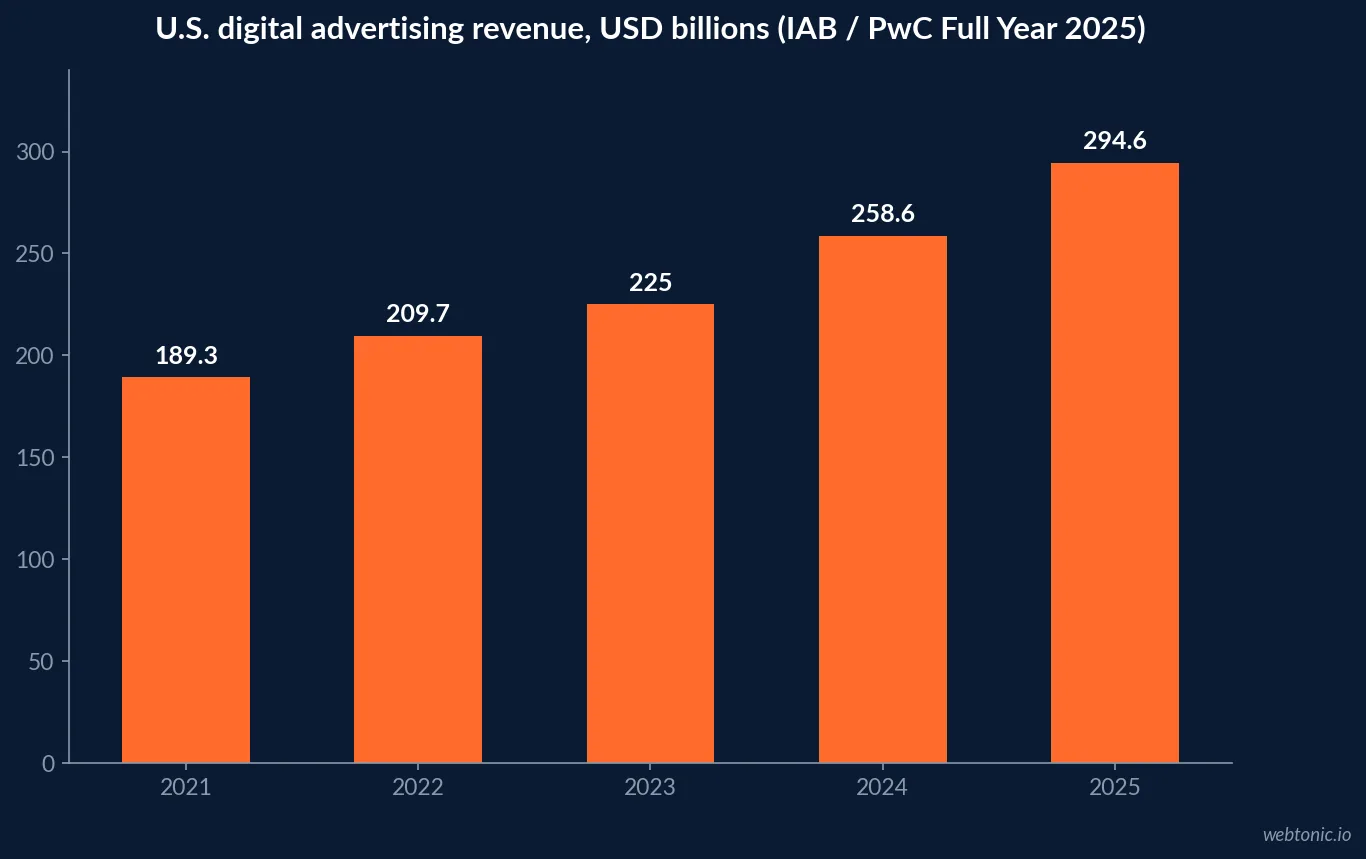
- U.S. digital advertising revenue reached USD 294.6 billion in 2025.
- That is a 13.9% increase over 2024's USD 258.6 billion.
- Revenue has grown every year since 2021's USD 189.3 billion.
- Q4 2025 alone added USD 11.3 billion in revenue, a 15.4% jump.
- Quarterly growth accelerated across all of 2025, from 12.2% in Q1 to 15.4% in Q4.
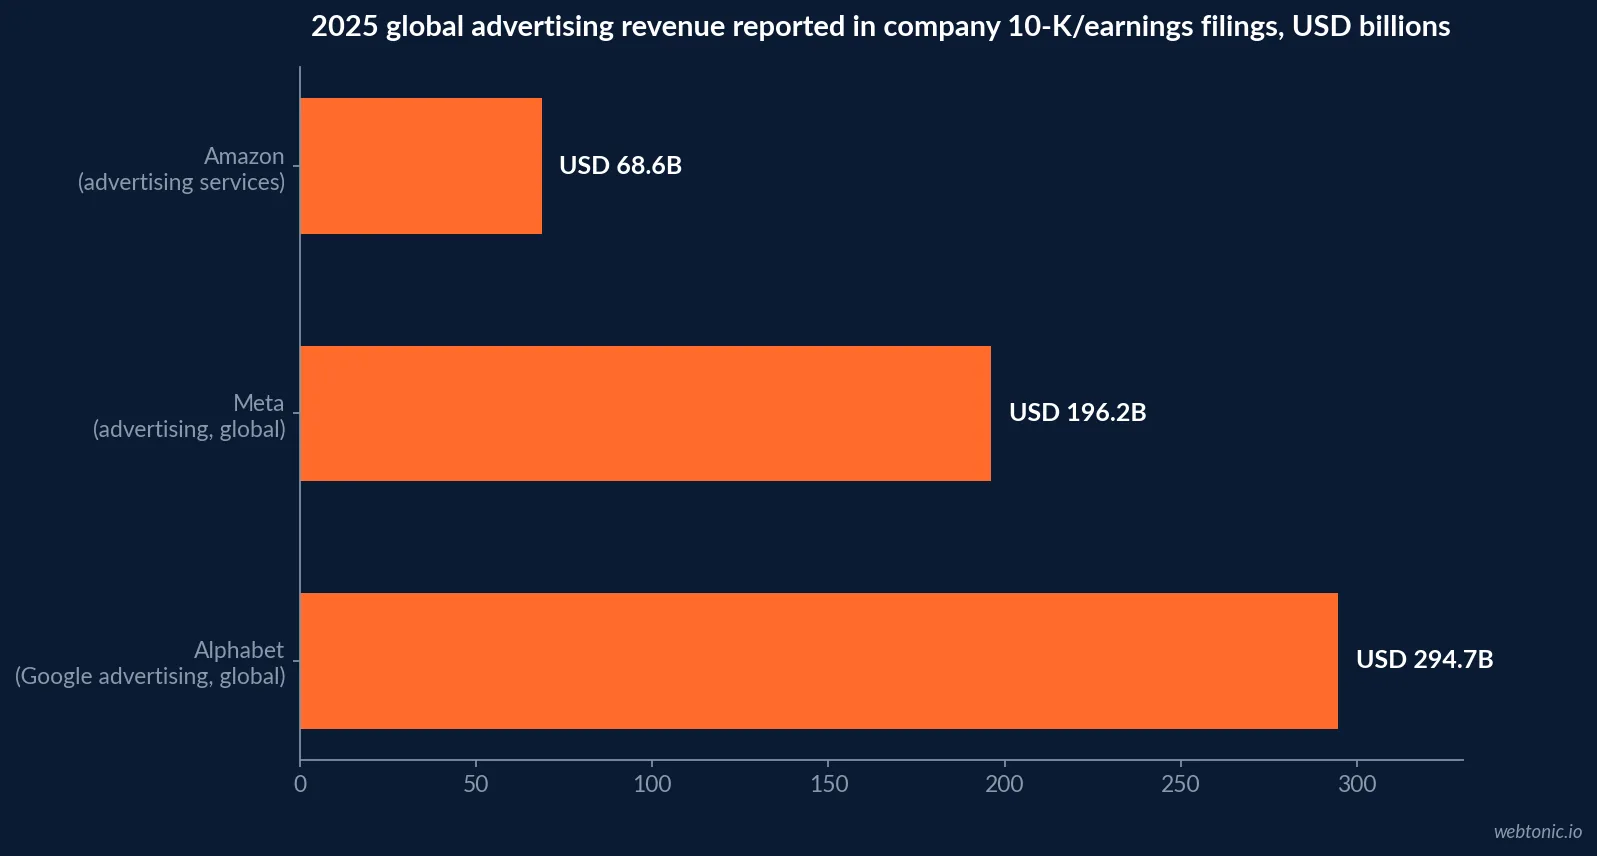
- Alphabet's global Google advertising revenue hit USD 294.691 billion in 2025.
- That is up from USD 264.590 billion in 2024, an 11.1% increase.
- Meta's global advertising revenue reached USD 196.175 billion in 2025.
- That is up from USD 160.633 billion in 2024, a 22.2% increase.
- Amazon's advertising services revenue hit USD 68.635 billion in 2025.
- Amazon's ad revenue has grown 46% in just two years, from USD 46.906 billion in 2023.
- The top 10 ad-selling companies hold 84.1% of U.S. digital ad revenue.
- That concentration is up from 76.8% in 2022.
- Social media advertising alone generated USD 117.7 billion in 2025.
- Programmatic advertising revenue reached USD 162.4 billion.
- Search still generates the largest single format share, at USD 114.2 billion.
The industry number: USD 294.6 billion, and still accelerating
The IAB/PwC Internet Advertising Revenue Report, now in its 30th year, is the industry's standing benchmark for what digital advertising actually generates in the United States. Full-year 2025 revenue reached USD 294.6 billion, a 13.9% increase year over year, and the highest figure recorded in the report's history, achieved in a year with none of the cyclical demand drivers, a U.S. presidential election or the Summer Olympics, that lifted 2024.
| Year | U.S. digital ad revenue (USD B) | YoY growth |
|---|---|---|
| 2021 | 189.3 | n/a |
| 2022 | 209.7 | +10.8% |
| 2023 | 225.0 | +7.3% |
| 2024 | 258.6 | +14.9% |
| 2025 | 294.6 | +13.9% |
The quarterly pace: back-half acceleration, and a USD 11.3 billion Q4
Digital ad revenue is seasonally back-weighted, and 2025 leaned into that pattern harder than most years. Growth accelerated every quarter: 12.2% in Q1, 12.8% in Q2, 14.9% in Q3 and 15.4% in Q4, when revenue expanded by USD 11.3 billion in three months. The slower first half reflected macroeconomic uncertainty, including U.S. tariff dynamics, that eased as the year progressed.
| Quarter | 2024 revenue (USD B) | 2025 revenue (USD B) | YoY growth |
|---|---|---|---|
| Q1 | 58.0 | 65.0 | +12.2% |
| Q2 | 62.1 | 70.0 | +12.8% |
| Q3 | 64.9 | 74.5 | +14.9% |
| Q4 | 73.7 | 85.0 | +15.4% |
The company numbers: what the largest sellers report in their own filings
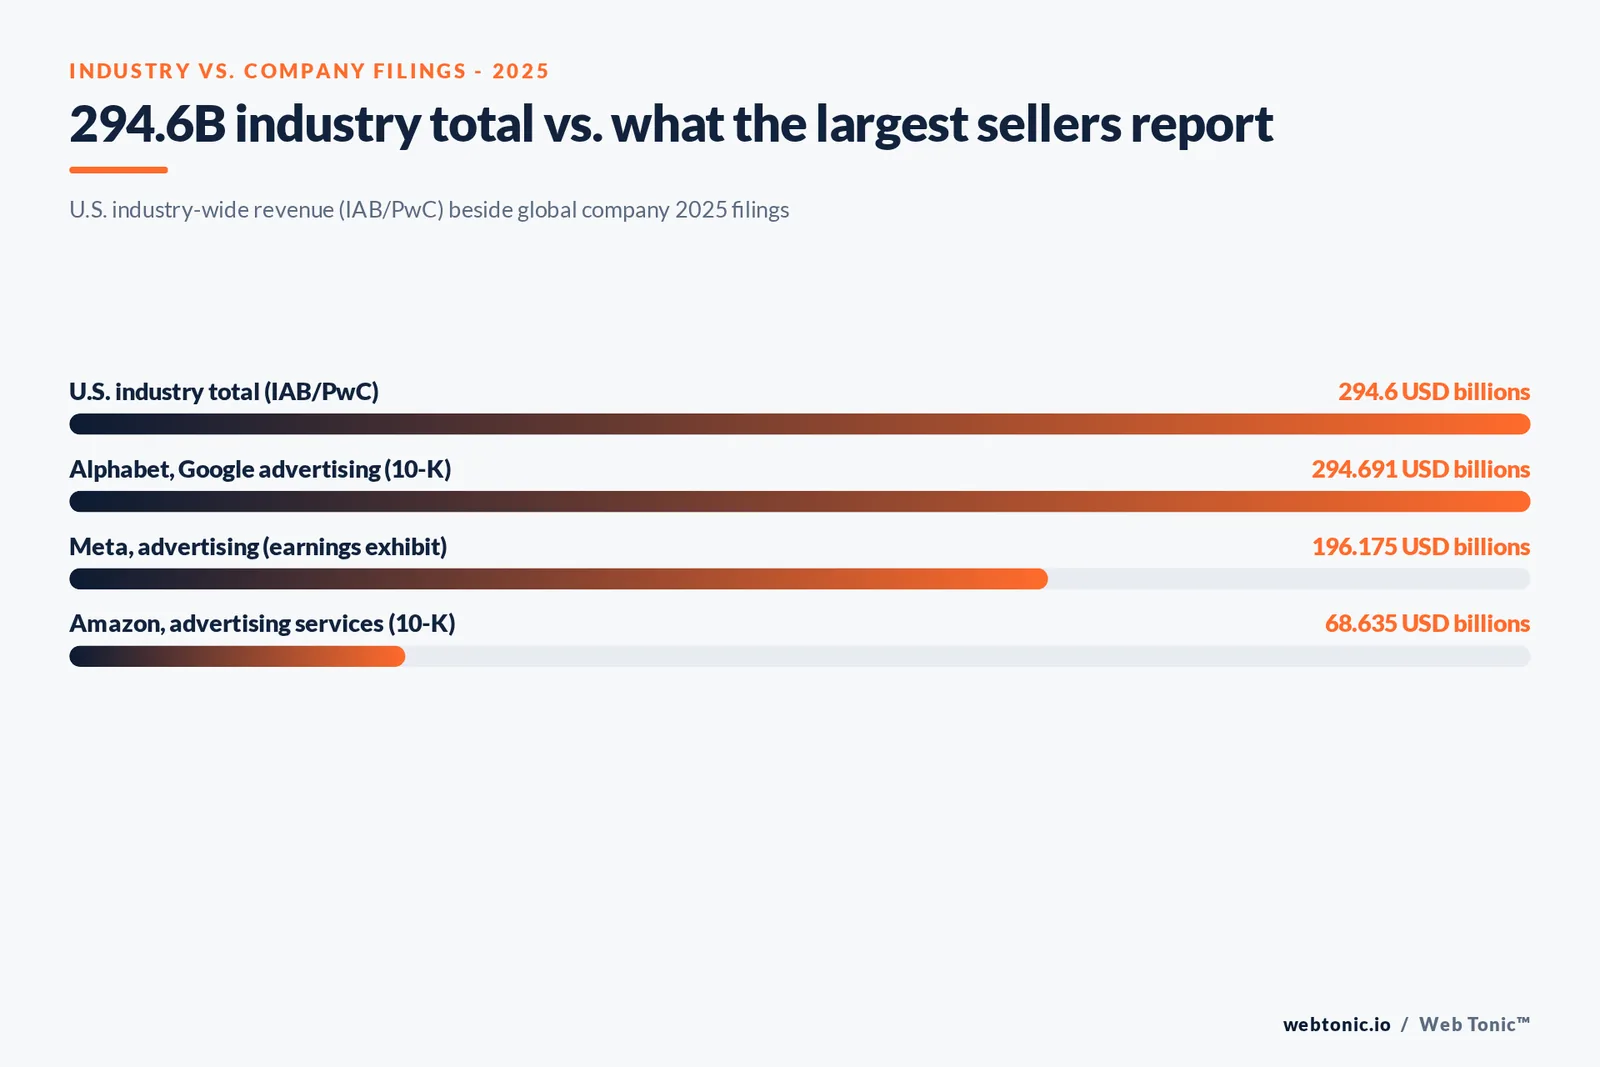
The industry total is a U.S.-market estimate compiled by PwC from data supplied by advertising sellers. It is a different measurement than what individual public companies report as global advertising revenue in their own SEC filings, and the two get conflated in casual reporting constantly. Read side by side, the scale concentrated in a handful of sellers becomes clear: Alphabet's 2025 Form 10-K reports USD 294.691 billion in global Google advertising revenue (Search, YouTube ads and Google Network combined), up 11.1% from USD 264.590 billion in 2024. Meta's fourth-quarter earnings exhibit reports USD 196.175 billion in 2025 advertising revenue, up 22.2% from USD 160.633 billion. Amazon's 2025 Form 10-K reports USD 68.635 billion in advertising services revenue, up from USD 56.214 billion the year before.
| Company | 2023 (USD B) | 2024 (USD B) | 2025 (USD B) | 2024-2025 growth |
|---|---|---|---|---|
| Alphabet (Google advertising, global) | 237.855 | 264.590 | 294.691 | +11.1% |
| Meta (advertising, global) | - | 160.633 | 196.175 | +22.2% |
| Amazon (advertising services, global) | 46.906 | 56.214 | 68.635 | +22.1% |
Where the industry revenue actually comes from, by format
Inside the USD 294.6 billion U.S. total, search still generates the largest single share at USD 114.2 billion (38.8%), though its growth has slowed to 11.0%. Programmatic buying, which cuts across formats rather than being one itself, generated USD 162.4 billion, up 20.5%. Social media advertising alone generated USD 117.7 billion, growing faster than search at 32.6%, and commerce media reached USD 63.4 billion, up 18.0%.
| Revenue source | 2025 revenue (USD B) | YoY growth | Share of industry total |
|---|---|---|---|
| Search | 114.2 | +11.0% | 38.8% |
| Programmatic (excl. search) | 162.4 | +20.5% | n/a (cuts across formats) |
| Social media | 117.7 | +32.6% | 40.0% |
| Digital video | 78.0 | +25.4% | 26.5% |
| Commerce media | 63.4 | +18.0% | 21.5% |
A fourth seller: retail media adds a new revenue pool
Ad revenue is no longer a two- or three-company story. AdExchanger's reporting on Walmart's own disclosures puts Walmart's global advertising revenue at USD 6.4 billion in 2025, with Walmart Connect advertising sales up 24% for the year, aided by 50% growth in marketplace seller advertiser counts. That is a fraction of Alphabet or Meta's scale, but it confirms that retail media, the commerce-media category IAB tracks at USD 63.4 billion industry-wide, is generating real, reportable revenue at individual retailers, not just at Amazon.
Retail media's growth also explains part of why revenue concentration (below) has not simply frozen around the two largest sellers: newer entrants like Walmart Connect are adding scale fast enough to matter, even if they remain outside the very top tier.
| Revenue pool | 2025 figure | YoY change | Source |
|---|---|---|---|
| Walmart, global advertising (Walmart Connect) | USD 6.4B | +24% (Walmart Connect) | AdExchanger, citing Walmart's own results |
| Amazon, advertising services | USD 68.635B | +22.1% | Amazon 10-K |
| Commerce media, U.S. industry-wide | USD 63.4B | +18.0% | IAB / PwC |
Revenue concentration: fewer companies keep more of the total
Both the industry total and the company filings point the same direction: revenue is concentrating. The top 10 companies selling internet advertising held 84.1% of U.S. digital ad revenue in 2025, up from 76.8% in 2022, while companies ranked 11-25 held 8.3% and everyone else split the remaining 7.5%. IAB attributes this to scaled platforms' deeper first-party data, integrated commerce ecosystems and end-to-end buying environments, the same structural advantages visible in Alphabet, Meta and Amazon's own revenue growth above.
| Company tier | 2022 share of U.S. revenue | 2025 share of U.S. revenue |
|---|---|---|
| Top 10 companies | 76.8% | 84.1% |
| Ranked 11-25 | 16.4% | 8.3% |
| Remaining companies | 6.8% | 7.5% |
The management layer riding on top of that revenue
Every dollar counted above still has to be planned, bought and reconciled by someone, and that layer is itself a growing cost. The Business Research Company sizes the global advertiser and ad campaign management software market at USD 18.11 billion in 2026, up 15.1% from USD 15.74 billion in 2025, growing roughly in step with the ad revenue it is built to manage. As the dollar totals above keep climbing, the tooling required to plan, trade and report on them is scaling right alongside, not as an afterthought line item.
That is worth naming explicitly because revenue growth at the platform level does not automatically make campaign management cheaper or simpler on the buy side. If anything, the faster the underlying revenue base grows, the more governance, reporting and reconciliation work scales with it, which is the software market's own growth curve in miniature.
Buyers are not gaining budget to manage that complexity, either. Gartner's CMO Spend Survey, via Chief Marketer, found martech's share of the marketing budget falling to a five-year low of 19.4%, down from 26.6% in 2021, even as the revenue those tools help manage keeps climbing. Revenue growth and management-budget growth are decoupling, which is the practical argument for treating software and headcount efficiency as its own line item rather than assuming it scales for free. A buyer benchmarking their own management overhead against these figures should expect the tooling and workforce side of the ledger to keep growing even in years the media budget itself holds flat, simply because the platforms generating that USD 294.6 billion keep adding inventory types, reporting requirements and measurement complexity for every dollar already in the plan.
What this means for a media budget
The industry total tells you the market is still growing at double digits with no sign of a ceiling. The company filings tell you where most of that growth is landing, and it is overwhelmingly the same three sellers whose platforms most media plans already run through. That makes diversification a deliberate decision, not a default one: our data and analytics practice can model what share of your own spend sits with the top 10 versus the long tail, and our roundup of Google Ads agencies covers who actually manages that spend well. See our conversion rate benchmark data for how this revenue growth is translating, or isn't, into results per dollar.
Frequently Asked Questions
How much does digital advertising generate in the United States?
USD 294.6 billion in 2025, according to the IAB/PwC Internet Advertising Revenue Report, the industry's benchmark study since 1996. That is a 13.9% increase over 2024's USD 258.6 billion, and the highest figure the 30-year-old report has ever recorded, achieved without a U.S. presidential election or Summer Olympics to inflate the year.
How much of that revenue goes to Google and Meta?
A large and growing share. Alphabet's own 10-K reports USD 294.691 billion in global Google advertising revenue for 2025, up from USD 264.590 billion in 2024. Meta reported USD 196.175 billion in global advertising revenue for 2025, up from USD 160.633 billion. Note these are global company totals, not directly comparable to IAB's U.S.-only industry figure, but they show the scale concentrated in two sellers.
Is digital ad revenue growth accelerating or slowing?
Accelerating through 2025. IAB/PwC data shows quarter-over-quarter growth climbing from 12.2% in Q1 to 12.8% in Q2, 14.9% in Q3 and 15.4% in Q4, when revenue expanded by USD 11.3 billion in a single quarter. That back-half acceleration is typical of digital advertising's seasonally back-weighted revenue pattern.
Is ad revenue concentrating in fewer companies?
Yes. The top 10 companies selling internet advertising held 84.1% of U.S. digital ad revenue in 2025, versus 76.8% in 2022, according to IAB/PwC. Companies ranked 11-25 and everyone else split the remaining 15.9%, both down from prior years, reflecting the advantage scaled platforms hold in first-party data and integrated buying.
How much revenue does Amazon generate from advertising specifically?
USD 68.635 billion in 2025, according to Amazon's own 10-K, up from USD 56.214 billion in 2024 and USD 46.906 billion in 2023. That makes advertising Amazon's fastest-growing major revenue line after AWS, and the clearest evidence that ad revenue is no longer a two-company story.
Sources
IAB / PwC - Internet Advertising Revenue Report: Full Year 2025
IAB / PwC - Internet Advertising Revenue Report, Full-Year 2025 (PDF)
Alphabet Inc. - Form 10-K, fiscal year 2025 (SEC EDGAR)
Meta Platforms, Inc. - Q4 and full-year 2025 earnings exhibit (SEC EDGAR)
Amazon.com, Inc. - Form 10-K, fiscal year 2025 (SEC EDGAR)
AdExchanger - Walmart's Ad Revenue Totaled USD 6.4 Billion in 2025
The Business Research Company - Advertiser (Ad) Campaign Management Software Global Market Report 2026
Chief Marketer - Gartner CMO Spend Survey: Budgets Reflect Increase in Consumption-Based Martech, Paid Media Spend


