



Table of contents
An advertising network's job is distribution, and in 2026 that distribution is radically uneven. A small number of networks carry the overwhelming majority of both mobile app placements and open-web budget, while the format and platform mix inside each network changes which placement actually earns the revenue. This page maps both layers with named 2026 studies.
Key Takeaways
- The global ad networks market is valued at USD 52 billion in 2026, projected to reach USD 102 billion by 2034.
- AppLovin holds 61.4% of iOS mobile ad revenue share, per GameBiz Consulting's 2026 research.
- On Android, AppLovin's share falls to 39.5%, with Google, Meta and Unity Ads behind it.
- AppLovin and Google AdMob together captured 65% of global mobile game ad revenue (Sensor Tower).
- Unity Ads' revenue share grew from 6.04% to 9.72% across one large publisher's inventory year over year.
- Google's Display Network reaches 2 million sites, videos and apps, per Google's own 2026 figure.
- Adding GDN to a Demand Gen campaign lifts ROI by an average of 9.5% (Google internal data).
- Walled gardens capture 70-80% of programmatic ad spend, per Redseer's 2026 analysis.
- The open ecosystem gets only 20-30% of that budget despite carrying 55-60% of user time.
- That imbalance has held stable for roughly five years through multiple rounds of regulatory scrutiny.
- Alphabet and Meta together generated approximately USD 500 billion in ad revenue in 2025.
- Rewarded video ads generate 46.4% of mobile network revenue from just 2.7% of impressions.
- Banners carry 92% of impressions but only 8.4% of revenue on the same inventory.
- English-speaking markets generate 65.1% of mobile ad network revenue from 44.8% of impressions.
- Only four networks had universal demand across all 15 apps studied: AppLovin, Unity Ads, Meta Audience Network and Google AdMob.
Sizing the network layer
An advertising network is the intermediary that aggregates inventory from many publishers or apps and sells it to advertisers as a single buyable pool, distinct from an exchange's auction mechanics. Verified Market Reports sizes the global ad networks market at USD 52 billion in 2026, projecting growth to USD 102 billion by 2034 at a 8.79% compound annual growth rate, with Google, Meta, Amazon Ads, TikTok Ads and InMobi named among the category's key players spanning both open-web and in-app distribution.
| Ad networks market metric | Figure | Detail |
|---|---|---|
| 2026 market size | USD 52 billion | Base year estimate |
| 2034 projected size | USD 102 billion | Forecast year |
| CAGR, 2026-2034 | 8.79% | — |
| Named key players | 20+ | Google, Meta, Amazon, TikTok, InMobi, Taboola and others |
Mobile in-app networks: a concentrated field
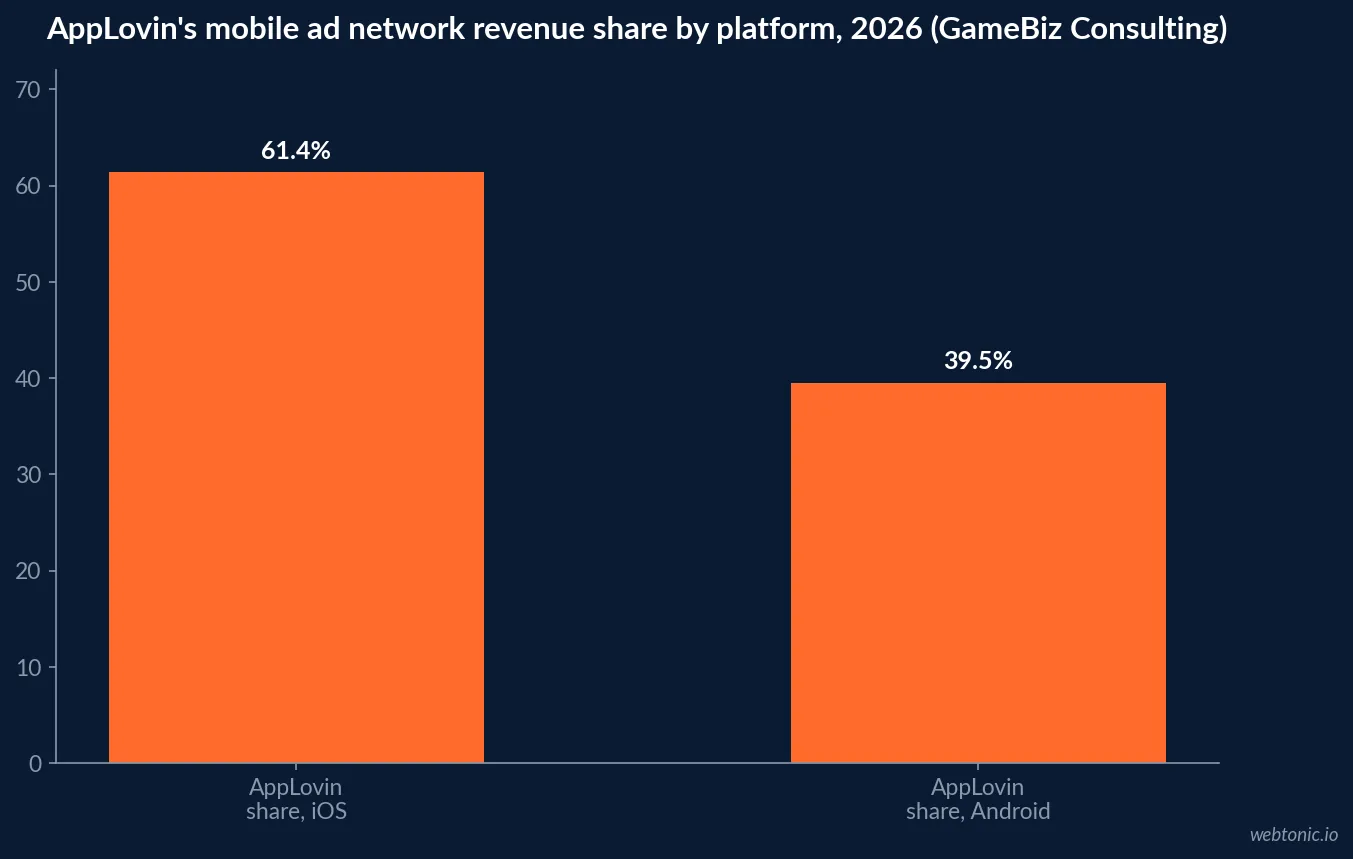
GameBiz Consulting's 2026 mobile network research, built from 15 portfolio apps mediated through Applovin MAX, found only four networks carried universal demand across every app studied: AppLovin, Unity Ads, Meta Audience Network and Google AdMob. Platform splits the leaderboard sharply. AppLovin holds 61.4% of iOS ad revenue share, well ahead of Google, Moloco and Mintegral. On Android the picture flattens: AppLovin takes 39.5%, followed by Google, Meta and Unity Ads in a more contested field. That platform split matters operationally: a network mix tuned to iOS economics will systematically under-perform if applied unchanged to an Android-majority user base, since the same network does not carry the same pricing power on both operating systems.
| Mobile network revenue share, 2026 | iOS | Android | Source |
|---|---|---|---|
| AppLovin | 61.4% | 39.5% | GameBiz Consulting |
| AppLovin + Google AdMob (combined, all platforms) | — | 65% (Jan 2025-May 2026) | Sensor Tower |
| Unity Ads (single large publisher, revenue share) | 9.72% (2026) | vs. 6.04% (2025) | GameBiz Consulting |
| Unity Ads (same publisher, impression share) | 4.91% (2026) | vs. 2.57% (2025) | GameBiz Consulting |
Format decides which network earns the revenue
Fill rate and revenue are not the same scoreboard inside a mobile network. GameBiz Consulting's portfolio data shows rewarded video generating 46.4% of ad revenue from just 2.7% of impressions, and interstitials generating 45.2% of revenue from 5.3% of impressions. Banners run the opposite way entirely: 92% of impressions produce only 8.4% of revenue. A network strategy optimized purely for fill rate would over-index on the format that earns the least per impression.
| Ad format (mobile network) | Share of revenue | Share of impressions | Revenue per impression |
|---|---|---|---|
| Rewarded video | 46.4% | 2.7% | Highest |
| Interstitials | 45.2% | 5.3% | High |
| Banners | 8.4% | 92.0% | Lowest |
| Regional distribution (mobile network) | Share of revenue | Share of impressions |
|---|---|---|
| English-speaking markets (US, UK, Canada, Australia, NZ) | 65.1% | 44.8% |
| Rest of world | 34.9% | 55.2% |
Google's Display Network: still the largest open-web footprint
On the open web, one network's reach still dwarfs the field. Google's own 2026 announcement puts the Google Display Network's reach at 2 million sites, videos and apps, and the company reports advertisers adding GDN placements to a Demand Gen campaign see an average 9.5% increase in ROI, citing a food delivery platform case that saw a 24% decrease in CPA and 19% higher conversion volume after adding GDN inventory. Structurally, Google is folding standalone GDN buying into Demand Gen campaign management, a placement-distribution shift expected to complete by 2027 rather than a reduction in the network's underlying reach.
The budget imbalance: open web time, walled garden dollars
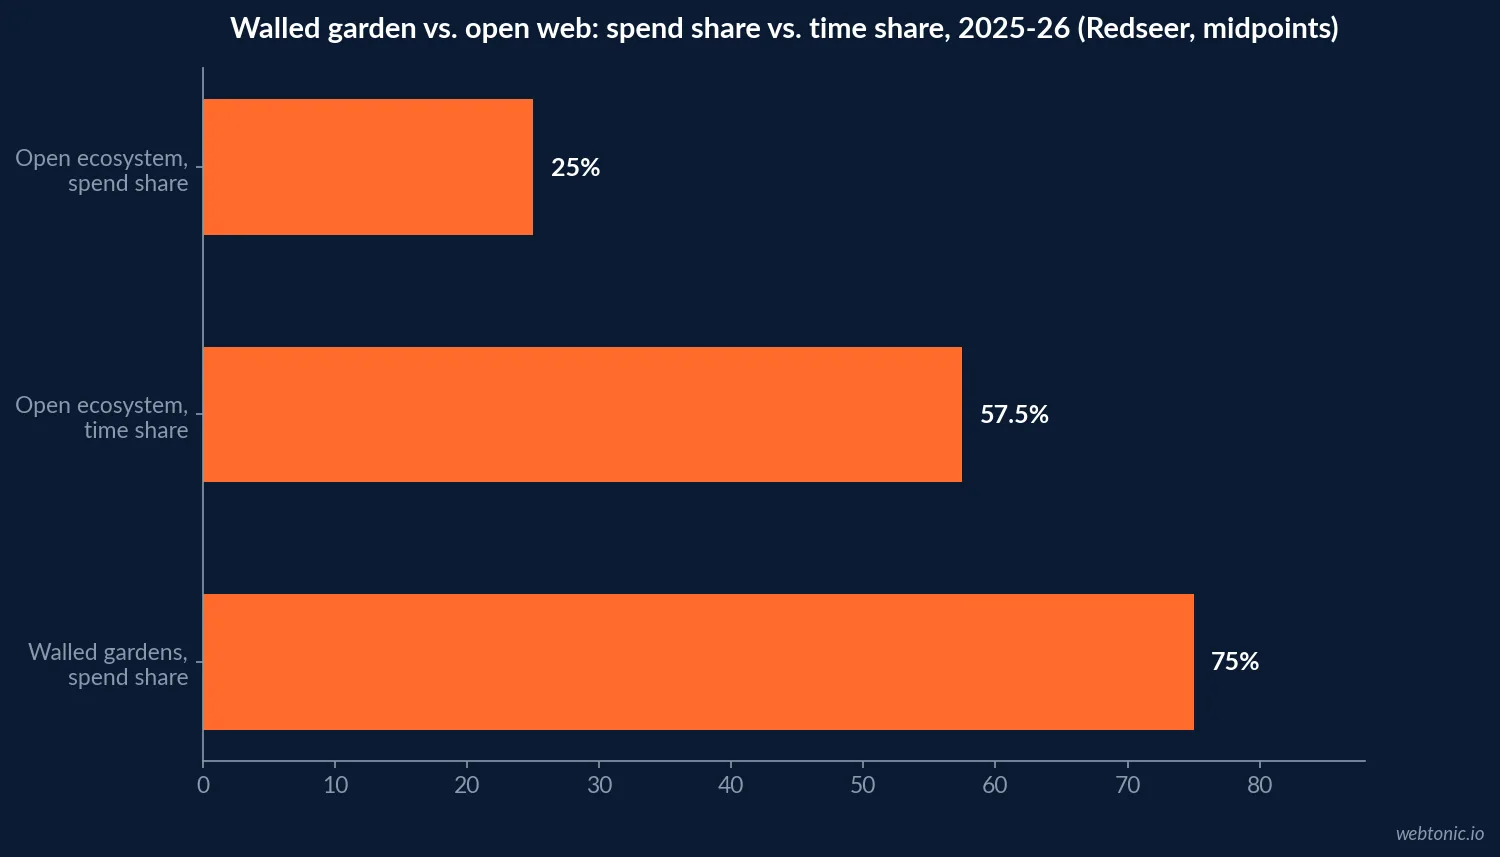
The starkest network-level statistic in 2026 is not about any single platform - it's about the structural split between two categories of network. Redseer's 2026 analysis found advertisers spend only 20-30% of their budgets on the open ecosystem even though users spend 55-60% of their time there, while walled gardens - platforms like Google, Meta and Amazon that sell advertising exclusively within their own properties - capture 70-80% of programmatic ad spend. Alphabet and Meta alone generated approximately USD 500 billion in combined advertising revenue in 2025. Redseer notes this gap has held stable for roughly five years and has survived multiple rounds of regulatory scrutiny without meaningfully shifting.
| Network category, 2025-2026 | Share of ad budgets | Share of user time | Source |
|---|---|---|---|
| Walled gardens (Google, Meta, Amazon, etc.) | 70-80% | 40-45% | Redseer |
| Open ecosystem / open web | 20-30% | 55-60% | Redseer |
| Alphabet + Meta combined ad revenue | ~USD 500 billion | — | Redseer |
Why the smaller networks still matter to a media plan
Concentration at the top of the network league table does not mean the smaller players are irrelevant to a placement strategy. GameBiz Consulting's same 2026 research flagged a second tier of networks - Chartboost, HyprMX, Ogury, PubMatic, Smaato and Verve Group - that carried little or no presence across the 15 apps studied, but for structurally different reasons: HyprMX and Ogury run brand-only demand that is strongest in Q4 and largely absent the rest of the year, while PubMatic, Smaato and Verve concentrate specifically on banner-format traffic rather than the higher-revenue rewarded video and interstitial formats. A placement plan that dismisses these networks year-round based on Q1 data would miss the seasonal brand budgets that only show up in the fourth quarter.
Unity Ads is the clearest example of a mid-tier network gaining ground rather than losing it. GameBiz Consulting's client-level data shows Unity's revenue share climbing from 6.04% in the first five months of 2025 to 9.72% over the same window in 2026 - more than 50% growth in share, even though it remains far behind AppLovin's dominant position. Its share of impressions grew from 2.57% to 4.91% across the same comparison, following Unity's 2026 launch of its AI-powered Vector ad platform.
| Mid-tier and seasonal networks, 2026 | Behaviour pattern | Source |
|---|---|---|
| HyprMX, Ogury | Brand-only demand, strongest in Q4 | GameBiz Consulting |
| PubMatic, Smaato, Verve Group | Concentrate on banner-format traffic | GameBiz Consulting |
| Unity Ads | Revenue share up from 6.04% to 9.72% YoY | GameBiz Consulting |
| Chartboost | Weak performance despite 2024 LoopMe acquisition | GameBiz Consulting |
What the placement data means for network selection
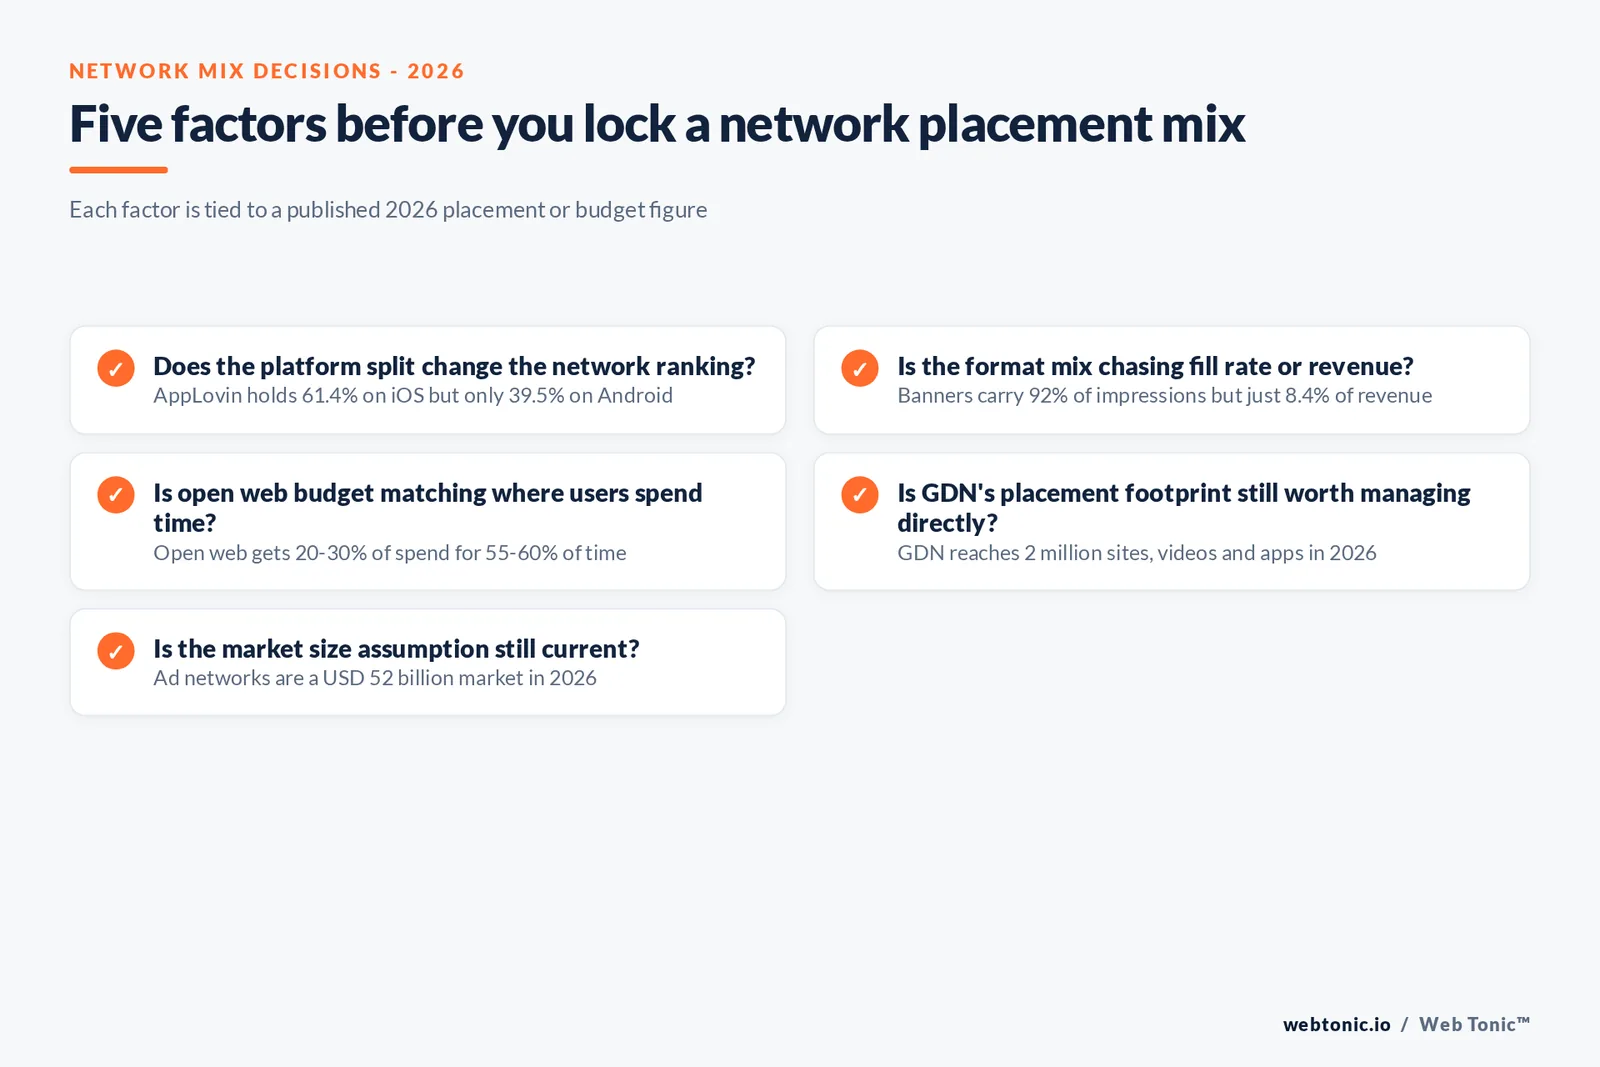
Three practical conclusions follow from this data. First, mobile in-app buying decisions should be platform-specific: an AppLovin-first strategy that works on iOS at 61.4% share does not translate directly to Android's more contested 39.5% field. Second, format allocation inside a network should chase revenue per impression, not fill rate - the banner category proves those two metrics can point in opposite directions. Third, the open web versus walled garden split is a budget-allocation decision that has stayed remarkably stable for five years; treating it as a temporary anomaly to wait out has not been supported by the data so far. A network mix plan built for 2027 should assume the current split persists rather than betting on a near-term correction, and should size open-web and walled-garden budgets accordingly rather than symmetrically. Our growth marketing team builds network mix plans against exactly this kind of platform-by-platform data, our Meta Ads management team handles walled-garden network buying directly, and our Google Display Network guide covers GDN's placement targeting controls in more depth for teams weighing open-web network spend.
Frequently Asked Questions
How big is the global ad networks market?
Verified Market Reports sizes the global ad networks market at USD 52 billion in 2026, projecting growth to USD 102 billion by 2034 at a compound annual growth rate of 8.79%. That is a narrower category than the full adtech market - it isolates network intermediaries specifically, rather than exchanges, DSPs and measurement tooling combined.
Which network carries the most mobile app ad placements?
AppLovin leads by a wide margin on iOS, capturing 61.4% of ad revenue share according to GameBiz Consulting's 2026 mobile network research, with Google, Meta and Unity Ads well behind. On Android the field is more contested: AppLovin holds 39.5% followed by Google, Meta and Unity Ads. Sensor Tower's broader study found AppLovin and Google AdMob together captured 65% of global mobile game ad revenue between January 2025 and May 2026.
Do open-web networks get a fair share of ad budgets relative to the audience they reach?
No, and the gap is large and persistent. Redseer's 2026 analysis found the open ecosystem attracts only 20-30% of programmatic ad budgets even though users spend 55-60% of their time there, while walled gardens - Google, Meta, Amazon and similar closed platforms - capture 70-80% of programmatic spend. That imbalance has held for roughly five years despite regulatory scrutiny.
Is Google's Display Network still a meaningful placement source?
Yes, though its structure is changing. Google's own 2026 announcement puts GDN's reach at 2 million sites, videos and apps, and the company is folding GDN management directly into Demand Gen campaigns, citing an average 9.5% ROI increase for advertisers who add GDN placements to a Demand Gen campaign. The network still exists; the buying interface around it is being consolidated.
How does ad format affect which network dominates a given placement?
Heavily. GameBiz Consulting's 2026 portfolio research across 15 mobile apps found rewarded video generated 46.4% of ad revenue from just 2.7% of impressions, interstitials generated 45.2% of revenue from 5.3% of impressions, and banners generated only 8.4% of revenue despite carrying 92% of impressions - meaning the network mix that maximizes fill rate is not the same mix that maximizes revenue per impression.
Sources
Verified Market Reports - Global Ad Networks Market Size, Share, Industry Growth and Forecast 2026-2034
GameBiz Consulting - The State of Mobile Ad Networks in 2026
Sensor Tower (via GameDev Reports) - Mobile Game Ad Monetization in 2026
Google - Google Display Ads is migrating to Demand Gen
Redseer - Walled Gardens vs Open Internet: The $1T Digital Ad Mismatch


