



Table of contents
USPS's own Household Mail Survey found existing customers read 64% of the advertising mail sent to them, versus 36% for prospects with no prior relationship. This page sets that reading and response data, plus the actual 2026 per-piece postage cost, next to published email benchmarks so "mail vs. email" is a real cost-and-response comparison instead of a preference argument.
Key Takeaways
- Advertising mail is 62% of all household mail, the largest single category.
- Households received or sent 393 pieces of advertising mail in FY2025.
- 64% of advertising mail to existing customers gets read.
- 25% of existing customers say they are very likely to respond.
- Prospects read only 36% of advertising mail sent to them.
- Just 3% of prospects say they are very likely to respond.
- Average email open rate across industries is 35.63%, per Mailchimp's 2026 data.
- Average email click rate is 2.62%, and click-to-open falls further from there.
- USPS Marketing Mail letters cost USD 0.244 to USD 0.433 per piece depending on presort.
- Total household mail volume fell 39% between 2015 and 2025.
- Package volume grew 29% over the same decade, the only category to expand.
- USPS Marketing Mail revenue reached USD 15.734 billion in fiscal 2025.
- That is up 2.3% even as piece volume fell 1.3%.
- Electronic bill payment now covers 77% of household bills, up from 31% by mail in 2015.
- Only 14% of household bills are still paid by mail, down from 31% in 2015.
The mailbox, by the numbers: advertising is still the largest category
The USPS Household Mail Survey, conducted every year since 1987 and filed with the Postal Regulatory Commission, is the government's own measurement of what actually lands in U.S. mailboxes. In fiscal year 2025, households received or sent an average of 637 total mail pieces, and 393 of those, 62%, were advertising mail, more than correspondence, transactions, periodicals and packages combined.
| Mail market | Pieces per household, FY2025 | Share of total household mail |
|---|---|---|
| Advertising | 393.0 | 62% |
| Correspondence | 98.6 | 15% |
| Transactions | 93.7 | 15% |
| Packages | 41.5 | 7% |
| Periodicals | 21.9 | 3% |
| Other | 5.9 | 1% |
Who actually reads it: existing customers, far more than prospects
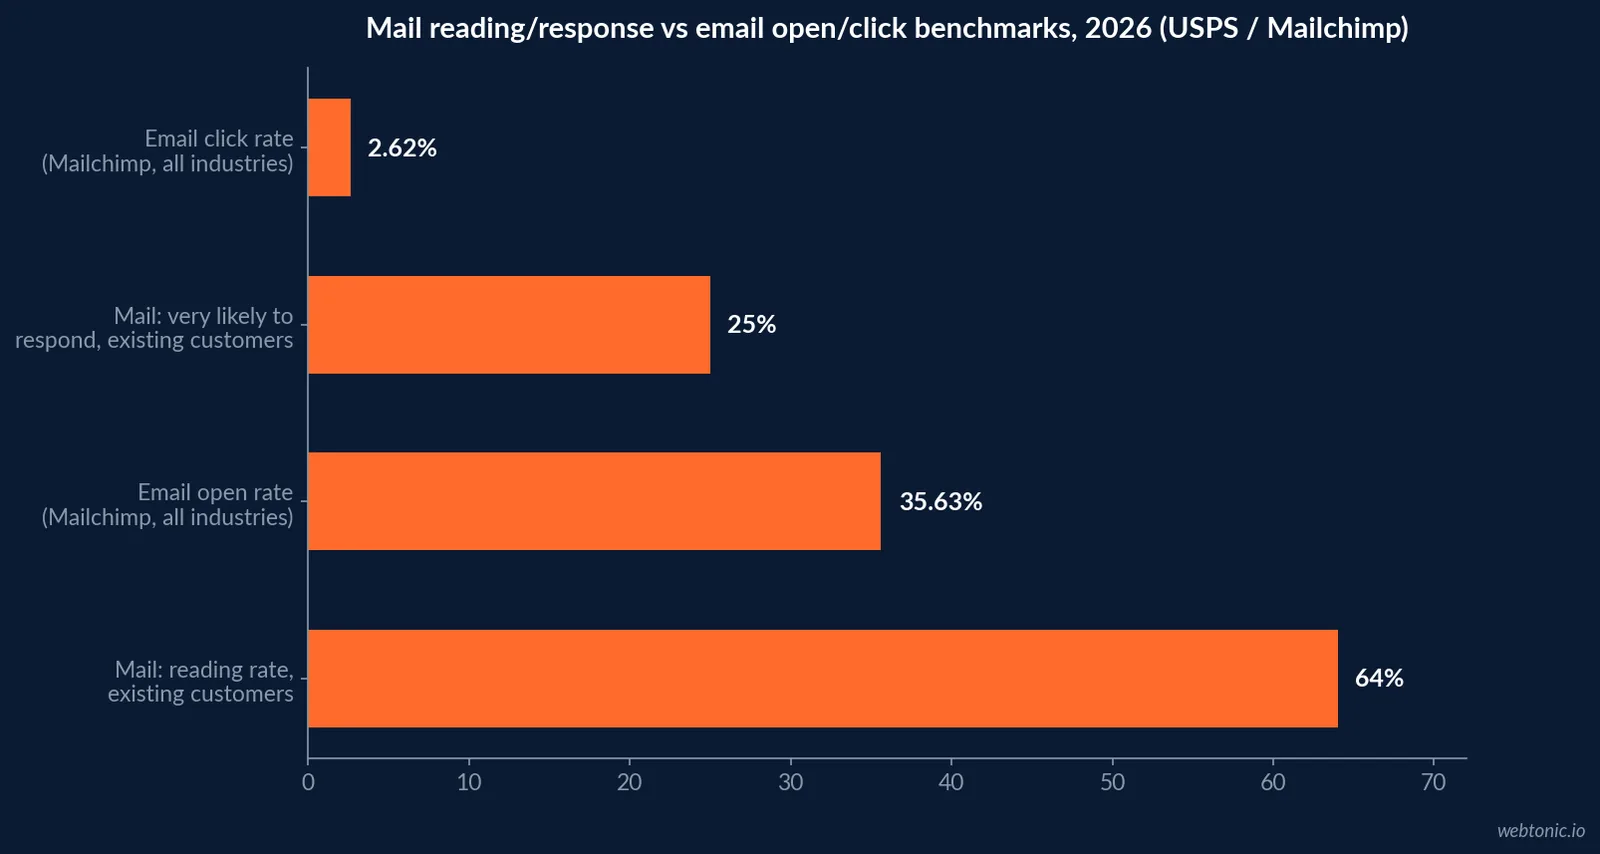
USPS measures reading and response likelihood by asking recipients to rank each piece of mail from 1 to 10 on how likely they are to respond, with an 8 or above defined as "very likely." The gap between existing customers and cold prospects is the single most useful number in the whole survey: 64% of advertising mail to existing customers gets read, and 25% of those recipients say they are very likely to respond. For prospects with no prior relationship, reading falls to 36% and very-likely-to-respond falls to just 3%.
| Recipient type | Reading rate | Very likely to respond | Implication |
|---|---|---|---|
| Existing customers | 64% | 25% | Mail performs best as a retention/reactivation channel |
| Prospects (no relationship) | 36% | 3% | Cold acquisition mail needs list quality to work |
| All recipients (blended) | 50% | 13% | Blended figures understate the retention/acquisition gap |
How that stacks against email: two different signals, not one scoreboard
Direct comparisons between a mail "response rate" and an email "open rate" mislead because they measure different moments in the funnel at a very different cost per attempt. Mailchimp's 2026 benchmark data, drawn from its own send volume, puts the average open rate across all industries at 35.63% and the average click rate at just 2.62%, with wide variation by sector: non-profits open at 40.04% while ecommerce sends open at only 29.81%.
Mail's 25% "very likely to respond" signal among existing customers sits inside a narrower, costlier funnel: every piece cost real postage to send, so the recipients counted already survived a list-quality and budget filter email sends do not require. Reading the two side by side is useful for planning frequency and channel mix, not for declaring a single winner.
| Channel | Top-of-funnel signal | 2026 benchmark | Source |
|---|---|---|---|
| Advertising mail | Reading rate, existing customers | 64% | USPS Household Mail Survey |
| Advertising mail | Very likely to respond, existing customers | 25% | USPS Household Mail Survey |
| Average open rate, all industries | 35.63% | Mailchimp | |
| Average click rate, all industries | 2.62% | Mailchimp | |
| Highest-performing sector open rate | 40.04% (non-profits) | Mailchimp |
How email's own numbers are trending, for context
Email benchmarks are not static either, and the direction matters for the channel-mix decision as much as the level. The DMA UK's Email Benchmarking Report 2025, built from a record volume of emails sent in 2024, found delivery rates rising to 98% (99.2% for B2C senders), open rates climbing to 35.9% as the industry adjusts to Apple's Mail Privacy Protection, and unique click rates rising for a third consecutive year. Both channels, in other words, are improving their own numbers year over year; neither is a fixed baseline to plan against indefinitely.
What a piece of mail actually costs to send in 2026
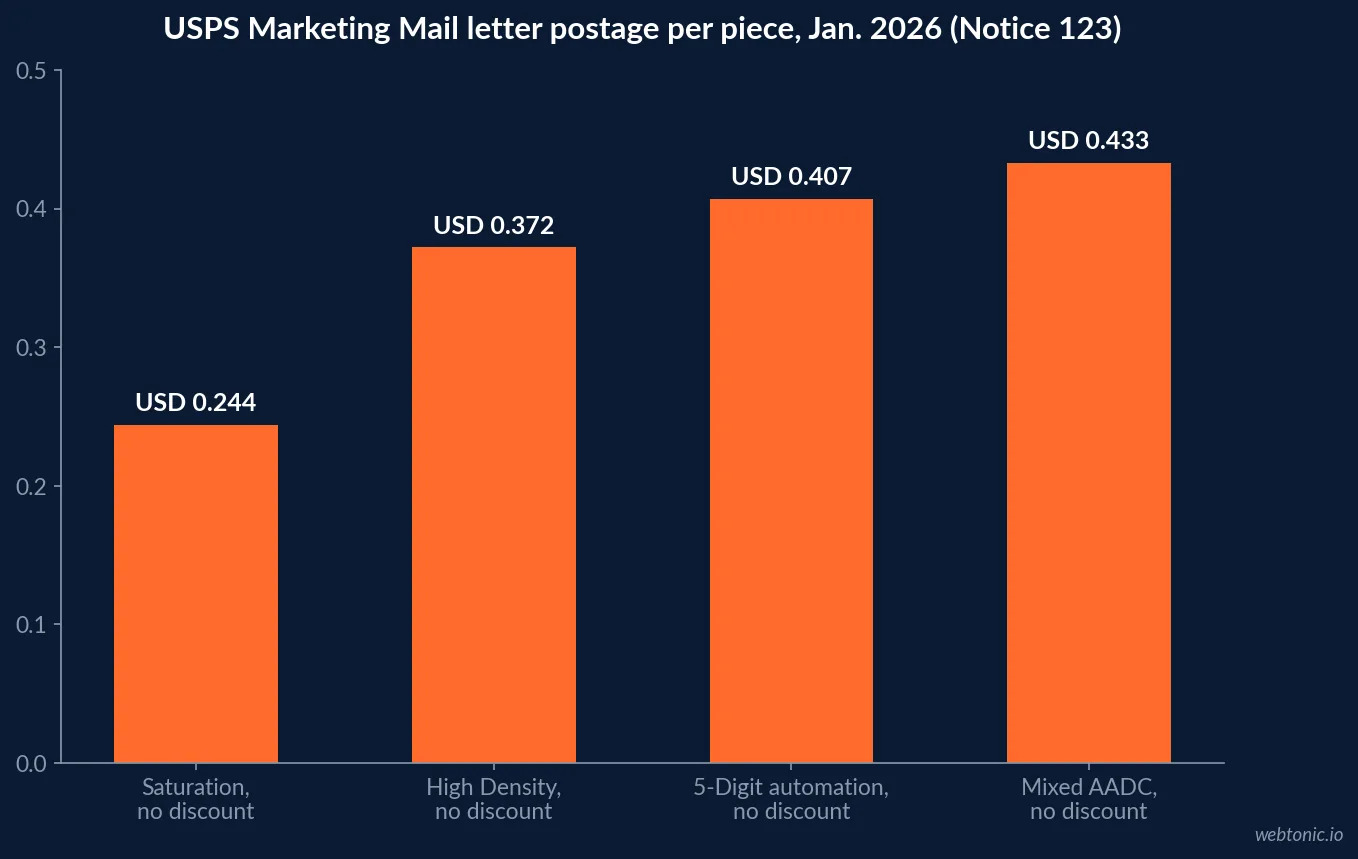
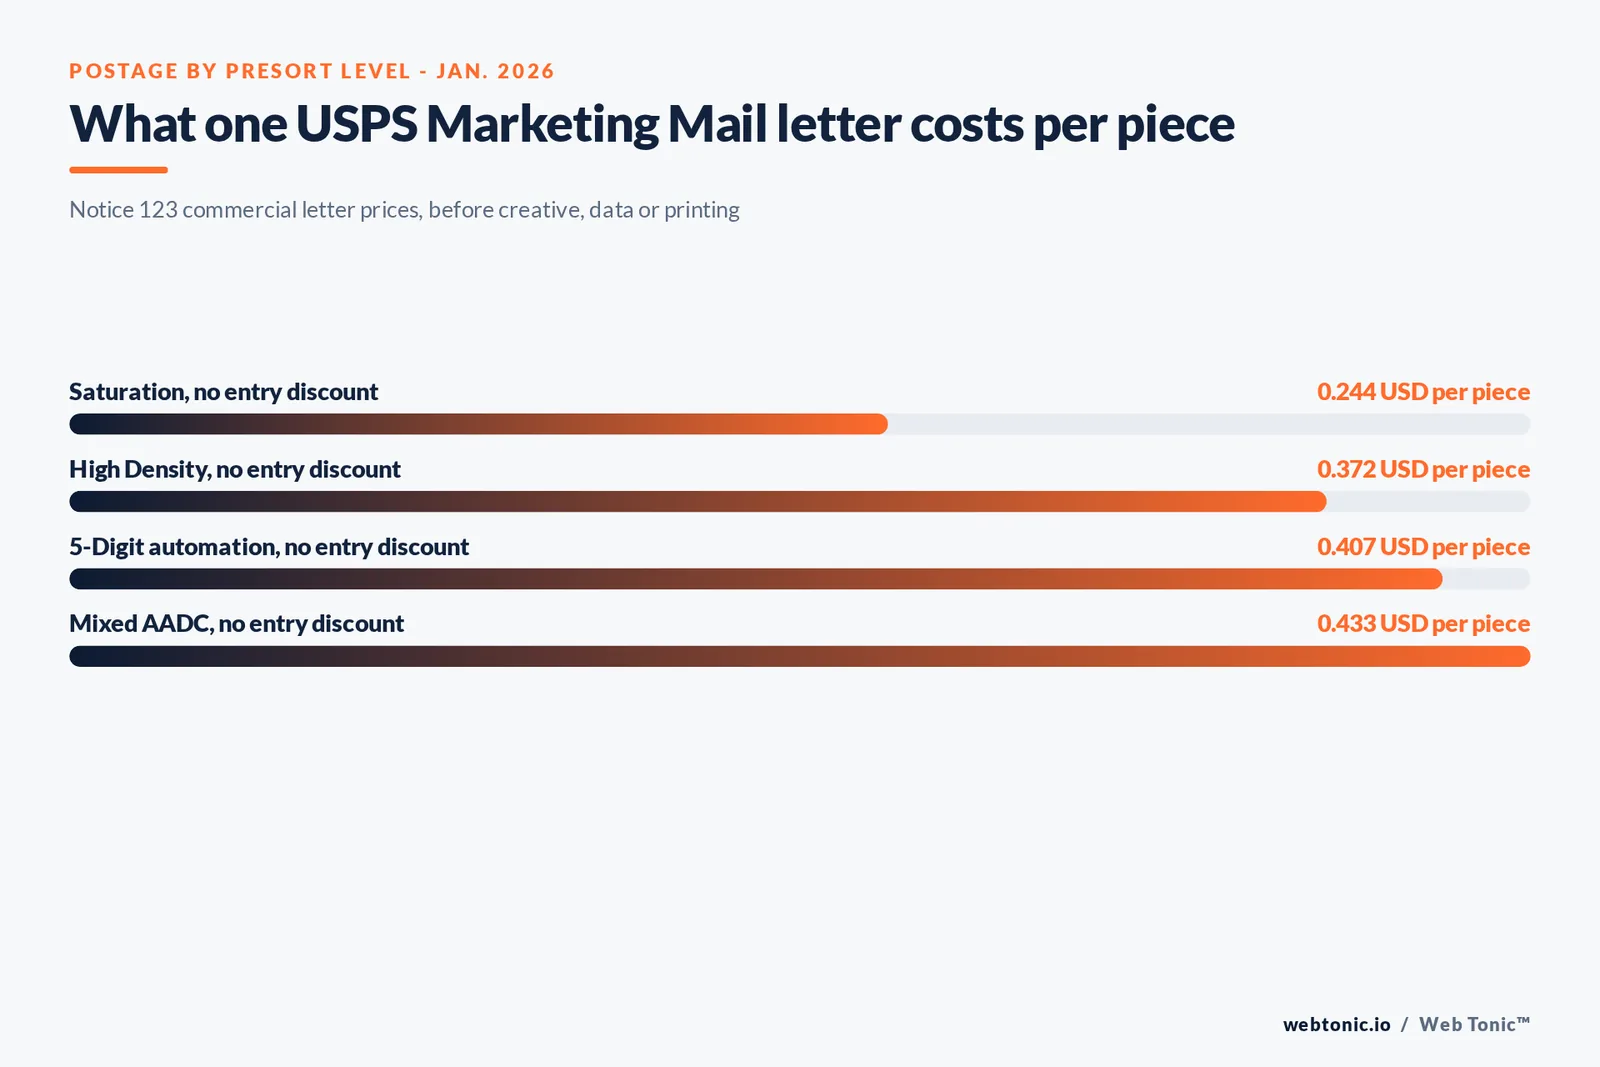
Postage is the one line email does not have, and it varies more than most planners assume. Per USPS Notice 123, the official commercial price list effective January 2026, a standard automation USPS Marketing Mail letter (3.5 oz. or less) prices from USD 0.244 per piece at the deepest saturation/high-density discount up to USD 0.433 per piece at the "Mixed AADC" entry level with no discount, before creative, data and printing costs are added on top.
| USPS Marketing Mail letter tier (Jan. 2026) | Per-piece price | What earns the discount |
|---|---|---|
| Saturation, no entry discount | USD 0.244 | Mailing to nearly every address on a route |
| High Density, no entry discount | USD 0.372 | Dense coverage of a smaller carrier route |
| 5-Digit automation, no entry discount | USD 0.407 | Full ZIP+4 sortation, automation-compliant |
| Mixed AADC, no entry discount | USD 0.433 | Minimal sortation, standard automation letter |
The volume and revenue trend: smaller mailbox, still a real market
USPS's fiscal year 2025 results report Marketing Mail revenue of USD 15.734 billion, up 2.3% even as piece volume fell 1.3% to 56.756 billion pieces, meaning average revenue per piece rose. Zooming out a decade, total household mail volume fell 39%, from 1,041 pieces per household in 2015 to 637 in 2025, but advertising mail specifically declined a smaller 40% and packages, the only category to grow, rose 29% over the same period.
| Metric | 2015 | 2020 | 2025 | 10-yr change |
|---|---|---|---|---|
| Advertising mail (pieces/household/year) | 658.9 | 502.9 | 393.0 | -40% |
| Total household mail (pieces/household/year) | 1,040.6 | 839.0 | 637.3 | -39% |
| Packages (pieces/household/year) | 32.1 | 47.0 | 41.5 | +29% |
| Household bills paid by mail | 31% | 21% | 14% | -17 pts |
The frequency trade-off behind both channels
The reading-rate and postage numbers above are static snapshots, but the real planning question is frequency: how many times a given household or inbox can be reached before a channel's own numbers start to erode. USPS's data shows advertising mail volume falling from 658.9 pieces per household in 2015 to 393.0 in 2025, a structural decline that makes each remaining piece slightly more likely to be read simply because there is less competition for attention in the mailbox than there used to be. Email volume has moved the opposite way, rising for years, which is part of why open rates needed Apple's Mail Privacy Protection era to reset expectations before climbing back toward 35.9% in the DMA UK data above. Neither trend is permanent, and a channel mix built on last year's frequency assumptions is worth revisiting at least annually.
Cost per attempt tells the same story from the other direction. A saturation-level USPS Marketing Mail letter at USD 0.244 per piece costs roughly two orders of magnitude more per contact than an email send, which is exactly why mail's response signal has to clear a much higher bar to be worth the budget: every piece sent to a low-propensity prospect is a real, sunk cost in a way an email to the same prospect simply is not.
How to plan a mail-vs-email budget split
Use mail where the reading-rate gap is largest, existing customers and past purchasers, and budget the real per-piece postage, not a rough estimate, since the spread between saturation and standard automation pricing alone is nearly 80%. Use email where reach and frequency matter more than per-contact response strength, and where the near-zero marginal cost tolerates far more volume. Our growth marketing team models the blended channel mix against your own customer file, and our roundup of email marketing agencies covers who executes the email side well. See our deeper email benchmark data for the platform-level detail, or talk to us about testing both channels against the same list.
Frequently Asked Questions
What share of household mail is advertising mail?
62%. The USPS Household Mail Survey for fiscal year 2025 found households received or sent an average of 393 pieces of advertising mail out of 637 total mail pieces per year, more than correspondence, transactions, periodicals and packages combined. Advertising mail is still the largest single category the Postal Service delivers to homes, even as total volume keeps declining.
Does anyone actually read advertising mail?
Most of it, when the recipient already has a relationship with the sender. USPS's FY2025 survey found existing customers read 64% of the marketing mail addressed to them, and 25% say they are very likely to respond. Prospects, with no prior relationship, read only 36% and 3% say they are very likely to respond, which is the clearest evidence that mail performs as a retention channel first and an acquisition channel second.
How does a mail response rate compare with an email open rate?
They measure different things, which is exactly why the two get confused. USPS records a 25% 'very likely to respond' rate for existing customers on mail with a physical, weighted rank scale, while Mailchimp's 2026 benchmark data puts the average email open rate at 35.63% across all industries and click rate at 2.62%. Higher email open rates reflect a near-zero cost per attempt; mail's response signal is stronger per piece precisely because each piece costs real postage.
How much does a single piece of advertising mail actually cost to send?
It depends entirely on presort and automation level. USPS's Notice 123 price list effective January 2026 prices commercial USPS Marketing Mail letters from USD 0.244 per piece at the deepest saturation discount up to USD 0.433 per piece for a standard automation Mixed AADC mailing, before creative, list and printing costs are added.
Is mail volume still declining in 2026?
Yes, but the decline is slowing and packages are growing. Total household mail fell from 1,041 pieces per household in 2015 to 637 pieces in 2025, a 39% decline, driven mostly by correspondence and transaction mail migrating online. Advertising mail volume fell a smaller 40% over the same decade, and package volume actually grew 29%, the only major category to expand.
Sources
USPS - Household Mail Survey (official overview)
USPS / RCF Economic & Financial Consulting - The Household Mail Survey: Mail Use & Attitudes, FY2025 (filed with the Postal Regulatory Commission)
USPS - U.S. Postal Service Reports Fiscal Year 2025 Results
USPS - Notice 123, Price List (Postal Explorer)
Mailchimp - Email Marketing Benchmarks & Industry Statistics
DMA UK - Email Benchmarking Report 2025


