



Table of contents

Inventory volume is not the constraint in 2026 - inventory quality is. Publishers and platforms have never had more ad slots to sell, from a USD 81.6 billion display market to 19 billion quarterly programmatic transactions on connected TV alone. The open question for buyers is how much of that supply is worth bidding on, and the data below prices the gap using named 2026 studies rather than an aggregate estimate.
Key Takeaways
- Total 2025 U.S. digital ad revenue reached USD 294.6 billion, up 13.9% year over year.
- Display inventory alone was worth USD 81.6 billion, up 9.8% year over year.
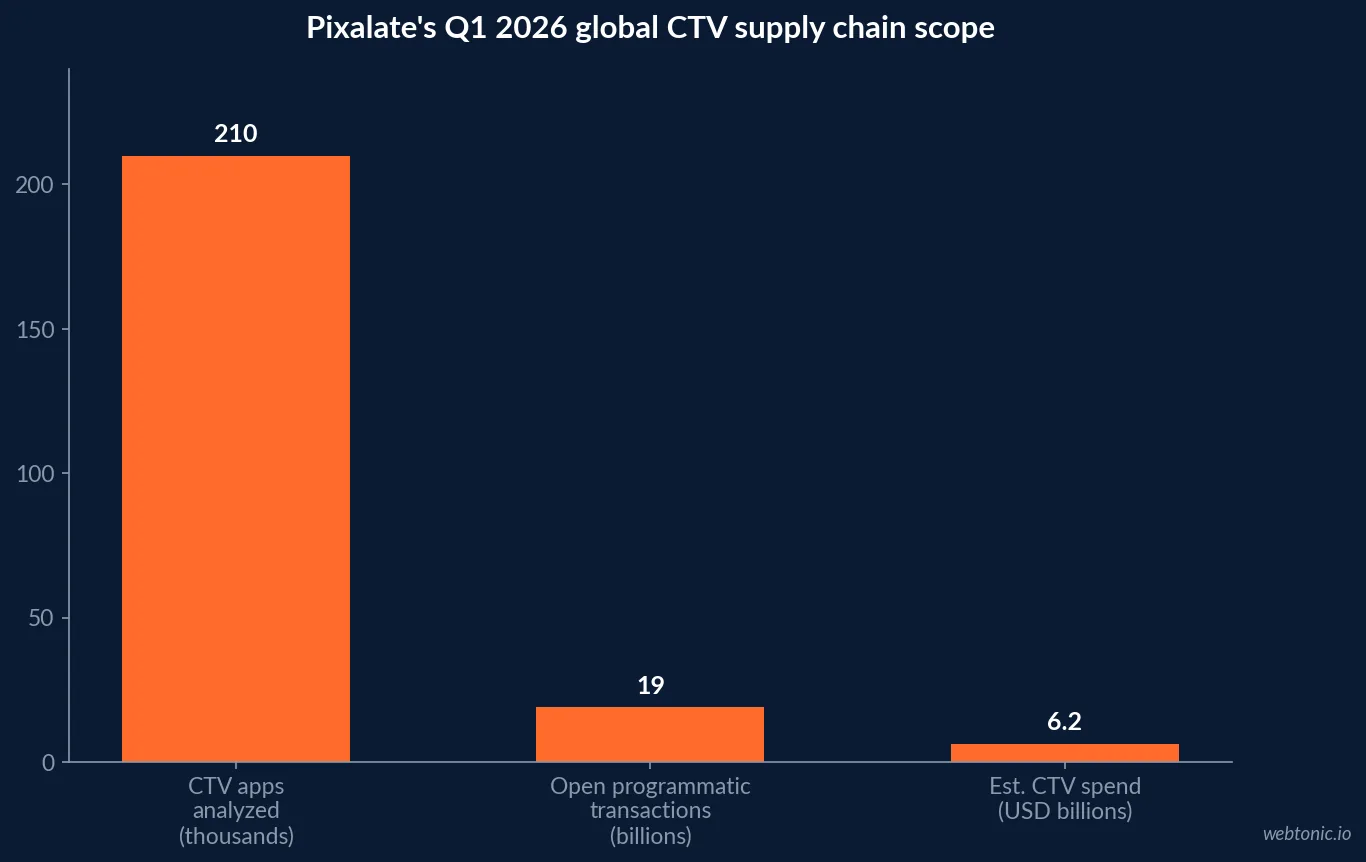
- Pixalate analyzed over 210,000 CTV apps in its Q1 2026 global supply chain report.
- That analysis covered 19 billion global open programmatic ad transactions in a single quarter.
- Global open programmatic CTV spend reached roughly USD 6.2 billion in Q1 2026.
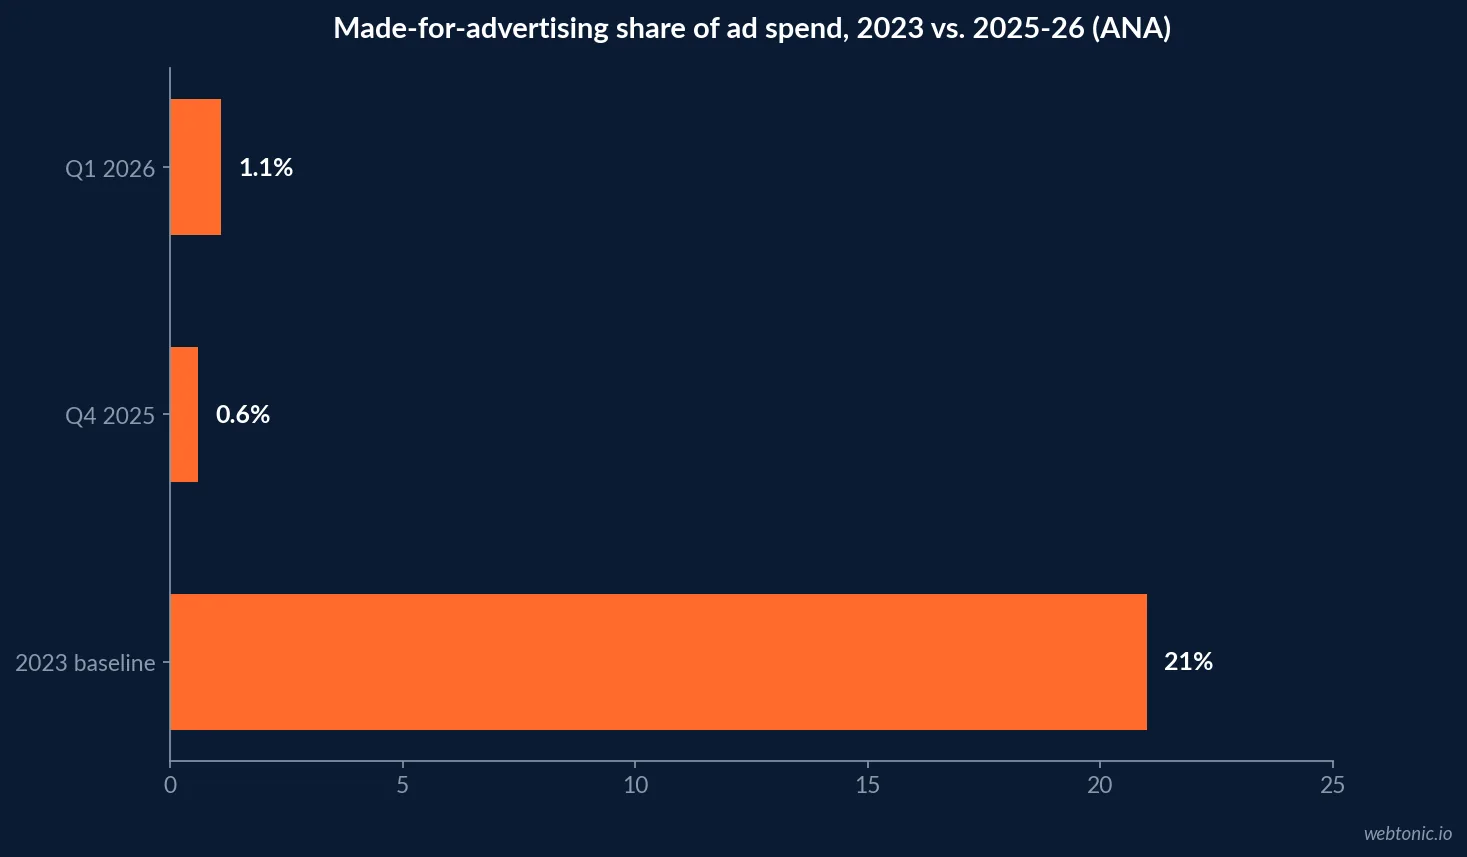
- Made-for-advertising (MFA) spend rose to 1.1% of ANA members' budgets in Q1 2026, up from 0.6% in Q4 2025.
- That is the first MFA increase since the ANA's 2023 crackdown began.
- The ANA's original study found 21% of budgets, about USD 13 billion, went to MFA in 2023.
- Lower-performing advertisers spend 2.1% of budget on MFA against 0.9% for top performers.
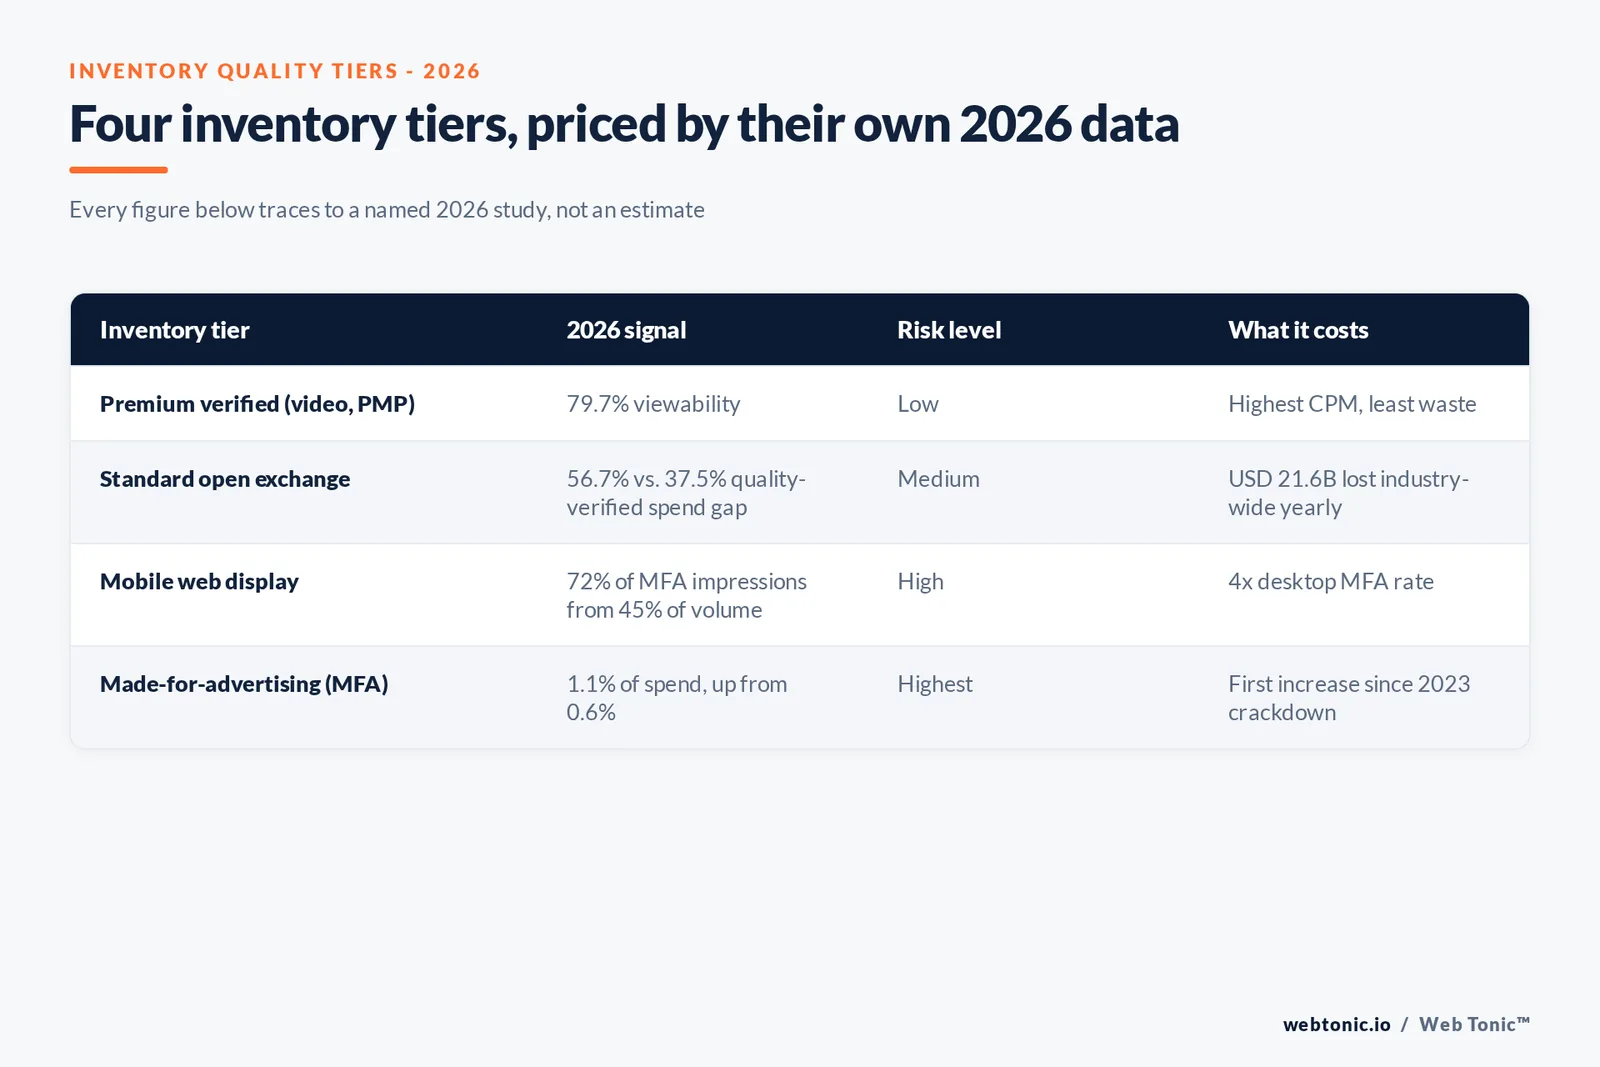
- Mobile web display drives 72% of industry-wide MFA impressions despite being 45% of impressions (IAS).
- Mobile web also drives 55% of brand suitability failures, per the same report.
- Video viewability reached 79.7% against 67.9% for display, an 11.8 point gap.
- Disciplined advertisers direct 56.7% of programmatic spend to quality-verified impressions.
- Lower-performing advertisers manage only 37.5% on the same measure.
- An estimated USD 21.6 billion in programmatic spend is lost to supply chain inefficiency every year.
- CTV fraud schemes and variants rose 140% year over year in Q1 2026, per DoubleVerify.
The inventory pool by format
Start with the size of the shelf. IAB and PwC's 2025 Internet Advertising Revenue Report puts total U.S. digital ad revenue at USD 294.6 billion, up 13.9% year over year across every format tracked. Display specifically - the format most directly tied to open-web inventory supply - reached USD 81.6 billion, growing 9.8%, while digital video grew faster at 25.4% to USD 78.0 billion as streaming inventory expands.
| Inventory format, 2025 | Revenue | YoY growth | Share of total |
|---|---|---|---|
| Display | USD 81.6B | 9.8% | 27.7% |
| Digital video | USD 78.0B | 25.4% | 26.5% |
| Social | USD 117.7B | 32.6% | 40.0% |
| Search | USD 114.2B | 11.0% | 38.8% |
| Commerce media | USD 63.4B | 18.0% | 21.5% |
Connected TV supply, measured directly
Pixalate's Q1 2026 Global CTV Ad Supply Chain Trends Report analyzed programmatic activity across more than 210,000 CTV apps and 19 billion global open programmatic ad transactions in a single quarter, spanning Roku, Amazon Fire TV, Apple TV and Samsung Smart TV. That volume translates to an estimated USD 6.2 billion in global open programmatic CTV ad spend for Q1 2026 alone - a supply pool that barely existed as a programmatic category a decade ago and now rivals entire legacy media categories on transaction volume.
| CTV supply metric, Q1 2026 | Figure | Source |
|---|---|---|
| CTV apps analyzed | 210,000+ | Pixalate |
| Global open programmatic transactions | 19 billion | Pixalate |
| Estimated global open programmatic CTV spend | USD 6.2 billion | Pixalate |
| CTV fraud schemes and variants, YoY change | +140% | DoubleVerify (via PPC Land) |
Made-for-advertising inventory: down, then back up
Not all of that growing supply is inventory worth buying. The Association of National Advertisers' programmatic benchmark reports trace made-for-advertising (MFA) spend from its original 2023 baseline - 21% of member budgets, roughly USD 13 billion annually - down to 0.6% by Q4 2025 as SSPs built stronger vetting. In Q1 2026 that share doubled to 1.1%, the first increase since the crackdown began, which the ANA links partly to "AI slop" as a growing MFA sub-type. The average figure also hides a performance split: advertisers whose campaigns underperform their peers spend 2.1% of budget on MFA, more than double the 0.9% spent by the highest-performing cohort.
| MFA spend milestone | Share of ad budget | Period | Source |
|---|---|---|---|
| Original crackdown baseline | 21% (~USD 13B/yr) | 2023 | ANA |
| Trough after mitigation | 0.6% | Q4 2025 | ANA |
| First increase since 2023 | 1.1% | Q1 2026 | ANA |
| Lower-performing advertiser cohort | 2.1% | Q1 2026 | ANA |
| Higher-performing advertiser cohort | 0.9% | Q1 2026 | ANA |
Mobile web is where quality risk concentrates
Integral Ad Science's 21st-edition Media Quality Report found mobile web display accounts for 45% of measured impressions but a disproportionate 72% of MFA impressions and 55% of brand suitability failures. Video inventory looks meaningfully cleaner on the same yardstick: IAS measured video viewability at 79.7% against 67.9% for global display, an 11.8 percentage point gap the report frames as widening as attention becomes a bigger pricing factor.
| Inventory quality signal (2025-2026) | Figure | Comparison | Source |
|---|---|---|---|
| Mobile web share of all impressions | 45% | — | Integral Ad Science |
| Mobile web share of MFA impressions | 72% | 4x its impression share | IAS |
| Mobile web share of brand suitability failures | 55% | — | IAS |
| Video viewability | 79.7% | vs. 67.9% for display | IAS |
| Mobile web viewability | 64.5% | vs. 71.6% for desktop | IAS (via PPC Land) |
What poor inventory quality costs in dollars
Basis Technologies puts a number on the industry-wide leak: an estimated USD 21.6 billion in programmatic spend is lost to supply chain inefficiency every year. The gap shows up clearly at the campaign level too. In Q4 2025, advertisers running disciplined quality governance directed 56.7% of programmatic spend into impressions that were viewable, measurable, and fraud- and MFA-free. Advertisers without that discipline managed only 37.5% - a difference of nearly twenty percentage points on the exact same open exchange supply. That gap is not a one-time finding; Basis has tracked the same quality-governance split across multiple quarters, and the direction has not reversed even as overall inventory volume keeps growing on both sides of the split.
Video and commerce inventory are growing the fastest, cleanest
Not every growth story on the supply side is a quality story. IAB and PwC found digital video revenue grew 25.4% in 2025 to USD 78.0 billion, and commerce media - inventory tied directly to retail and marketplace properties - grew 18.0% to USD 63.4 billion, both outpacing display's 9.8% growth. Podcast advertising, a smaller but fast-moving inventory category, grew 17.6% to USD 2.9 billion. These are also the categories where Integral Ad Science's quality data shows the least MFA and brand suitability risk, since video and commerce placements are harder to fake at scale than a low-effort content page carrying banner inventory. The practical implication for a 2026 media plan is that inventory growth and inventory quality are correlated in some categories and inversely correlated in others - display's slower growth sits alongside its outsized MFA exposure, while video's faster growth sits alongside a widening viewability advantage.
| Inventory category, 2025 growth | YoY growth | Relative quality signal |
|---|---|---|
| Digital video | 25.4% | Highest viewability (79.7%) |
| Commerce media | 18.0% | Harder to fake at scale |
| Podcast | 17.6% | Limited MFA exposure documented |
| Display | 9.8% | Carries the bulk of MFA risk |
Buying against the gap, not around it
Any inventory strategy built on the data above should treat the format-quality correlation as a starting filter, not a final answer - video and commerce inventory still need viewability and brand-safety verification, and display inventory still carries plenty of legitimately strong publisher supply once MFA and mobile web risk are filtered out. Our Google Ads management team builds that filtering into every programmatic and Performance Max plan before spend goes live.
The practical takeaway is not to avoid open-exchange or mobile inventory outright - both categories carry real reach that a media plan cannot replace with premium-only buying at scale. It is to price the quality gap explicitly: build supply path optimization into the plan the way a disciplined advertiser already does, treat mobile web display as a category that needs extra filtering rather than a blanket exclusion, and budget for the reality that MFA mitigation is not a one-time project - the Q1 2026 uptick shows it needs standing monitoring. Reviewing supply paths on a quarterly cadence rather than a one-time audit is the difference between catching a rebound like the one the ANA recorded in Q1 2026 and finding out about it two quarters later, once budget has already leaked into it. For the buy-side plan that sits on top of this inventory data, see our performance creative practice or our guide to where paid social inventory is worth the spend.
Frequently Asked Questions
How much advertising inventory exists across formats in 2026?
IAB and PwC measured USD 294.6 billion in total 2025 U.S. digital ad revenue, with display inventory alone worth USD 81.6 billion and growing 9.8% year over year. On the connected TV side specifically, Pixalate's Q1 2026 analysis covered more than 210,000 CTV apps and 19 billion global open programmatic ad transactions, translating to roughly USD 6.2 billion in global open programmatic CTV spend for the quarter.
What share of inventory is made-for-advertising (MFA) content?
It is small in aggregate but rising again. The ANA's original 2023 study found its member advertisers spent 21% of budgets - about USD 13 billion annually - on MFA. Mitigation efforts pushed that down to 0.6% of spend by Q4 2025, but it rose back to 1.1% in Q1 2026, the first increase since the crackdown began. Lower-performing advertisers spend more than double the MFA share of top performers: 2.1% versus 0.9%, per the ANA's Q1 2026 benchmark.
Is mobile inventory worse quality than desktop?
On some measures, yes, and by a wide margin. Integral Ad Science's 21st-edition Media Quality Report found mobile web display accounts for 45% of impressions but 72% of MFA and 55% of brand suitability failures industry-wide. Reporting on the same study found mobile web's MFA rate running four times higher than desktop browser display, and mobile web viewability at 64.5% against 71.6% for desktop.
How much does poor-quality inventory actually cost advertisers?
Basis Technologies estimates USD 21.6 billion in programmatic spend is lost to supply chain inefficiency every year. The gap is measurable at the campaign level too: in Q4 2025, advertisers running rigorous quality governance directed 56.7% of programmatic spend into viewable, measurable, fraud- and MFA-free impressions, while lower-performing advertisers managed only 37.5%.
Is video inventory higher quality than display inventory?
Video consistently outperforms display on the measures that matter to buyers. Integral Ad Science's 2026 report found video viewability at 79.7% against 67.9% for global display - an 11.8 percentage point gap the report describes as widening as attention becomes a bigger factor in how inventory is valued and priced.
Sources
IAB - 2025 Internet Advertising Revenue Report (with PwC)
Pixalate - Q1 2026 Global CTV Ad Supply Chain Trends Report
AdExchanger - MFA ad spend is increasing, citing ANA Q1 2026 benchmark
Integral Ad Science - Media Quality Report, 21st Edition
PPC Land - Advertisers face 4x higher MFA rate on mobile web display, IAS finds
Basis Technologies - The case for supply path optimization as a strategic priority
PPC Land - CTV fraud schemes up 140%, citing DoubleVerify 2026 Global Insights report


