Table of contents
80% of Meta ad creatives never reach 100,000 lifetime impressions, so most ads that get called "fatigued" never had the exposure required to wear out. This page collects the 2026 lifespan, frequency and cost data marketers need to tell real creative fatigue apart from a creative that simply never worked.
Key Takeaways
- 80% of creatives never reach 100,000 lifetime impressions, in a 48.5M-impression Meta dataset.
- 89% never reach 250,000 impressions in the same dataset.
- The median creative runs 18 days and delivers 10,665 lifetime impressions.
- CTR falls 5.5% between a creative's first 100,000 impressions and the 100-250k range.
- CPA rises 19.6% above baseline by the 500k-1M impression mark, and stays elevated.
- CPM stays within 3.1 points of baseline across the same impression range.
- Across a separate 2.9-million-ad sample, the median Meta ad runs just 3 days.
- 75% of ads are pulled within 8 days; only 5% run past 38 days.
- High-reach winners (500K-plus impressions) run a median of 17 days, 5-6x longer than typical.
- LinkedIn's median observed ad run is 43.3 days, far longer than Meta's or YouTube's.
- 54% of a 24,650-ad sample disappeared within 7 days; only 9.4% ran past 90 days.
- Measurable click-through decay begins around frequency 2.0 to 2.8.
- CPA increases 47% to 98% once weekly frequency exceeds 3.4.
- CPM can creep 28% to 40% in the first 14 days of running the same creative pool.
- CPM creep tends to arrive 4 to 7 days before CTR visibly drops.
Most ads never live long enough to fatigue
The starting fact reframes most fatigue conversations: creative decay assumes a creative reached enough volume to decay in the first place, and most don't. A 2026 dataset spanning 368 ads, 15 DTC brands and 48,450,354 impressions - reported by Interconnections' Meta Creative Fatigue Benchmark and independently analyzed by AdRiseLab - found 80% of creatives never reach 100,000 lifetime impressions and 89% never reach 250,000. To hit even a frequency of 2.5 against a modest 200,000-person audience requires roughly half a million impressions; 93% of the creatives in this dataset never got there.
| Percentile | Active days | Lifetime impressions |
|---|---|---|
| 25th percentile | 6 | 524 |
| Median | 18 | 10,665 |
| 75th percentile | 46 | 74,418 |
| 90th percentile | 76 | 293,876 |
What happens to CTR, CPA and CPM as impressions climb
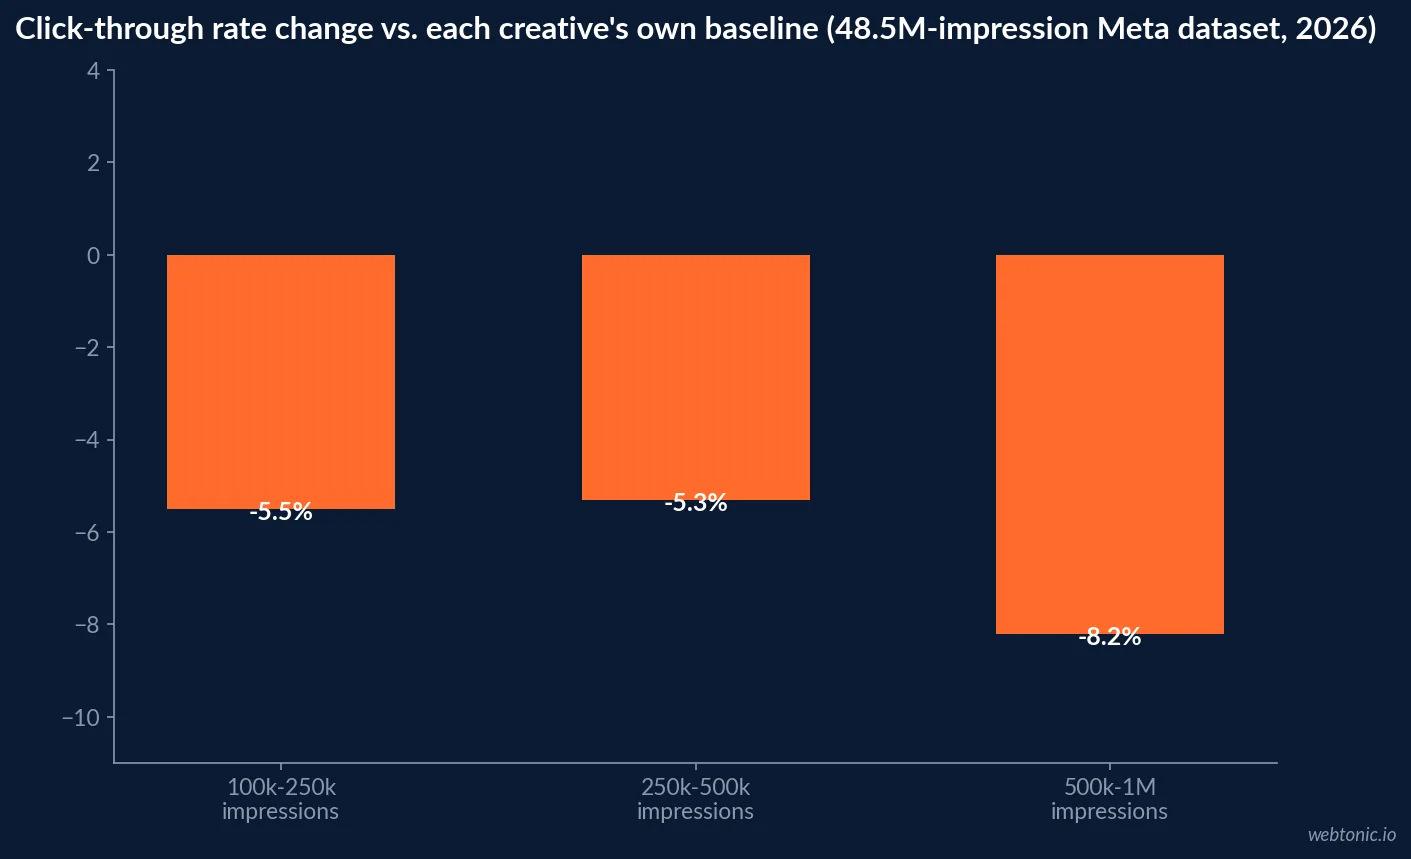
For the minority of creatives that do reach volume, the fatigue-benchmark analysis restricted its curve to 57 creatives across 13 brands with at least 150,000 lifetime impressions, comparing each creative against its own first-100,000-impression baseline. Click-through rate steps down early and then broadly flattens rather than sliding continuously - a materially different shape than the smooth decay curve most fatigue frameworks assume.
| Impression stage | CTR vs. baseline | Other published observation |
|---|---|---|
| 100k-250k | -5.5% | Early decline |
| 250k-500k | -5.3% | Broadly flat vs. prior bucket |
| 500k-1M | -8.2% | Not a smooth continuous slide |
| 500k-1M (CPA) | n/a | CPA ran 19.6% above baseline |
| Across the full range (CPM) | n/a | Stayed within 3.1 points of baseline |
The practical read: cost per acquisition, not click-through rate, is the number that should trigger a refresh. CTR decays early and then holds roughly flat, while CPA keeps rising and stays elevated - and CPM, despite the widely repeated "CTR slides, then CPM creeps up" narrative, barely moved at all in this dataset.
How long ads actually run, by platform
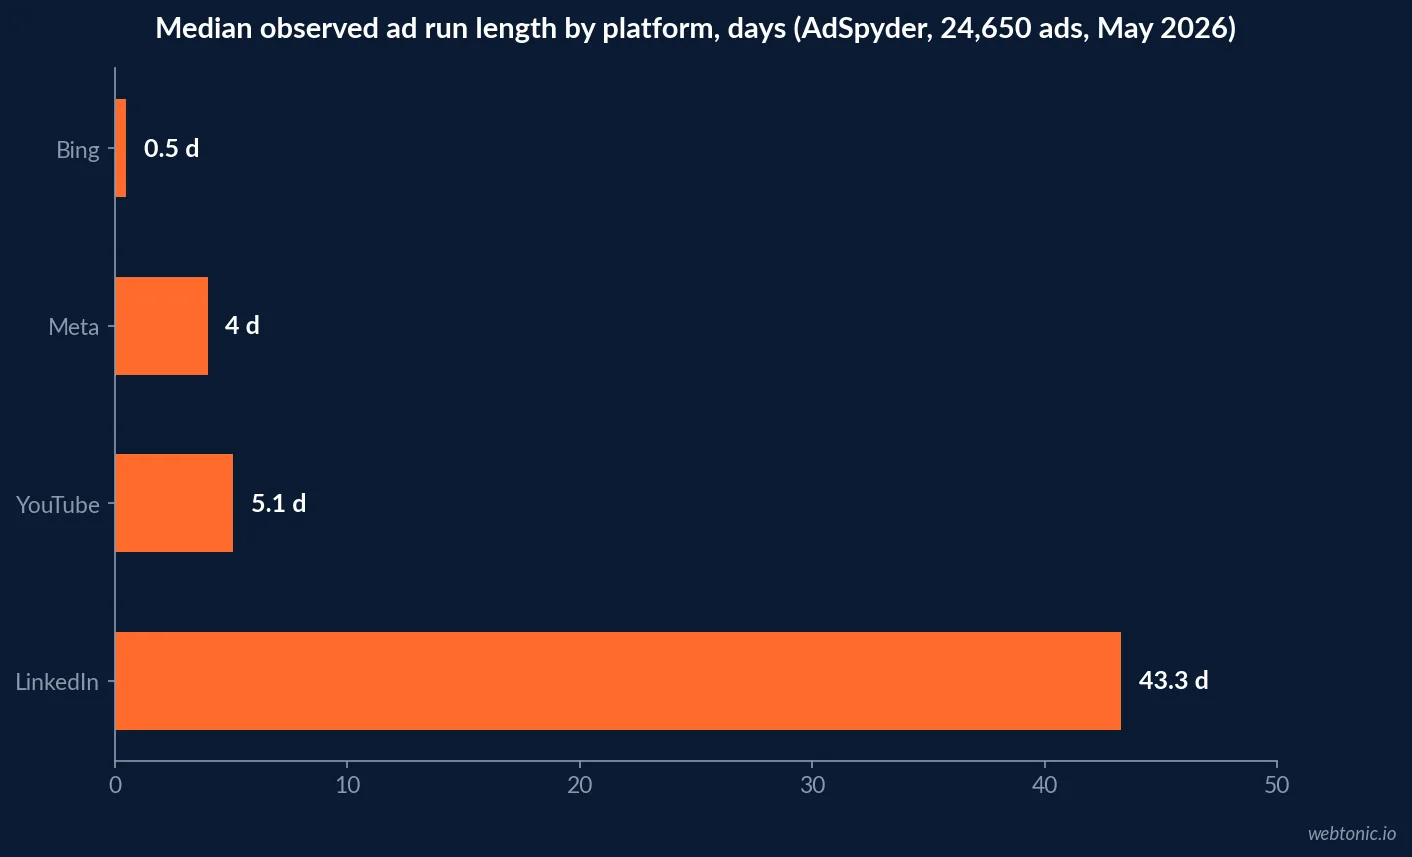
Creative persistence varies enormously by advertising environment. AdSpyder's 2026 analysis of 24,650 ads with usable first-seen and last-seen dates found more than half disappear within a week - but that overall figure masks a wide platform split.
| Platform | Sample size | Median observed days | Share running 30+ days | Share running 90+ days |
|---|---|---|---|---|
| 4,650 | 43.3 | 70.7% | 22.3% | |
| Meta | 4,000 | 4.0 | 29.8% | 15.5% |
| YouTube | 5,000 | 5.1 | 22.1% | 7.8% |
| Bing | 4,500 | <1 | 8.1% | 4.4% |
Across the full 24,650-ad sample, 54% disappeared within 7 days, 24% ran 7-30 days, 22% ran 30-plus days, and only 9.4% ran past 90 days. This is a market-behavior signal drawn from observable creative persistence, not a direct measure of engagement decline - a long-running ad may simply be profitable, and a short-lived one may have been killed for reasons unrelated to fatigue.
The 2.9-million-ad dataset: median lifespan by tier
A separate, larger sample confirms the same shape at scale. Skaler's analysis of 2.9 million inactive Meta ads launched between January 2025 and April 2026 found the median ad ran just 3 days before being killed, with the 75th percentile at 8 days. High-reach winners - ads that crossed 500,000 EU impressions - lasted far longer at a median of 17 days, 5-6x the overall median, though even among that elite group only the top 10% ran past 100 days.
| Cohort | Median lifespan | Notable percentile |
|---|---|---|
| All inactive Meta ads (2.9M sample) | 3 days | 75% killed within 8 days |
| High-reach winners (500K+ EU impressions) | 17 days | Top 10% ran past 100 days |
| Overall top decile | 22+ days | Top 5% ran past 38 days |
Frequency thresholds: where decay starts and where it cliffs
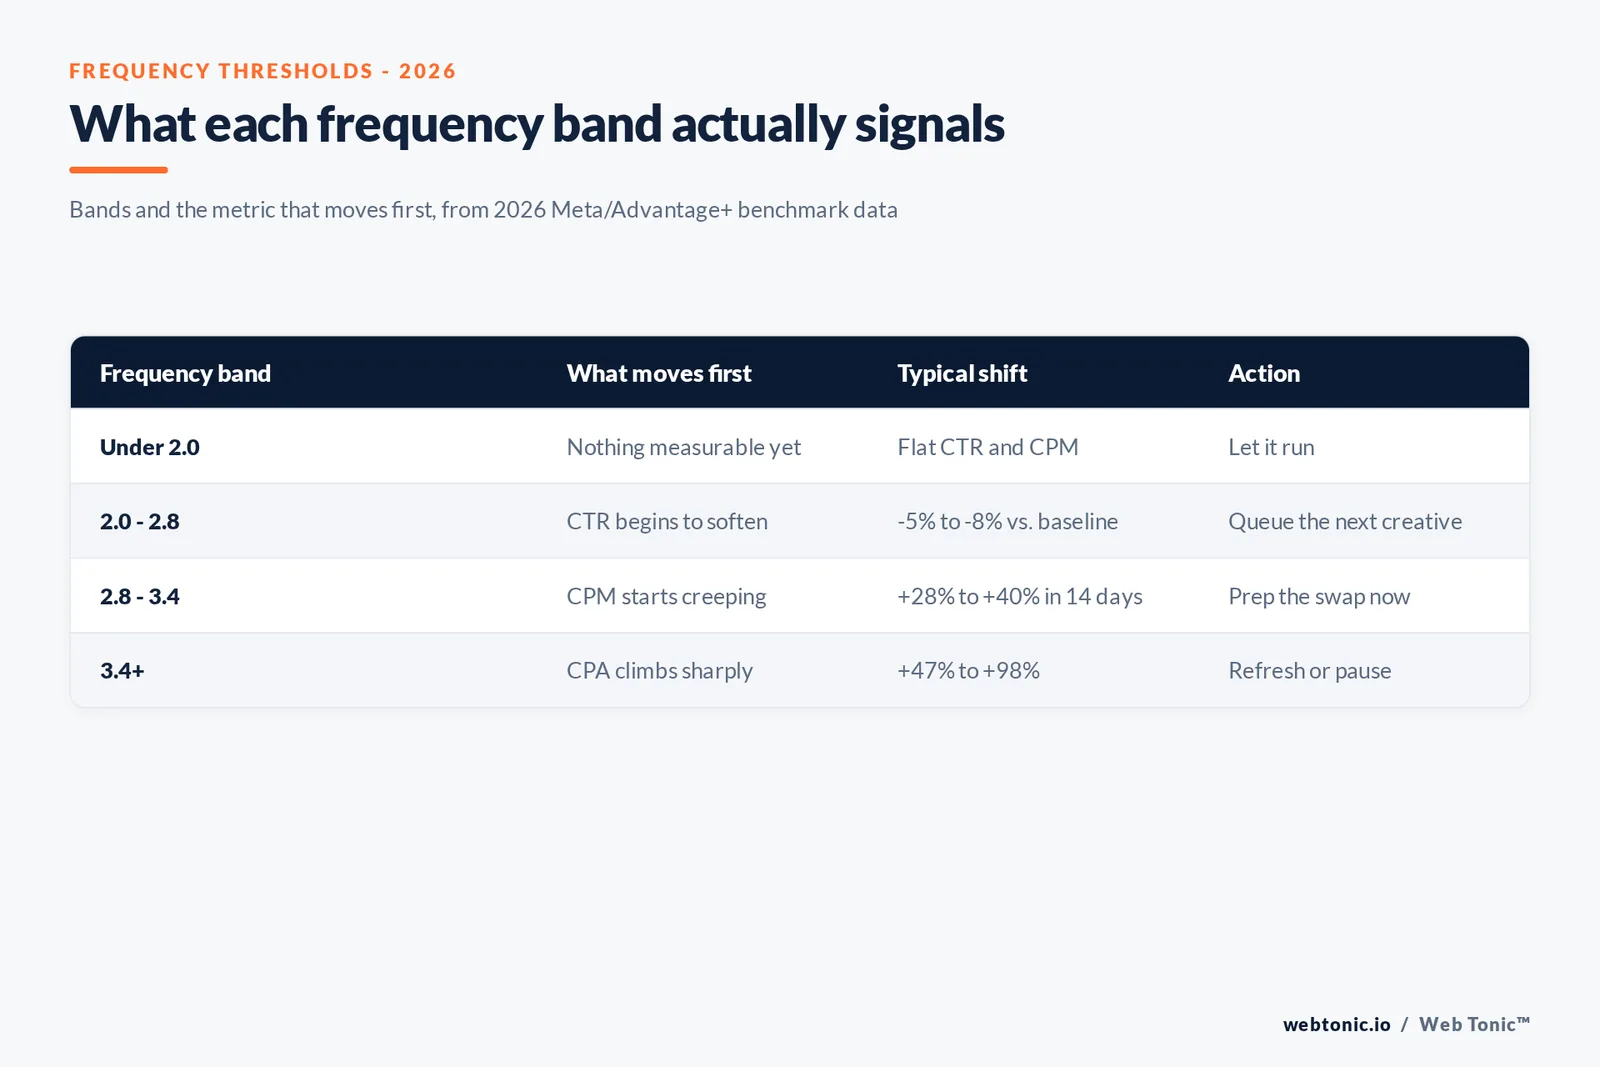
Frequency remains the single most predictive variable of creative decay once a creative has enough volume to measure, according to a 2026 industry-benchmark synthesis from Prestyj's creative fatigue statistics by industry, citing Meta Advantage+ benchmarks alongside AdEspresso and Varos 2026 data. The pattern is consistent within a vertical and materially different between verticals.
| Frequency band | What the data shows |
|---|---|
| 2.0 - 2.8 | Measurable CTR decay begins, the universal warning line across every industry studied |
| 3.4+ | CPA increases an average of 47% to 98% - the real cliff |
| First 14 days at volume | CPM can creep 28% to 40% before CTR visibly drops |
CPM creep: the earliest warning sign
Ordering matters for a refresh policy. Prestyj's synthesis reports that CPM creep precedes CTR collapse by 4 to 7 days in every vertical studied, making it the earliest reliable fatigue signal - and one most teams don't actively monitor, watching CTR or CPA instead. By the time CPA visibly spikes, a campaign has typically been losing efficiency for several days already.
Fatigue benchmarks by industry
Local-service verticals with narrow geographic audiences hit the frequency cliff fastest, since a smaller addressable audience reaches high frequency at a lower absolute impression count.
| Industry | Fatigue frequency (Meta) | CPM creep (14 days) | Refresh cadence target |
|---|---|---|---|
| HVAC | 3.1 | +34% | 12-20 new ads/month |
| Roofing | 2.8 | +38% | 15-25 new ads/month |
| Solar | 3.4 | +31% | 12-20 new ads/month |
| Real estate | 2.6 | +36% | 20-30 new ads/month |
| Mortgage | 3.0 | +33% | 15-25 new ads/month |
Why frequency 3 is no longer a reliable rule
Meta's own late-2025 advertiser guidance, cited in Skaler's 2026 analysis, describes performance now degrading through declining conversion efficiency more than through click-through rate alone - which means CTR, the metric most teams still watch first, is actually the second or third domino to fall, not the first. The practical sequence in 2026 runs hook rate down, then CTR, then CPM, then CPA and ROAS - and by the time ROAS visibly drops, a campaign has usually been losing money for three to five days already because the earlier signals went unwatched. Teams running a cross-channel paid program should build refresh cadence around CPM and CPA trend lines, not a fixed frequency number or a calendar-based swap schedule, and treat rising CPMs as the first checkpoint rather than the last.
Turning the data into a refresh policy
Three implications follow directly from the datasets above. First, most creative doesn't need a fatigue policy at all - it needs a performance policy, since 80%+ never reach the impression volume where fatigue is even possible. Second, the trigger metric should be CPA or CPM trend, not CTR or a flat frequency-3 rule, since CTR flattens early while CPA keeps degrading. Third, refresh cadence should be set per platform and per vertical: a LinkedIn campaign with a 43-day median lifespan does not need the same refresh discipline as a Meta or YouTube campaign measured in single-digit days. Teams that want a second opinion on cadence can compare notes with an agency running paid social creative production at volume before locking a fixed refresh calendar.
What fatigue-resistant brands do differently
Skaler's 2.9-million-ad dataset didn't just measure how fast creative dies - it isolated what separates the ads that survive from the median 3-day creative. The pattern isn't random: high-reach winners consistently share a singular hook (one clear idea per ad rather than several competing messages), a recurring format the audience can recognize quickly, and hook-level iteration - testing variations on the opening few seconds or first line rather than rebuilding the entire creative from scratch for every refresh. That last point matters for production planning: a refresh cadence built around swapping hooks on a proven format structure is materially cheaper to sustain than a refresh cadence that requires a brand-new concept every cycle, and it matches the 12-30 new-ads-per-month cadence documented across every vertical in the industry table above.
The production implication is direct: teams that can only ship a handful of net-new concepts a quarter should spend that budget on formats, not one-off executions, and layer hook variations on top of whatever format is already working. This is also where refresh cadence and creative supply chain intersect - a program targeting 20-30 new ads a month, per the real-estate and finance rows in the table above, needs a production process built for volume, not a boutique one-off shoot every few weeks. Brands weighing that build-versus-buy decision for creative production at volume should size the decision against their own measured frequency cliff, not a generic industry rule, since the data above shows that cliff moving from 2.6 to 3.4 depending on vertical.
None of this requires guessing at a universal number. A team that logs its own frequency, CTR, CPM and CPA by creative - even in a simple spreadsheet alongside the platform's native reporting - can plot its own decay curve against the ranges in this article within a few weeks of spend, and set a refresh trigger specific to its own audience size and vertical rather than importing someone else's frequency rule wholesale.
Frequently Asked Questions
At what frequency does ad fatigue really start?
Around frequency 2.0 to 2.8 for early, measurable click-through decay, based on 2026 Meta and Advantage+ benchmark data - not the flat frequency-3 rule many teams still use. Cost-per-acquisition damage arrives later and harder: CPA increases an average of 47% to 98% once weekly frequency exceeds 3.4, which is the more useful trigger for an actual refresh decision.
How long does the average ad creative actually run?
Far shorter than most fatigue conversations assume. Across 2.9 million Meta ads launched in 2025-2026, the median creative lasted just 3 days before being killed, and 75% were pulled within 8 days. On LinkedIn, the median observed run length is dramatically longer at 43.3 days, and on YouTube it's about 5.1 days - fatigue timelines are platform-specific, not universal.
Does ad fatigue mostly explain underperforming ads?
Less often than assumed. A 2026 dataset of 368 Meta ads and 48.5 million impressions found 80% of creatives never reach 100,000 lifetime impressions and 89% never reach 250,000 - meaning most ads that get labeled "fatigued" never had the exposure required to wear out. Many underperforming ads are better described as creative failures (never worked) than creative fatigue (stopped working).
What metric should trigger a creative refresh?
Cost per acquisition, not click-through rate. In the 48.5-million-impression dataset, CTR declined early (-5.5% by the 100,000-250,000 impression range) and then broadly flattened, while CPA rose 19.6% above baseline by the 500,000-1,000,000 impression mark and stayed elevated. CPM barely moved across the same range - the popular "CTR slides, then CPM creeps up" sequence didn't appear in this data.
How much does CPM rise once a creative starts fatiguing?
In creative pools that do run at volume, CPM can creep 28% to 40% in the first 14 days of running the same set, and that creep tends to arrive 4 to 7 days before CTR visibly drops - making CPM movement the earliest reliable warning sign in most verticals, ahead of both CTR and CPA.
Sources
Interconnections, Meta Creative Fatigue Benchmark 2026
AdRiseLab, Creative Fatigue or Creative Failure? 2026
AdSpyder, Ad Fatigue Benchmarks 2026
Skaler, Creative Fatigue in 2026: How Fast Meta Ads Actually Die
Prestyj, Creative Fatigue Statistics by Industry 2026