Table of contents

An estimated 1.1 billion people blocked ads globally in Q4 2025, roughly 30% of the total internet population, and mobile blocking is growing fastest even as the overall block rate declines against a larger internet. This page pulls together the 2026 data marketers need to size how much of their paid reach is actually being seen.
Key Takeaways
- 1.1 billion people used an ad blocker globally across devices in Q4 2025.
- That represents 30% of the total internet population.
- Global ad-blocking users have grown 13% since 2023.
- Mobile ad-blocking users grew 27% since 2023, reaching 629 million.
- Desktop ad-blocking users declined 4% since 2023, to 448 million.
- The USA ad-block rate sits at 33%, one of the highest among major markets measured.
- Germany's desktop block rate reached 51% in 2026, up 10 points since 2020.
- Developer tools and SaaS sites see 40-60% of traffic blocked, the highest of any vertical measured.
- 52% of consumers across 48 markets have installed or used an ad blocker.
- 29.5% of internet users worldwide ran an ad blocker as of Q2 2025.
- A worked example shows a mid-size site losing USD 43,776 a year to blocked pageviews.
- Mobile block rates are measured 2-4x higher than most site owners assume once properly instrumented.
- Ad-block growth in lower- and middle-income countries is up 23%, offsetting a 14% decline in high-income markets.
- Traffic to YouTube's ad-blocker help pages spiked 336% after its 2025 crackdown.
- Only 11% of users said the YouTube crackdown made them less likely to use a blocker.
- Brave surpassed 100 million monthly active users in October 2025, blocking by default.
How many people block ads worldwide in 2026
eyeo's 2026 Ad-Blocking Report is the most current large-scale estimate of global ad-blocking adoption. It puts the total ad-blocking population at 1.1 billion in Q4 2025, 13% higher than eyeo's 2023 report, and equal to roughly 30% of the total internet population.
| Segment | Q4 2025 users | Change since 2023 |
|---|---|---|
| Total (desktop + mobile) | 1.1 billion | +13% |
| Desktop | 448 million | -4% |
| Mobile | 629 million | +27% |
Desktop vs. mobile: where blocking is growing
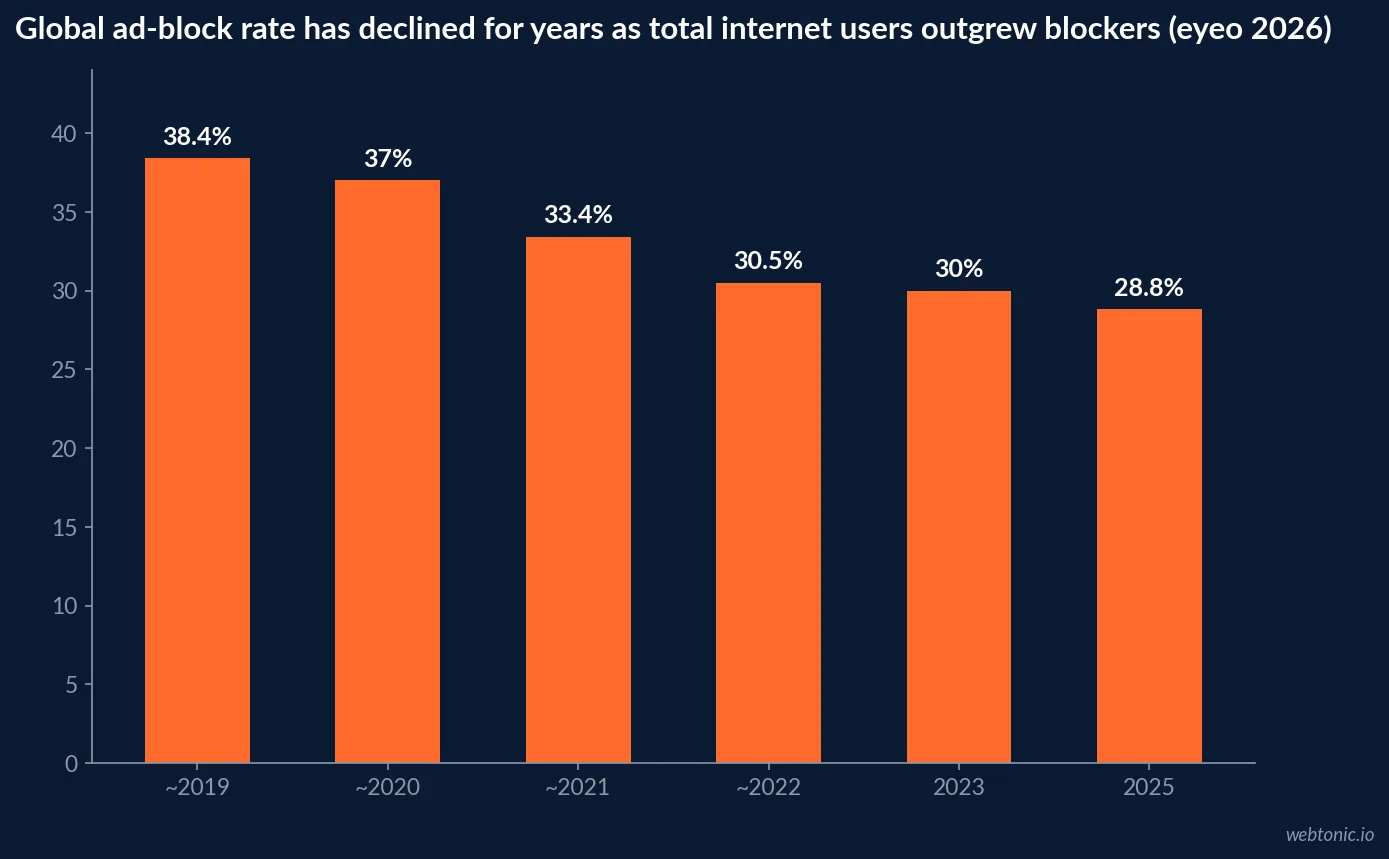
The headline number hides a split market. Desktop ad blocking peaked in 2022 and has eased slightly since, while mobile blocking - historically the smaller segment - is now growing fast enough to carry the entire category's growth. Ad-blocking growth in lower- and middle-income countries (+23% since 2023) is also offsetting a 14% decline across higher-income markets, where blocker adoption is more mature and closer to saturation.
Ad block rates by country
Country-level rates vary widely and don't track GDP in any simple way - privacy culture, browser mix and mobile carrier practices all matter more than income level.
| Country | 2025 ad-block rate | Country | 2025 ad-block rate |
|---|---|---|---|
| USA | 33% | UK | 27% |
| Germany | 31% | France | 29% |
| Canada | 33% | Australia | 29% |
| Japan | 15% | India | 25% |
| Indonesia | 41% | Brazil | 29% |
Which industries lose the most traffic to blockers
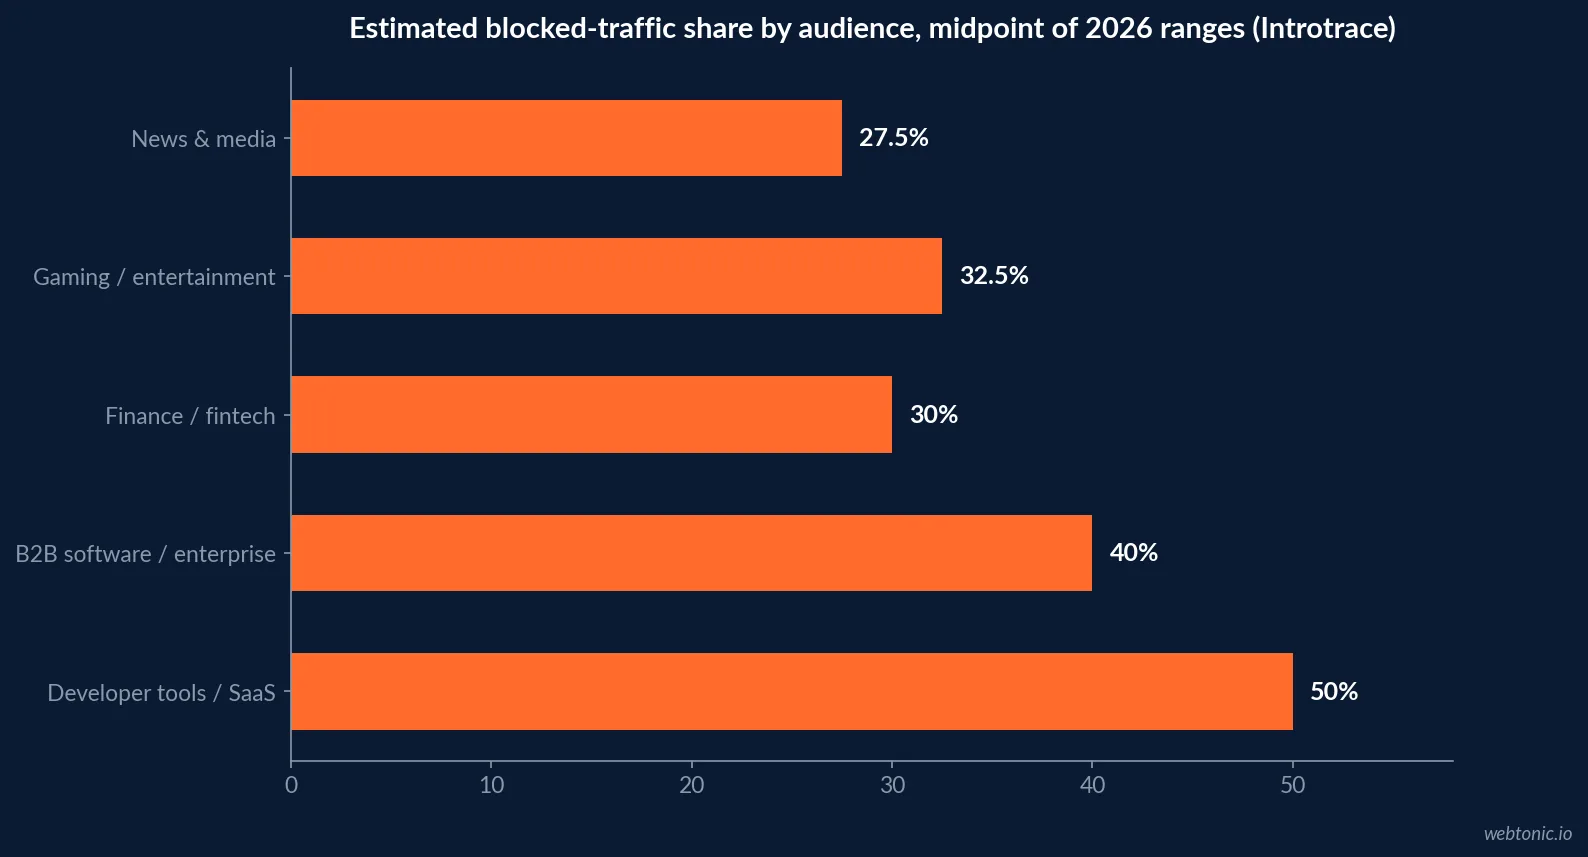
Introtrace's 2026 ad blocker statistics break the global average down by audience type, and the spread is wide: a general-consumer B2C site can sit well under the global average while a developer-facing SaaS product loses more than half its traffic to blockers.
| Industry / audience | Estimated blocked traffic | Primary driver |
|---|---|---|
| Developer tools / SaaS | 40-60% | High uBlock Origin and Brave adoption among engineers |
| B2B software / enterprise | 30-50% | IT staff, security-conscious buyers, corporate filtering |
| Finance / fintech | 25-35% | Privacy-conscious users; Brave popular in crypto/finance |
| Gaming / entertainment | 25-40% | Brave widely adopted; younger audiences block more |
| News & media | 20-35% | Ad-heavy pages drive extension installs; Firefox ETP affects every reader |
What a blocked pageview actually costs
Most publishers underestimate their exposure because standard ad-server analytics only count an impression once the ad script fires - a blocked pageview simply looks like a missing impression, not a blocked one. DeBlocker's 2026 publisher loss report, built on data from 4,200-plus publisher sites and 11 billion monthly pageviews, walks through a worked example: a site with 4 million monthly pageviews, a $2.40 RPM and a measured 38% block rate loses USD 43,776 a year in blocked revenue (pageviews × RPM × block rate × 12 / 1,000). The report also flags that a general news block rate of 36% can mask a programming-focused blog running as high as 58%.
Desktop block rate trend by market, 2020 vs. 2026
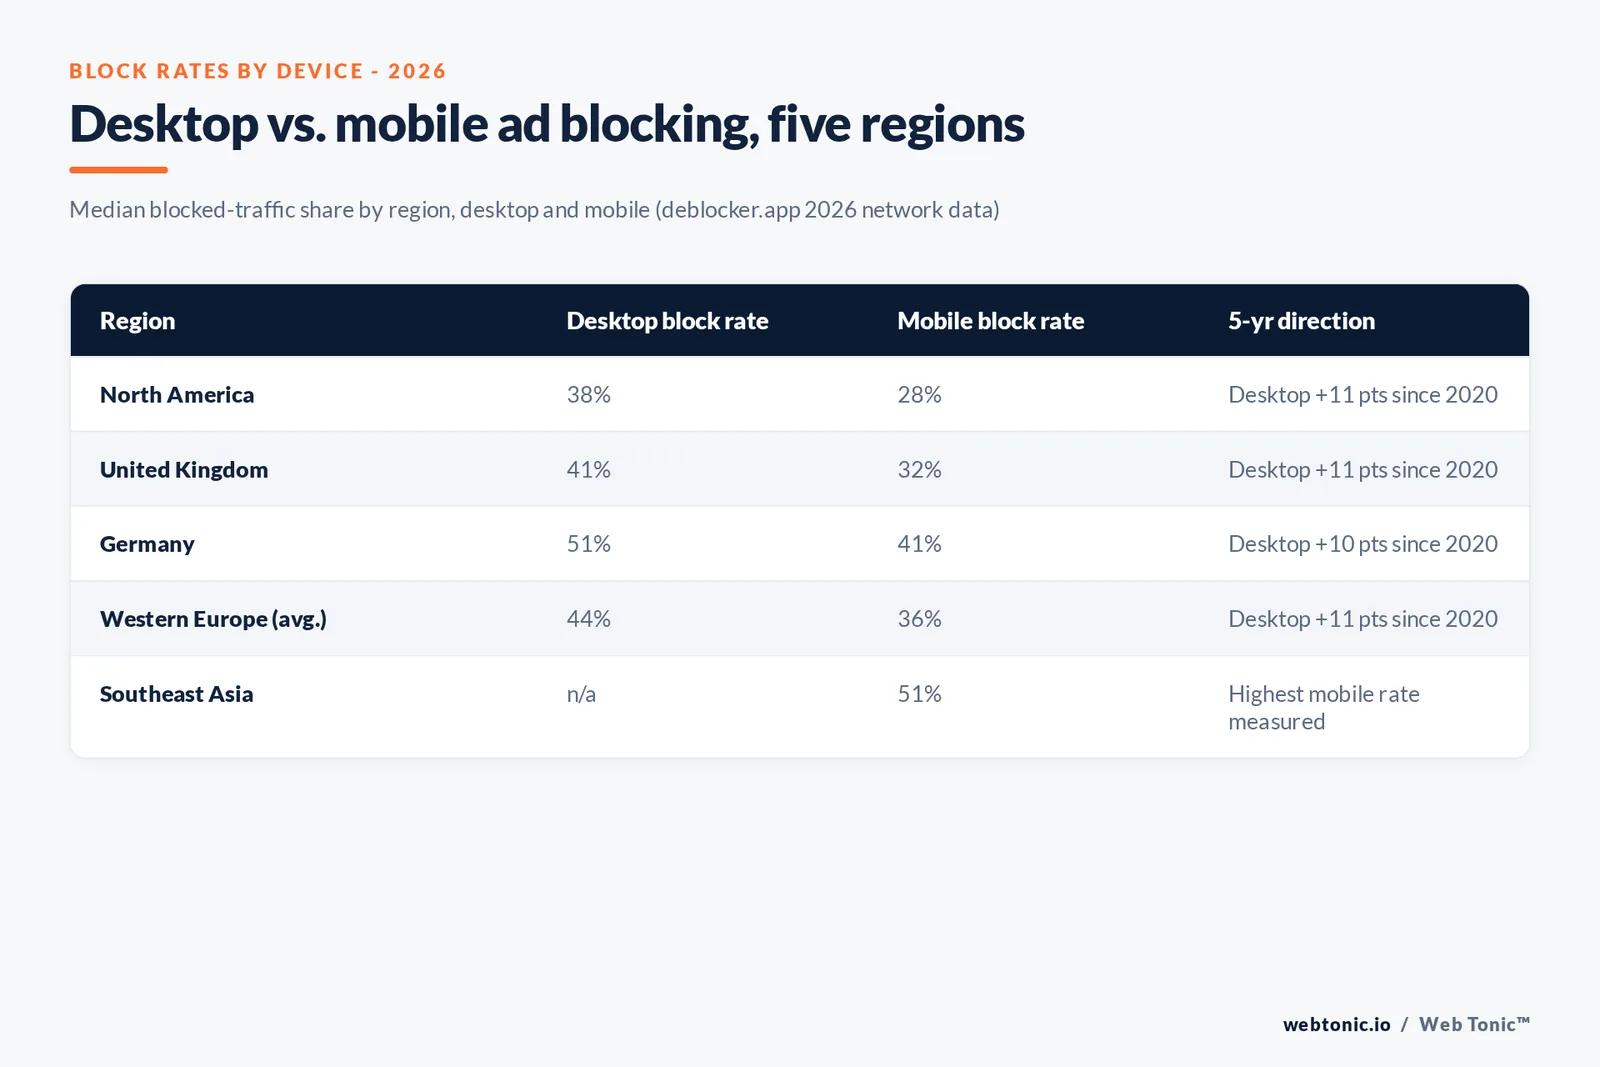
Every major market DeBlocker measured shows desktop blocking climbing 10-13 percentage points since 2020, with Eastern Europe and Germany posting the highest 2026 rates.
| Market | Desktop block rate, 2026 | 2020 baseline | Change |
|---|---|---|---|
| North America | 38% | 27% | +11 pts |
| United Kingdom | 41% | 30% | +11 pts |
| Germany | 51% | 41% | +10 pts |
| France | 39% | 28% | +11 pts |
| Eastern Europe (avg.) | 51% | 38% | +13 pts |
| Australia / NZ | 36% | 24% | +12 pts |
Mobile ad blocking: the hidden problem
Mobile is where measurement gaps hurt the most. DeBlocker's 2026 mobile-only follow-up report found most publisher operators believe their mobile block rate sits between 8% and 15%, when properly instrumented measurement typically shows 30-60% depending on vertical and traffic source. The blended mobile rate across DeBlocker's network in 2026 measured about 34%.
| Region | Mobile block rate (median) | Range |
|---|---|---|
| North America | 28% | 22-34% |
| United Kingdom | 32% | 26-38% |
| Western Europe | 36% | 29-43% |
| Germany | 41% | 35-48% |
| Southeast Asia | 51% | 41-63% |
Why users install blockers
Adoption is broad and not limited to a niche technical audience. eMarketer's 2026 FAQ on ad blocking cites YouGov data showing 52% of consumers across 48 global markets have installed or used an ad blocker (45% in the US specifically), while GWI research finds 21% of global consumers use blockers regularly and another 11% use them "now and then." Adoption skews toward younger, male consumers, particularly those aged 25 to 34.
Platform crackdowns and the backlash
Enforcement has produced friction rather than retreat. Following YouTube's ad-blocker crackdown, traffic to ad-blocker help and workaround pages spiked 336% in the following month, per an All About Cookies survey of 1,000 US YouTube users cited in the same eMarketer report. Only 11% of surveyed users said the crackdown made them less likely to use a blocker; 22% said it made them more likely to seek out ad-blocking workarounds, and most remained unwilling to pay for YouTube Premium as an alternative.
The longer growth curve explains why crackdowns keep producing backlash instead of retreat. Backlinko's compiled historical data shows global ad-blocking users climbing from 44 million in Q1 2012 to 1.77 billion by Q2 2025 on GWI's measurement methodology - a 40x increase over roughly 13 years, with only one meaningful dip (2021 to 2022) in an otherwise steady climb. Measured this way, 29.5% of internet users worldwide use an ad blocker at least sometimes, and American usage sits close behind the global figure at 32.5%.
| User response to the YouTube ad-blocker crackdown | Share |
|---|---|
| Traffic to ad-blocker help pages, month after crackdown | +336% |
| Said the crackdown made them less likely to use a blocker | 11% |
| Said the crackdown made them more likely to seek a blocker | 22% |
Structural shifts are compounding the enforcement problem: extension-based blocking is giving way to browser-level blocking, which is far harder for a platform to detect and counter. Brave, which blocks ads and trackers by default, surpassed 100 million monthly active users in October 2025. For teams planning paid social distribution or evaluating a channel's real ROI, native and contextual ad formats integrated into content feeds carry lower reported blocking rates than standard display units served through third-party ad networks, though exact bypass rates are difficult to verify independently.
What marketers should do about it
Three practical implications follow from the data above. First, measurement gaps compound: ad blockers frequently block analytics scripts alongside ads, so blocked-traffic estimates should be treated as a floor, not a ceiling, when auditing campaign reach. Second, vertical matters more than geography - a B2B software or developer-tool brand should assume block rates well above the global average, not the 28-30% headline figure. Third, native and owned-channel formats (email, organic social, first-party content) are structurally more block-resistant than third-party display and should carry more weight in a channel mix that already accounts for blocked reach. Anyone auditing a paid media plan against these numbers should model blocked reach by vertical before finalizing channel budgets, not after seeing a reach shortfall in reporting.
What ad blocking does to measurement, not just revenue
The revenue loss is the visible half of the problem; the measurement gap is the half most teams never audit. Ad blockers typically block analytics tracking scripts alongside the ad calls themselves, which means a site's own dashboards understate both blocked ad revenue and blocked-visitor behavior at the same time. A campaign report showing strong reach and a thin conversion tail may simply be missing the third of the audience that never fired a single tracked event - not underperforming with the audience it can see, but blind to a meaningful slice of the audience it's actually reaching.
This compounds with the analytics-tool problem specifically: server-side and first-party tracking setups are structurally more resistant to blocking than client-side, third-party pixel-based tracking, because a blocklist rule targets known ad-tech domains and script patterns rather than a brand's own server. Teams relying on first-party measurement should expect a materially smaller reporting gap between raw traffic and tracked traffic than teams relying entirely on third-party pixels, particularly on the developer, B2B software and finance verticals where blocked-traffic share already runs 25-60% before the measurement gap is even considered.
The practical fix is a short audit, not a new tool purchase: compare raw server log pageviews against analytics-platform sessions for the same date range. A gap in the 15-40% range, consistent with the industry ranges documented above, points to blocked measurement rather than a real traffic drop, and should change how a team reads a dip in reported conversions before it changes budget.
Frequently Asked Questions
How many people block ads globally in 2026?
An estimated 1.1 billion people used an ad blocker across desktop and mobile in Q4 2025, per eyeo's 2026 Ad-Blocking Report - about 30% of the total internet population and a 13% increase since eyeo's 2023 report. That total splits into 448 million desktop users (down 4% since 2023) and 629 million mobile users (up 27% since 2023), showing where the growth is actually happening.
Is ad blocking growing or shrinking?
Both, depending on which number you look at. The overall ad-block rate - blockers as a share of all internet users - has declined for years (from 38.4% down to 28.8% over the period eyeo tracks) simply because total internet adoption grew faster than blocker adoption. But the absolute count of blockers keeps rising, mobile blocking specifically grew 27% since 2023, and blocker growth in lower- and middle-income countries (+23%) is now offsetting a decline in higher-income markets (-14%).
Which industries lose the most traffic to ad blockers?
Technical and privacy-conscious audiences block at far higher rates than the global average. Developer tools and SaaS sites see an estimated 40-60% of traffic blocked, B2B software and enterprise sites 30-50%, and finance/fintech sites 25-35% - all well above the roughly 28-30% global baseline, driven by higher adoption of uBlock Origin and Brave among technical users.
What does a blocked pageview cost a publisher?
It scales directly with pageviews, RPM and block rate. Using a worked 2026 example: a site with 4 million monthly pageviews, a $2.40 RPM and a measured 38% ad-blocker rate loses roughly $43,776 a year in blocked-pageview revenue (pageviews x RPM x block rate x 12 / 1,000). Most publishers underestimate their real exposure because standard analytics only count an impression once the ad script loads - a blocked pageview looks like "no impression," not "blocked impression."
Is mobile ad blocking really lower than desktop?
Not anymore, in practice. Most site owners assume their mobile block rate sits around 8-15%, but properly instrumented measurement puts the real figure closer to 30-60% depending on vertical and traffic source - the blended 2026 mobile rate across one large publisher network measured 34%. The gap exists because standard analytics undercount mobile blocking even more than they undercount desktop blocking.
Sources
eyeo, 2026 Ad-Blocking Report
DeBlocker, Cost of Ad-Blockers in 2026
DeBlocker, Mobile Ad Blocker Statistics 2026
Introtrace, Ad Blocker Statistics 2026
eMarketer, FAQ on Ad Blocking 2026
Backlinko, Ad Blocker Usage and Demographic Statistics 2026