



Table of contents

Web traffic statistics are useful only when an analyst can say what was counted, where it came from, and what happened next. This page treats traffic as an acquisition-and-quality measurement problem—not a contest to maximize visits.
Key Takeaways
- Contentsquare’s 2025 benchmark analyzed 90 billion sessions across 6,000 websites, comparing Q4 2023 with Q4 2024.
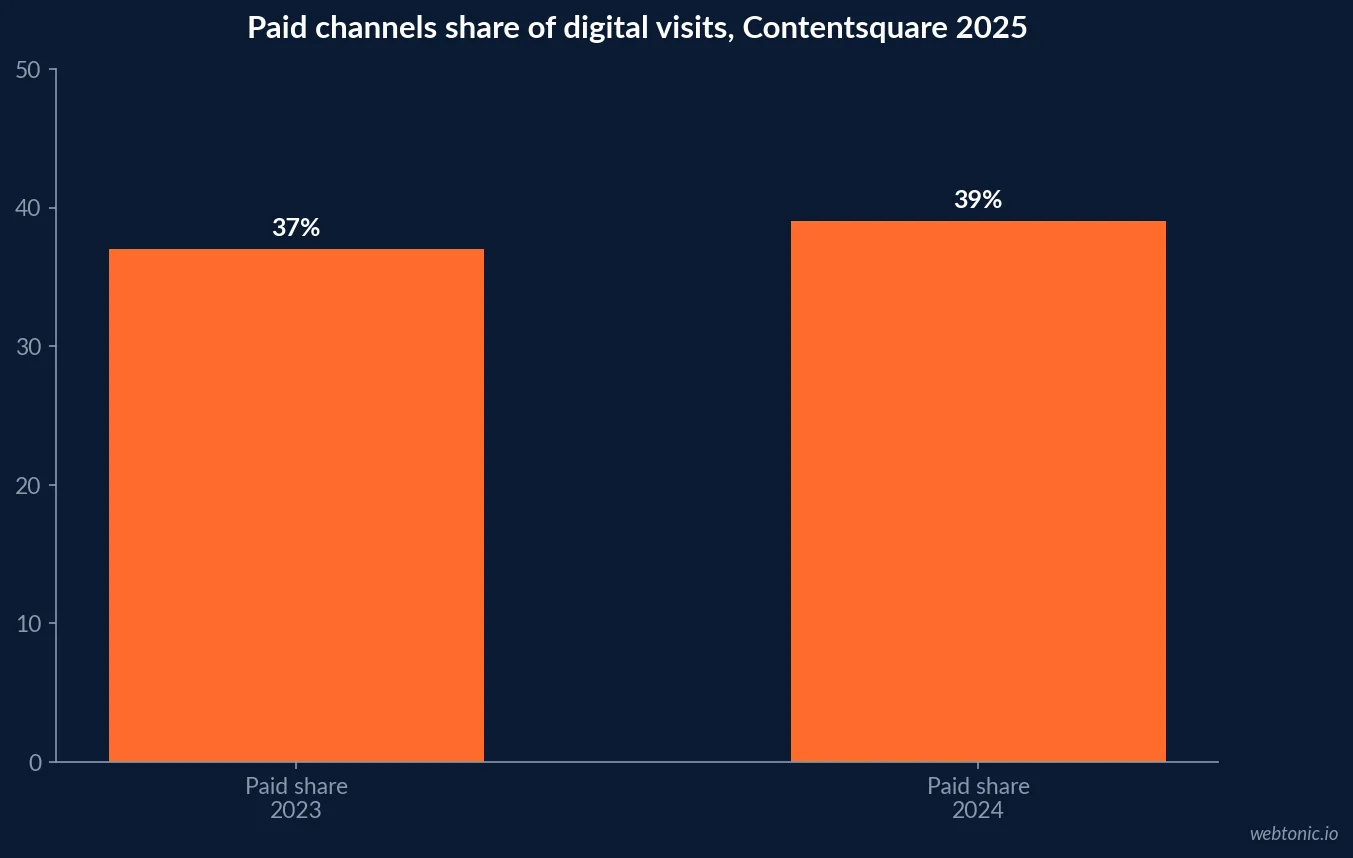
- Paid channels represented 39% of the analyzed 2024 traffic, up from 37% in 2023.
- Conversion rates declined 6.1% year over year in the same Contentsquare benchmark.
- Paid social traffic rose 12% while increased paid-social reliance correlated with weaker engagement outcomes.
- Google Analytics 4 calls a session engaged when it lasts over 10 seconds, includes a key event, or has at least two views.
- 53% exited after one page when slow-loading content was involved in the Contentsquare report.
- 40% of visits showed user-frustration signals in that report’s 2024 data.
- Similarweb’s 2025 benchmark covers 8,000 websites, eight sectors and nine channels.
- Compare like with like: business model, industry, traffic cohort, geography, device and acquisition mix.
- Track landing-page sessions, engaged-session rate, key-event rate, qualified leads and cost per qualified outcome as a connected chain.
- Use one consistent attribution view and annotate changes to consent, tagging, campaigns and site releases.
- Traffic growth is not proof of demand growth unless quality and outcomes improve too.
First define the unit: visit, user or page view
Teams often say “traffic” as if it were one stable number. It is not. A page view counts page-load events; a session groups interactions into a visit; a user is an analytics identity that may represent a person, device or modeled identity depending on settings. These units answer different questions. A rise in views could mean more visitors, more pages per visit, or repeated reloads.
Google Analytics 4 documents an engaged session as one that lasts longer than 10 seconds, includes a key event, or contains at least two page or screen views. Engagement rate is engaged sessions divided by sessions; bounce rate is the inverse. These definitions are valuable precisely because the platform makes them explicit. When comparing different analytics systems, write down each platform’s session timeout, identity method, consent behavior and event rules.
A sound dashboard labels the unit in every chart title. “Sessions, not people” is a small but consequential annotation. Keep users for reach questions, sessions for visit questions, page views for content consumption, and key events for actions. Don’t add users and sessions together or use page views as a proxy for demand.
Separate visits from unique visitors when you use an analytics vendor’s dashboard: Adobe Analytics defines visits as sessions and page views as tracked page view calls, while Matomo distinguishes unique visitors from visits. The labels are similar across products, but their identity and session rules can differ.
What the broad benchmarks actually say
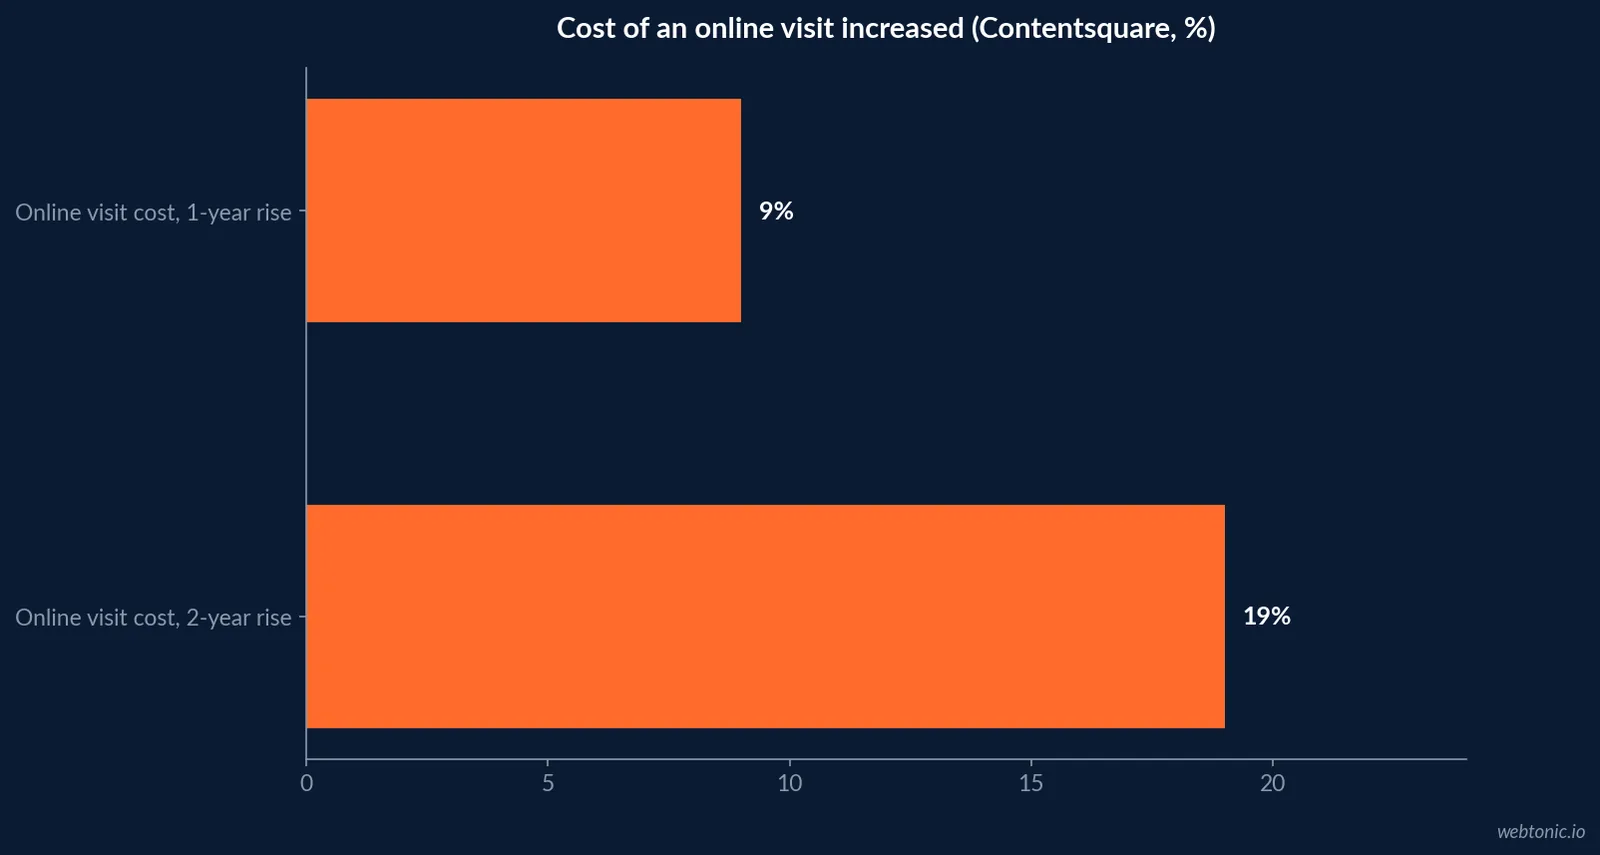
Benchmarks set context; they do not supply a target for every business. Contentsquare’s January 2025 release says its benchmark examined more than 90 billion sessions and 389 billion page views across 6,000 websites, comparing Q4 2023 and Q4 2024. In that 2024 dataset, online visit cost rose 9%, conversion rate fell 6.1%, and paid-channel share moved from 37% to 39%. Paid social traffic increased 12%. These figures describe a broad cross-site dataset, not an expected result for a particular brand.
Similarweb’s 2025 Marketing Benchmark Report presents a different lens: 8,000 websites across eight sectors and nine channels. It emphasizes segment and channel mix rather than an all-market “good traffic” threshold. Its companion traffic guide separates giant sites, challengers and up-and-comers, making cohort context visible. This distinction matters: traffic distribution among market leaders can be structurally unlike the pattern for a small or emerging site.
| Benchmark signal | Published value | Dataset and period | How to use it |
|---|---|---|---|
| Paid-channel traffic share | 39%, up from 37% | Contentsquare 2024 data; published 2025 | Compare mix, not only total visits |
| Conversion-rate movement | −6.1% YoY | Contentsquare 2024 data; published 2025 | Audit outcome quality beside volume |
| Paid social traffic movement | +12% | Contentsquare 2024 data; published 2025 | Test landing-page fit and intent |
| Scale of benchmark | 8,000 sites; 8 sectors; 9 channels | Similarweb 2025 report | Choose a comparable market cohort |
| Frustration incidence | 40% of visits | Contentsquare 2024 data; published 2025 | Pair acquisition data with UX signals |
Acquisition: measure source mix, not a single traffic total
Break sessions into a stable channel taxonomy: organic search, paid search, paid social, organic social, referral, email, display, direct and unassigned. Then inspect campaign and landing-page detail within each. A source label is a classification, not a causal explanation. “Direct” may contain unattributed visits, and referral traffic can reflect partner links, publications or payment flows. Preserve UTMs on campaign links and exclude internal traffic so the report can distinguish deliberate activity from classification noise.
Contentsquare observed paid traffic’s share increasing to 39% in 2024, while Similarweb’s 2025 benchmark makes channel comparisons a central feature across nine channels. Neither finding says paid traffic is inherently better or worse; it makes mix an essential denominator. If total sessions grow because one campaign expands, ask whether the new cohort meets the same quality threshold as the previous one.
Search Console and analytics also answer different questions. Search Console records Google Search impressions and clicks; analytics records observed on-site events. A click is not guaranteed to become a measured session, because consent, redirects, load failures and tagging can interrupt the path. Keep both views rather than forcing them to match exactly.
| Acquisition view | Primary unit | Question answered | QA check |
|---|---|---|---|
| Channel group | Sessions | Which sources drive visits? | Check UTMs and unassigned share |
| Landing page × source | Sessions and key events | Which entrances bring useful visitors? | Separate paid/organic and device |
| Search Console query/page | Clicks and impressions | How does Google Search visibility change? | Compare clicks to analytics sessions directionally |
| Referral domain | Sessions and outcomes | Which partners or citations send traffic? | Exclude payment and self-referral domains |
| Campaign | Sessions and conversions | Did the campaign produce qualified action? | Verify naming and conversion tracking |
Engagement: distinguish a short visit from a failed visit
High bounce is not automatically failure, just as long duration is not proof of success. A visitor who reads an answer and leaves may have completed the task; a long session may indicate confusion. GA4’s engaged-session definition helps standardize a first signal, but analysts still need task-specific events such as quote requests, bookings, downloads, product comparisons or contact clicks.
Contentsquare’s 2025 benchmark reported 40% of visits had frustration signals and that slow-loading content contributed to 53% of users exiting after one page. Its analysis also found sites increasing session depth by at least 10% saw an average 5.4% lift in conversion. These are associations across the study dataset, not a universal causal promise. Use them to justify looking at experience data alongside acquisition data, then validate changes on your own site.
Segment engagement by device and landing page. An all-site rate can conceal a mobile performance issue or a single campaign page with a poor message match. Track page speed, error exits, rage clicks or equivalent behavioral diagnostics if available, but don’t treat tool-specific frustration metrics as interchangeable with GA4 events.
Conversion: define the event before calculating a rate
“Conversion rate” can mean purchases divided by sessions, leads divided by users, or qualified leads divided by landing-page visits. Publish the numerator and denominator alongside the percentage. For a lead-generation site, distinguish a form submission from a sales-accepted lead; for ecommerce, separate checkout completion from revenue and margin. A conversion percentage without that definition is a number that cannot be reproduced.
When Contentsquare reported a 6.1% decline in conversion rate between 2023 and 2024, that movement was meaningful for the dataset under its methodology. Your own trend may be different. Compare periods with equivalent seasonality, campaign maturity, geography, consent coverage and event instrumentation. If the mix changed, calculate rates by source and device before reading the blended result.
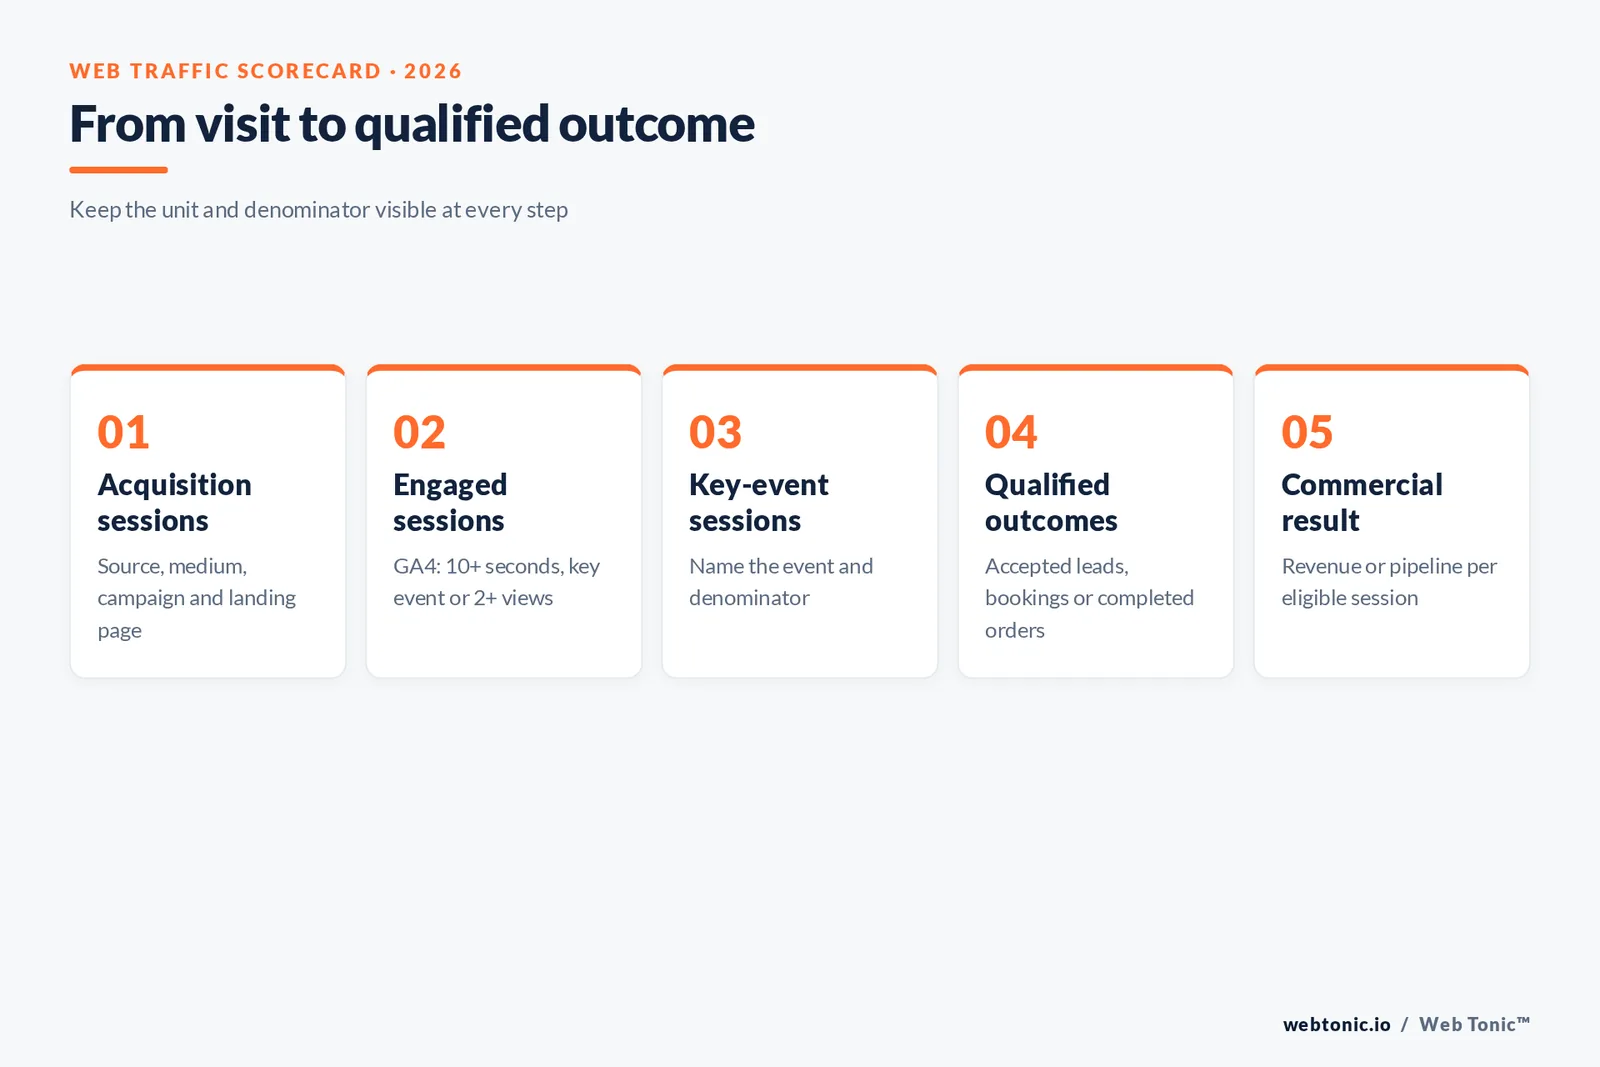
Use a short funnel: eligible sessions → engaged sessions → key-event sessions → qualified outcomes → revenue or pipeline. This lets the team see where the loss occurs. The optimization should follow the weakest verified stage, rather than a generic request for “more traffic.”
| Stage | Example measure | Denominator to state | Useful interpretation |
|---|---|---|---|
| Acquisition | Sessions by source | All measured sessions | Volume and mix |
| Quality | Engaged-session rate | Sessions | Visits meeting engagement rule |
| Action | Key-event rate | Sessions or users—choose one | Action prevalence |
| Lead quality | Sales-accepted lead rate | Submitted leads | Qualification, not just form fill |
| Commercial result | Revenue or pipeline per session | Eligible sessions | Business contribution |
How to read traffic benchmarks without false comparisons
Build peer groups before comparing numbers: same industry or category, similar audience geography, comparable scale, similar business model and the same period. Similarweb’s 2025 material explicitly benchmarks eight sectors and traffic cohorts; its website-traffic guide separates leading sites from challengers and up-and-comers. That is a better starting point than comparing a niche B2B service firm with a global retailer.
For internal comparisons, use the same month or season from the prior year, report absolute and percentage change, and mark known campaign or release events. For external tools, distinguish measured first-party data from modeled estimates. Third-party competitor traffic is an estimate and should not be reported as audited fact about a competitor. Write the source, methodology and date beside the value.
Do not chase an industry median if your purpose, conversion economics or local demand differ. A benchmark is a prompt to ask why you diverge. It is not a quota.
Data quality: make instrumentation changes visible
A sudden step change can be a tagging issue. Maintain an event dictionary with each event name, owner, trigger, parameters, destination and business use. Run a test after changes to tag managers, consent banners, domains, checkout flows and campaign templates. Confirm the events arrive once—not zero times or twice—and that the same event is not firing for a page load and a button click.
Consent changes may alter the observable audience; blockers and browser privacy controls may suppress events. Document these limitations rather than implying that analytics captures every visit. Maintain a small quality panel: sessions by channel, unassigned share, key events by device, duplicate-event checks, referral exclusions and tag-health status. Annotate migrations and site releases on the trend line so analysts do not confuse instrumentation with user behavior.
Google’s documentation is the right authority for its metric definitions; Search Console documentation is the right place to understand search impressions and clicks. The practical discipline is to keep those datasets complementary and traceable.
A weekly web traffic scorecard for operators
For a weekly readout, keep the front page short: sessions versus the matched comparison period; channel mix; engaged-session rate; key-event rate; qualified-lead or order count; and top landing pages by qualified outcome. Add device splits and annotations only when they help explain movement. A useful scorecard leads with the decision: hold, investigate, or change something.
For a monthly review, include channel costs, conversion quality, retention or return visits where relevant, and a cohort view. For SEO specifically, assess visibility and landing-page outcomes together. Our data intelligence service is relevant when event definitions and reporting need a durable home; see our growth marketing work for channel planning and our team background for context. Further reading: campaign strategy and agency evaluation.
Interpret the 2025 signals as questions, not predictions
The broad statistics point toward three practical questions. First, has acquisition become more expensive or simply shifted channels? Contentsquare reported visit cost rising 9% and paid traffic taking a larger share in its 2024 data. Second, did the new visits meet user needs? The report tied paid social growth to higher bounce and lower conversions for businesses increasing reliance on that channel. Third, did the website experience make it harder to complete a task? Frustration and slow-load exits point to experience work that sits downstream of marketing.
Those observations are reasons to diagnose, not evidence that any one channel caused your result. Review your own cohorts and use experiments for causal claims. When the team can reproduce the definitions and explain the movement, web traffic statistics become an operating instrument rather than a vanity metric.
Separate field experience from analytics traffic
Traffic reports show measured visits; real-user experience datasets describe how users experience page performance. Google’s Chrome User Experience Report aggregates Chrome users’ field experience and reports Core Web Vitals such as LCP, INP and CLS. It is not a traffic-counting system, but pairing its page-quality signals with landing-page sessions helps analysts test whether poor performance coincides with lower engagement.
Microsoft Clarity documents session recordings and filters for source, medium, campaign, device and bot traffic. Treat recordings as behavioral evidence from the configured project, not a census of every site visitor. Contentsquare’s 2025 benchmark found 40% of visits carried frustration signals and reported a 22% reduction in load-time frustration among digitally disciplined organizations. These are its own dataset definitions and should not be mapped one-for-one to another tool’s metrics.
Track the 6.1% conversion decline beside channel mix, not in isolation; 39% paid share is a traffic-mix observation, not a paid-media target; and 90 billion sessions is sample scale, not a business-specific forecast.
Contentsquare also reported paid-social-heavy businesses saw 9.2% higher bounce rates, 8.7% fewer page views, and 10.6% lower conversions. It further reported 9% higher cost per visit in 2024 and a 19% rise across two years. Treat these as associations and dataset findings, not expected results for an individual site.
Pair performance with sessions rather than declaring a Core Web Vitals or behavioral signal to be traffic data. The Chrome UX Report, Microsoft Clarity and Contentsquare explain different evidence layers; use each for its own purpose and state the window and coverage.
| Data layer | Example source | What it measures | How to combine |
|---|---|---|---|
| Analytics sessions | GA4 or equivalent | Observed tagged activity | Segment by source and page |
| Search exposure | Google Search Console | Search impressions and clicks | Compare trends directionally |
| Field experience | Chrome UX Report | Real-user web performance | Pair page-quality change with outcomes |
| Behavior diagnostics | Clarity / Contentsquare | Configured session behavior signals | Use to investigate friction |
| Business system | CRM or ecommerce platform | Qualified outcome and value | Reconcile to analytics events |
| Watch item | 2025 / platform reference | Analyst action |
|---|---|---|
| Conversion movement | −6.1% in Contentsquare 2024 dataset | Split by source, page and device |
| Paid share | 39% in Contentsquare dataset | Review quality, not just volume |
| Frustration | 40% of visits in same report | Inspect page-level friction |
| Field quality | CrUX uses real-world Chrome data | Check coverage and period |
| Bot filtering | Clarity documents bot exclusion controls | Record tool configuration |
FAQ
What is the most useful web traffic metric?
There is no single winner. Start with sessions for visit volume, users for audience reach, landing-page sessions for acquisition quality, and key-event conversion rate for business outcome. Google Analytics 4 defines an engaged session as one lasting longer than 10 seconds, containing a key event, or having at least two page or screen views. The metric is useful only when its unit, date range and attribution rules are explicit.
How many website visits should a business get?
There is no defensible universal target. Similarweb’s 2025 benchmarking work separates websites by sector and traffic cohort, while Contentsquare’s 2025 study covers 6,000 websites and 90 billion sessions. A smaller business should compare itself with peers of similar category, scale, market and model, then use its own qualified-visit trend as the operating baseline.
Why can traffic rise while leads fall?
More sessions can arrive from lower-intent channels, mobile journeys can introduce friction, or measurement and consent changes can alter observed events. Contentsquare reported that paid channels generated 39% of traffic in its 2024 dataset while conversions fell 6.1% year over year. Segment landing pages, device, source and conversion events before attributing the gap to one cause.
What is the difference between users and sessions?
A user is an identified or estimated person/device identity under the analytics system’s rules; a session is a visit period. One person can produce multiple sessions, and identity stitching, consent settings and cookie deletion can affect user counts. Use sessions to explain visit volume and users for reach, while documenting the platform’s identity model.
Sources
Contentsquare, 2025 Digital Experience Benchmarks release
Similarweb, 2025 Marketing Benchmark Report
Google Analytics Help, engagement rate and bounce rate definitions
Google Search Console Help, performance report
Google Analytics GA4 developer documentation
Microsoft Clarity, session recordings overview
Chrome UX Report, dataset overview
Adobe Analytics, visits and page views
Matomo, visits and unique visitors


