Table of contents

Webflow powers about 1.2% of CMS-detected websites while the average financial advisor site scores 59 out of 100 on PageSpeed. Those two facts are the whole platform debate in wealth management: the tooling most advisory firms complain about is not the tooling most of the web uses, and the failures costing them clients are front-end failures a managed platform standardises away. Here is the 2026 data.
Key Takeaways
- Webflow holds a 1.2% CMS market share and 0.8% of all websites, roughly 493,000 active sites.
- Live Webflow sites grew from 320,617 in early 2024 to about 493,226 by 2025, a 54% increase.
- WordPress still holds 61.3% of the CMS market and 43.6% of all websites.
- Webflow CMS share rose from 0.9% in 2022 to 1.2%, about a 10% compound annual growth rate.
- 20,378 companies now run Webflow Ecommerce, up from 12,501 in Q2 2024.
- The average advisor site scores 59/100 on PageSpeed, with only 17.6% in the 90-100 band.
- Advisor LCP averages 10.7 seconds while TTFB averages 0.05 seconds - a pure front-end failure.
- Average advisory conversion is 0.5% to 1.5% versus 3% to 8% on optimised sites.
- Advisor form submissions rose 110% while traffic rose 10.3% across a 9,000-advisor dataset.
- Over 3.5 million designers and teams across 190 countries use the platform, with 100,000-plus paying customers.
Where Webflow actually sits in the market
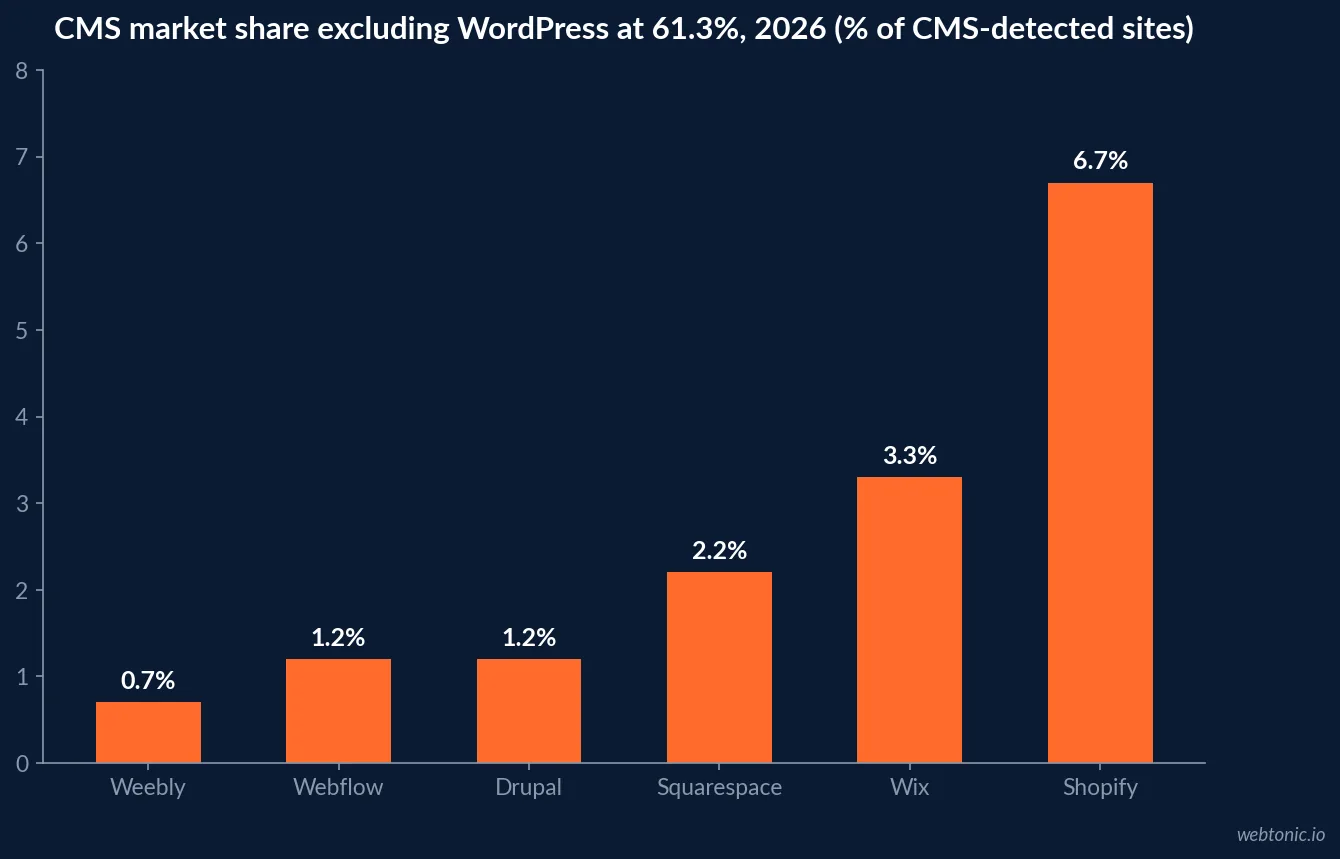
Perspective first, because vendor enthusiasm distorts this badly. W3Techs data puts Webflow at 1.2% of websites with a detectable CMS and 0.8% of the web overall - the same CMS share as Drupal, and a fraction of WordPress. A firm choosing Webflow is choosing a small, design-led ecosystem, not an industry default.
| Platform | CMS market share | Share of all websites | Primary strength |
|---|---|---|---|
| WordPress | 61.3% | 43.6% | Plugin ecosystem and talent supply |
| Shopify | 6.7% | Not reported | Commerce |
| Wix | 3.3% | Not reported | Beginner ease |
| Squarespace | 2.2% | Not reported | Template design |
| Webflow | 1.2% | 0.8% | Visual control with clean output |
| Drupal | 1.2% | Not reported | Enterprise complexity |
| Weebly | 0.7% | Not reported | Legacy simplicity |
Growth is the more interesting series. Webflow moved from 0.25% of all websites in 2021 to 0.4% by 2022 and 0.8% by 2025, with CMS share climbing 0.9% to 1.2% over the same window - roughly 10% compound annual growth. Website-builder market share tracking shows the same pattern across the visual-builder category: small absolute numbers, consistent share gains against hand-coded and legacy-CMS sites.
The advisory website problem Webflow is sold against
Platform choice only matters if it fixes something measurable. Diagnostics on 254 US financial advisor websites found an average PageSpeed score of 59 out of 100, an average Largest Contentful Paint of 10.7 seconds and an average Time to First Byte of 0.05 seconds. Servers answer instantly; browsers then spend ten seconds assembling the page.
| Measure | Advisor site average | 2026 standard | Verdict |
|---|---|---|---|
| Mobile PageSpeed score | 59 / 100 | 85 or better | Fails |
| Largest Contentful Paint | 10.7s | Under 2.5s | Fails badly |
| Time to First Byte | 0.05s | Under 0.80s | Passes |
| Sites in the 0-49 PageSpeed band | 38.7% | Target: zero | Structural problem |
| Sites in the 90-100 band | 17.6% | Where you want to be | Minority advantage |
| JSON-LD structured data present | 57.3% | 100% | Cheap gap |
Sector guidance for 2026 sets the bar at a mobile PageSpeed score above 85, which fewer than one in five audited advisory sites clears. The diagnostic value of the TTFB number cannot be overstated: it proves the problem is what the page loads, not where it is hosted. That is precisely the class of problem a managed visual platform reduces by default - no plugin sprawl, no abandoned theme, image optimisation and CDN delivery included rather than configured.
Conversion is the bigger prize
Speed is a ranking and bounce issue. Conversion design is where the money is. Advisory conversion analysis puts the average advisor site at 0.5% to 1.5% and conversion-optimised sites at 3% to 8% - three to five times more leads from the same traffic. The converting pattern is consistent: a niche-specific headline, an embedded booking calendar instead of a contact form, credentials and assets under management above the fold, compliant social proof, and a mobile-first build scoring 85-plus.
| Traffic per month | At 1.0% conversion | At 4.0% conversion | Extra enquiries |
|---|---|---|---|
| 1,000 visits | 10 leads | 40 leads | +30 |
| 2,500 visits | 25 leads | 100 leads | +75 |
| 5,000 visits | 50 leads | 200 leads | +150 |
| 10,000 visits | 100 leads | 400 leads | +300 |
Aggregate industry data now supports the same priority. A report drawing on anonymised data from more than 9,000 advisors found website form submissions increased 110% between 2024 and 2025 while overall website traffic rose just 10.3%. Investors are arriving pre-researched and converting faster, so the site's job has shifted from explaining to enabling - which is a design and build brief, not a content-volume brief.

Platform momentum: the commerce signal
The clearest evidence of platform maturity is the module nobody expected to grow. Active Webflow Ecommerce domains went from 1,598 in 2020 to 11,950 in 2023, 12,501 by Q2 2024 and 20,378 in a March 2026 crawl of 50 million-plus domains - growth well ahead of the platform's roughly 10% overall CAGR. Wealth management firms do not sell products, but the read-across matters: a platform whose structured-data-heavy commerce module is compounding is a platform investing in the CMS layer advisory content programmes depend on.
| Year | Active Webflow Ecommerce domains | Change |
|---|---|---|
| 2020 | 1,598 | Baseline |
| 2023 | 11,950 | +647.8% from 2020 |
| Q2 2024 | 12,501 | +4.6% |
| 2026 | 20,378 | +63.0% from Q2 2024 |
The honest migration decision
Most advisory firms do not need a re-platform, they need the front end fixed - and a migration is a convenient way to force that work through. The distinction matters because migration carries risk: URL changes, lost internal links, and a compliance re-review of every page. Use a threshold test rather than a preference.
| Condition | Migration justified? | Reasoning |
|---|---|---|
| Mobile PageSpeed below 70 | Yes, contributing factor | 73% of advisor sites sit here |
| Marketing cannot publish without a developer | Yes, strongest single reason | Publishing speed compounds |
| Active content programme needing a CMS | Yes | Collections beat one-off pages |
| Site is fast but converts poorly | No | Fix design and offer first |
| Deep third-party integrations in place | Usually no | Integration cost can exceed the gain |
| In-house maintenance capacity exists | No | Optimise the current stack |
Two technical footnotes from the advisor audit set the context. WordPress appeared in 8.0% of detected technologies and jQuery Migrate in 7.1% - the latter is a compatibility shim for deprecated code and a reliable marker of a theme that has not been rebuilt in years. HTTP/3 adoption reached only 8.2%, meaning most advisory sites are not using transport-layer gains that arrive free with a modern managed platform or CDN.
Build requirements for a regulated site
Whatever platform a firm lands on, the requirement list for wealth management is unusually strict, and it is the requirement list - not the logo on the CMS - that determines results.
| Requirement | Why it matters in wealth management | Status across the industry |
|---|---|---|
| Mobile PageSpeed 85+ | YMYL rankings and bounce control | 17.6% of sites clear 90+ |
| JSON-LD for firm and advisers | Credential signals for search and AI answers | 57.3% publish any |
| Embedded booking, not a contact form | Cuts steps between interest and meeting | Uncommon |
| Archivable page versions | Compliance recordkeeping | Platform dependent |
| Accessible forms and contrast | Regulatory and usability exposure | Frequently failed |
| Unique titles per service page | Prevents cannibalisation | 71.8% have duplicates |
Structured data deserves the emphasis. In a category where Google leans hard on entity and credential signals, only 57.3% of audited advisor sites publish any JSON-LD - so correct FinancialService, Person and FAQPage markup remains a differentiator rather than table stakes, and it is the machine-readable layer AI answer engines parse when deciding which firm to name.
Cost of ownership, not sticker price
Platform comparisons usually stop at the subscription line, which is the smallest number in the calculation for an advisory firm. The expensive items are developer dependency, compliance review cycles and the slow accumulation of plugin debt - all of which show up in the audit data as speed and duplicate-metadata failures rather than as invoices.
| Cost line | Legacy CMS reality | Managed visual platform | Who feels it |
|---|---|---|---|
| Publishing a new service page | Developer ticket, days | Marketing edits, same day | Marketing |
| Security and plugin updates | Ongoing, unbudgeted | Handled by the platform | Operations |
| Performance regressions | Return with every plugin | Constrained by the builder | SEO |
| Compliance re-review | Page-by-page, manual | Templated and repeatable | Compliance |
| Theme or template rebuild | Every 3-5 years | Design system evolves in place | Leadership |
This is why the strongest migration argument in the audit data is not speed at all. Firms with 71.8% duplicate title rates and 42.7% missing sitemaps are not suffering from bad hosting - they are suffering from a publishing workflow nobody owns. A platform change fixes that only if the workflow is redesigned alongside it, which is the part most rebuild proposals leave out.
How we approach advisory site rebuilds
The sequence that works is measure, fix, then migrate only if the fix is blocked by the platform. Our performance creative team builds the conversion layer - headline, proof, booking path - while our growth marketing team handles the technical and content sequencing, and our data intelligence practice instruments booked meetings so a rebuild can be judged on outcomes rather than aesthetics. For adjacent reading, our paid media pricing guide shows what a faster, better-converting site does to acquisition cost.
Frequently Asked Questions
How many websites use Webflow in 2026?
Webflow holds a 1.2% share of websites where a CMS can be detected and about 0.8% of all websites, which works out to roughly 493,000 active sites - up from 320,617 in early 2024. The platform reports more than 3.5 million designers and teams across 190 countries and over 100,000 paying customers. CMS share has grown from 0.9% in 2022 to 1.2%, a compound annual growth rate of about 10%, so the trajectory is steady rather than explosive.
Is Webflow better than WordPress for a financial advisor website?
It is better at the specific failure mode advisors have. Audits of 254 US advisor sites found an average Largest Contentful Paint of 10.7 seconds against a Time to First Byte of 0.05 seconds, meaning the hosting is fine and the front end is not - plugin stacks, legacy themes and render-blocking scripts. A managed visual platform removes plugin sprawl and ships a CDN by default. WordPress remains the stronger choice when a firm needs deep third-party integrations or already has in-house maintenance capacity.
What should a wealth management website score on PageSpeed?
Above 85 on mobile is the working standard for 2026, and above 90 puts a firm in the top band. The measured reality is a 59 out of 100 average across audited advisor sites, with 38.7% in the critical 0-49 band and only 17.6% reaching 90-100. Because the same audit shows server response times passing comfortably, most of that gap is compressible images, deferred scripts and fewer third-party embeds rather than a hosting upgrade.
How much does website performance affect advisory lead volume?
Directly and measurably. The average advisor site converts 0.5% to 1.5% of visitors into a lead, while conversion-optimised advisory sites reach 3% to 8% - a three-to-five-times difference on identical traffic. Aggregate platform data from more than 9,000 advisors shows website form submissions rising 110% between 2024 and 2025 while traffic rose only 10.3%, which confirms the constraint is conversion design, not audience size.
Is a Webflow migration worth it for an RIA?
It is worth it when three conditions hold: the current site scores below 70 on mobile PageSpeed, the marketing team cannot publish a page without developer help, and there is a real content programme that needs a CMS. If any of those is absent, a targeted performance and conversion project on the existing platform usually returns more per dollar. Migration buys publishing speed and a maintenance floor, not rankings by itself.
The verdict
Webflow is a 1.2% CMS share platform growing at about 10% CAGR with roughly 493,000 live sites - a credible choice, not an obvious one. The case for it in wealth management rests entirely on the failure pattern in the data: 10.7-second LCP against a 0.05-second TTFB, 59/100 average PageSpeed, only 17.6% of sites in the top band and conversion stuck at 0.5% to 1.5% while optimised peers hit 3% to 8%. Fix the front end and the booking path first; migrate when the platform is what is blocking you. Talk to our team for a benchmark against this dataset.
Sources
Enricher - Webflow market share and platform statistics
Colorlib - website builder market share statistics 2026
Borah Labs - financial advisor website benchmarks, 254 sites
OJay Media - financial advisor website design that converts
Gemeos Agency - digital credibility standards for wealth management firms
Snappy Kraken via FinancialContent - advisor website form submissions up 110%
OJay Media - marketing KPIs for financial advisors
Dash SEO - complete SEO guide for RIA firms