Table of contents
74% of advisors say their technology is not fully integrated, and the fastest-growing firms use 65% of their tech stack against 52% for firms that did not grow at all. Wealth management does not have a dashboard shortage - it has a data-integration deficit that no dashboard can paper over. These 90+ data points cover reporting, business intelligence and marketing KPIs in advisory firms for 2026, and what to build first.
Key Takeaways
- 74% of advisors say their tech is not fully integrated, 72% say it needs an upgrade and 74% say they are not getting full value from current tools.
- Firms that grew fastest used 65% of their tech stack; flat firms used 52% - utilisation, not licences, separates them.
- Disconnected systems are advisors' top technology pain point, cited by 51%, and 88% of fee-based advisors would switch firms over poor technology.
- 63% of RIAs now use AI in some capacity, more than double the 2023 rate, but only 20% use it for digital marketing content.
- Only 27% of RIAs maintain a documented marketing plan, while documented-strategy firms acquire 67% more new clients.
- 56% of marketers lack time to analyse their data and 38% lack tools to integrate and report on it, while query result volumes rose 230% between 2020 and 2024.
- Automated reporting cuts manual analytics workload by 30% to 40% - the clearest return available in this layer.
The integration deficit under every dashboard
Advisory firms buy software enthusiastically and connect it reluctantly. The 2026 Connected Wealth Report and Orion's advisor research land on the same conclusion from different angles: the problem is not missing tools, it is tools that cannot see each other.
| Finding | Figure | Reporting consequence |
|---|---|---|
| Advisors saying technology is not fully integrated | 74% | Every dashboard reconciles by hand |
| Advisors saying their stack needs an upgrade | 72% | Reporting debt compounds |
| Advisors not getting full value from current tools | 74% | Paying for unused reporting modules |
| Disconnected systems as top technology pain point | 51% | Named by advisors themselves |
| Fee-based advisors willing to switch firms over poor tech | 88% | A recruitment and retention risk |
| Advisors saying AI will help their business | 74% | Appetite is not the constraint |
| Advisors naming automation of routine tasks as AI's top benefit | 57% | Reporting is the routine task |
| RIA practices identifying as heavy technology users | 27% | Highest of any advisor channel |
The last row is worth holding onto: independent RIAs are the most technology-intensive channel in the advisor universe, and even there only 27% of practices consider themselves heavy users. A reporting project in this industry is therefore an integration project first, a visualisation project second, and a governance project throughout.
Utilisation, not spend, tracks with growth
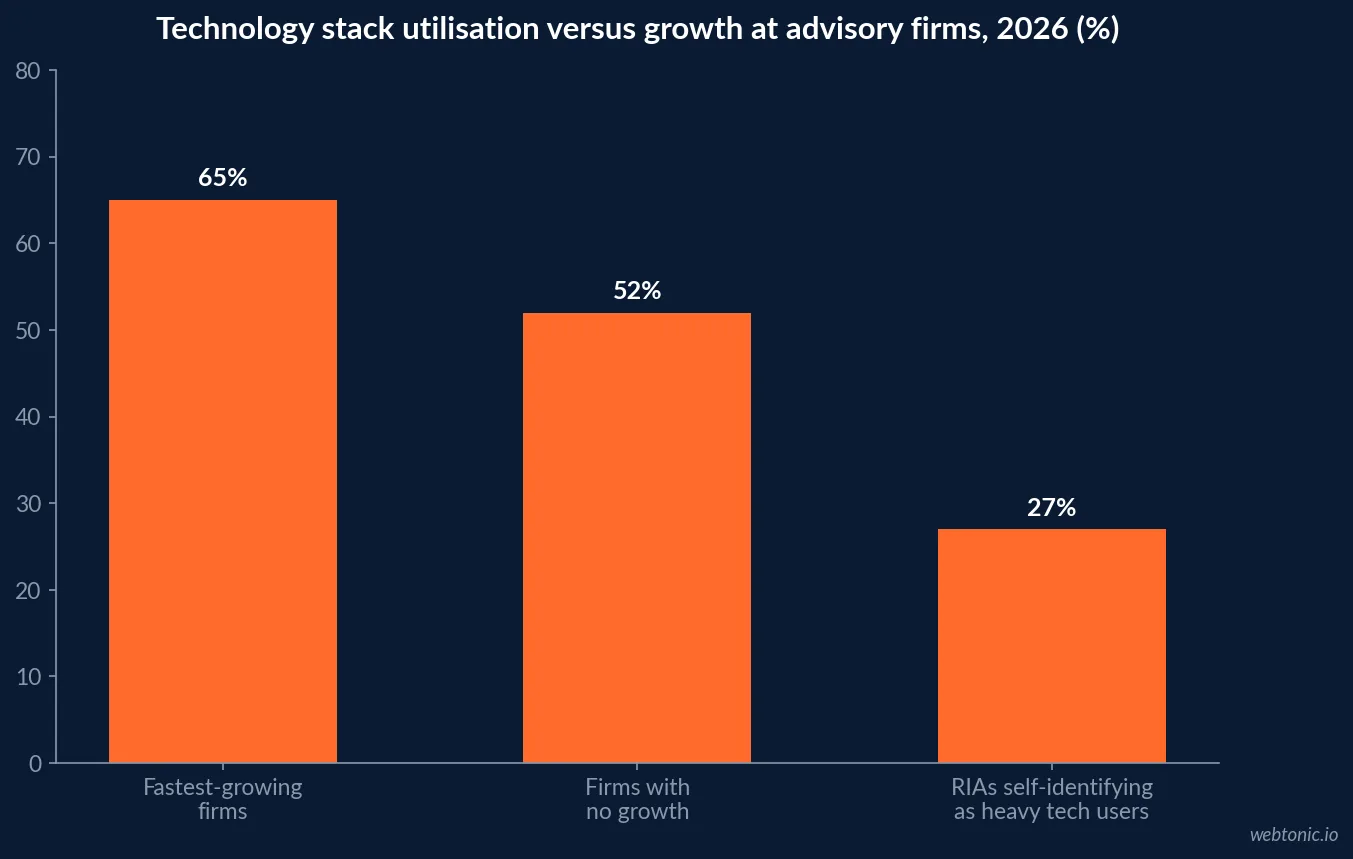
Orion's data provides the most quotable line in advisory technology this year: firms that grew fastest in 2025 used 65% of their technology stack, while firms that did not grow used 52%. That is a 13-point usage gap between growing and static firms, holding the software roughly constant.
| Growth input | Leaders | Laggards or average | Gap |
|---|---|---|---|
| Technology stack utilisation | 65% | 52% | 13 points |
| Documented marketing plan | Yes | Only 27% of RIAs overall | 67% more new clients |
| Documented client referral programme (USD 250M+ AUM) | 52% | 44% | 1.6x more new assets |
| Documented COI referral programme | 36% | 30% | Largest untapped source |
| Firms using social media | 78% | - | 51% also run email campaigns |
| Firms using AI for marketing content | 20% | - | Early-adopter window |
| Advisor hours spent on business development | 7% | 7% | Automation is the only lever |
The pattern repeats across every row: the differentiator is whether the activity is documented and instrumented, not whether it exists. Schwab's benchmarking data - self-reported by more than 1,200 firms representing over USD 2.4 trillion in assets - shows 78% of RIA firms using social media and 51% running email campaigns, which means almost every firm is generating marketing activity that some dashboard should be scoring.
The metrics that belong on an advisory dashboard
Most marketing dashboards in this industry report platform metrics because platform metrics are what the platforms export. The metrics that predict growth take more assembly and fewer screens.
| Layer | Metric | Benchmark or target | Why it earns the space |
|---|---|---|---|
| Pipeline | Enquiries by source, with self-reported source | Over 80% source coverage | Referrals leave no click trail |
| Pipeline | Discovery meetings booked | Lead-to-meeting 20-45% | The first real quality signal |
| Economics | Cost per qualified lead | ~USD 185 median paid CPL, wealth management | Raw CPL misleads |
| Economics | Blended acquisition cost including advisor hours | ~USD 3,800 average | 71% of it is staff time |
| Assets | New AUM funded per source | Average relationship USD 620K - 1.78M | The only outcome that pays fees |
| Assets | Time from first touch to funding | Months, not days | Sets the attribution window |
| Retention | Referral rate per client | 1.6x asset lift when documented | Cheapest growth |
| Retention | Next-generation coverage | 55% of heirs plan to leave | Forward-looking attrition |
| Efficiency | Manual reporting hours per month | -30 to -40% when automated | Directly recoverable |
Two of those benchmarks deserve a note. Average relationship size varies enormously by data source - Cerulli-implied figures land near USD 620,000 while the Schwab benchmarking population implies nearer USD 1.78 million - so a dashboard should show a firm's own distribution rather than an industry average. And 55% of next-generation heirs plan to leave their benefactor's advisor as USD 124 trillion transfers through 2048, which makes next-gen coverage a leading indicator rather than a soft metric.
Where the reporting hours actually go
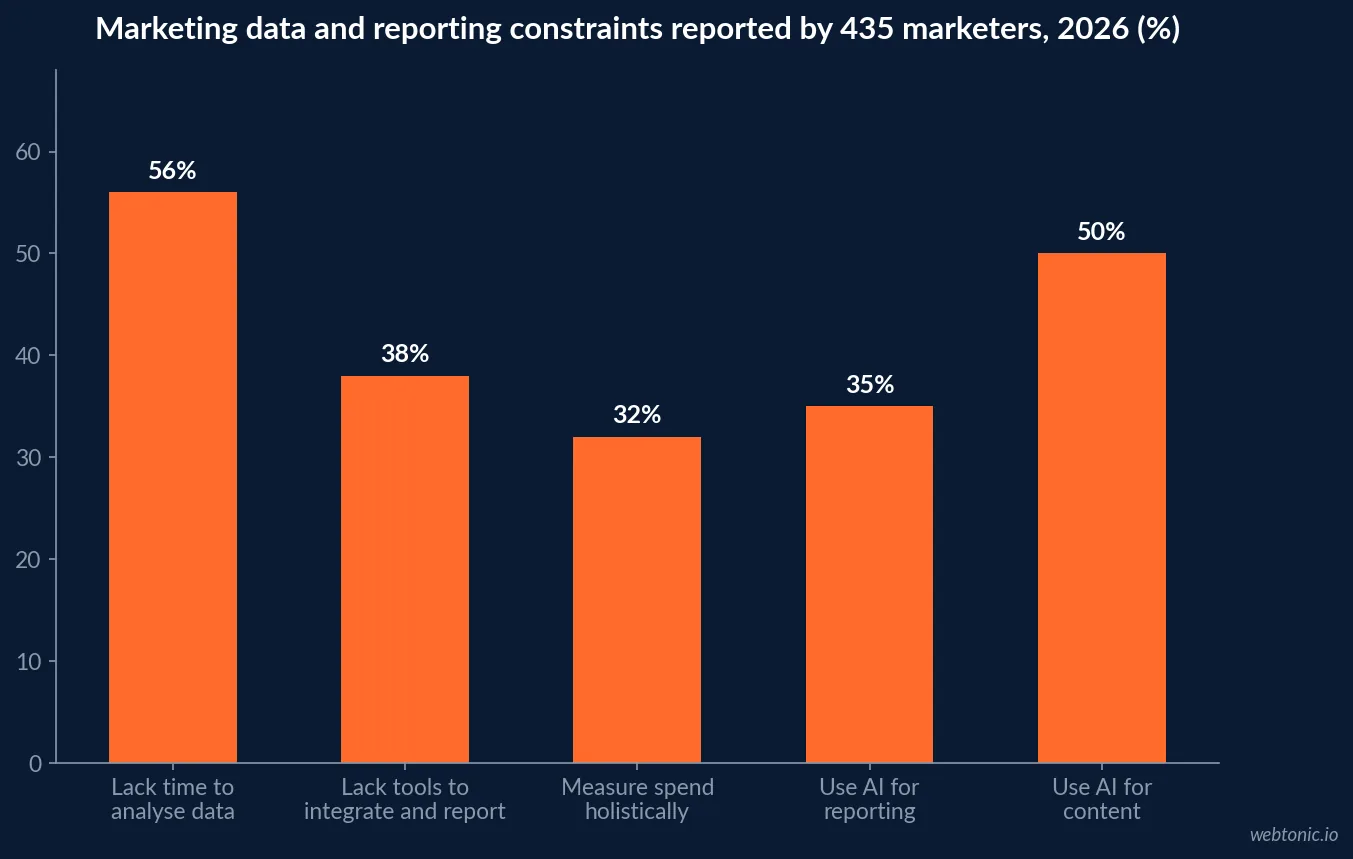
The cost of bad reporting is measured in hours, and the hours are documented. In a survey of 435 marketers, 56% said they lacked enough time to analyse data properly and 38% lacked the tools to integrate and report on it at all, while the average number of rows returned by marketing-data queries rose 230% between 2020 and 2024. More data, same headcount, no integration.
| Constraint | Figure | Fix that shows up in the numbers |
|---|---|---|
| Marketers lacking time to analyse data | 56% | Automate collection, not interpretation |
| Marketers lacking tools to integrate and report | 38% | One warehouse or one reporting layer |
| Measuring digital and traditional spend holistically | 32% | Add offline events to the model |
| AI used for content and copywriting | 50% | Highest-adoption use case |
| AI used for reporting and analytics | 35% | The gap worth closing this year |
| Reduction in manual analytics workload from automation | 30-40% | Recoverable advisor hours |
| Faster campaign optimisation cycles with attribution analytics | 20-30% | Compounding decision speed |
| Firms citing limited resources and advisor time | 83% | Design for a five-minute read |
The practical conclusion is unglamorous: automate the assembly, keep the interpretation human, and cap the dashboard at what a partner will actually read between client meetings. Firms that build reusable integration assets see 50% to 70% lower long-term integration costs, and those choosing an industry-configured CRM over a blank generic one reach time-to-value 40% to 60% faster.
Single source of truth, in practice
Every vendor promises a single source of truth; very few advisory firms have one. The workable version is narrower than the marketing copy: one system owns each field, everything else reads it.
- CRM owns the relationship: lead source, self-reported attribution, asset band, life-stage trigger, referral origin. If it is not in the CRM it is not in the dashboard.
- Custodian and portfolio system own the assets: funded AUM, relationship size, flows. Marketing reporting reads these; it never restates them.
- Ad platforms own spend and delivery only: never conversions, because platform-reported conversions overstate contribution in every channel.
- Call tracking owns the phone: consultations booked by call are the norm in advisory work and the second-largest measurement hole after referrals.
- One reporting layer owns the joins: teams satisfied with data unification were 42% more likely to respond to clients consistently and 60% more likely to use AI agents.
Firms that get this right stop arguing about whose number is correct, which is where most reporting meetings in this industry currently spend their first twenty minutes. Our data intelligence team builds that layer, and our growth marketing team works against it rather than around it.
Compliance and reporting are the same workflow
Advisory reporting carries an obligation most marketing dashboards do not: records. Marketing communications, performance references and testimonials all fall under review requirements, and compliance overhead adds 8% to 15% to effective cost per lead for most financial firms - dropping below 5% for teams with pre-approved asset libraries. A dashboard that logs which approved asset ran, where, and for how long is doing double duty as an audit trail. Build the approval state into the reporting schema at the start; retrofitting it after an examination request is the expensive path, and it is the reason so many advisory firms run their real numbers in spreadsheets that never reach the marketing team.
A 90-day reporting build
| Phase | Days | Work | Success measure | Stop condition |
|---|---|---|---|---|
| Inventory | 1-15 | List every system, its owner, and what it uniquely owns | One field owner per metric | Two systems claiming the same field |
| Capture | 16-35 | CRM source fields, self-reported attribution, call tracking, UTM standard | Over 80% of enquiries carry a source | Under 50% coverage - fix intake |
| Assembly | 36-55 | Automate extraction into one reporting layer; kill manual exports | Zero manual copy-paste steps | Any weekly report still hand-built |
| Scoreboard | 56-75 | One page: pipeline, economics, assets, retention | A partner reads it in five minutes | More than 12 tiles on page one |
| Review ritual | 76-90 | Weekly pipeline, monthly economics, quarterly cohort | Decisions logged against the numbers | Dashboard opened less than weekly |
The stop conditions matter more than the phases. A dashboard nobody opens weekly is a cost, not an asset, and the honest failure mode in this industry is not a missing chart - it is a beautiful chart built on a source field that 40% of enquiries never filled in. For the demand side once the reporting works, our paid media cost guide sets the spend expectations.
Frequently Asked Questions
What should a wealth management marketing dashboard actually show?
Four layers, in this order: pipeline (enquiries, qualified prospects and discovery meetings by source), economics (cost per qualified lead, blended acquisition cost including advisor hours, and cost per dollar of new assets), asset outcomes (new AUM funded, average relationship size, and time from first touch to funding), and retention (client attrition, referral rate and next-generation coverage). Vanity layers - impressions, followers, page views - belong in a channel tab, not the front page. The test is whether a partner can answer "what should we spend more on next quarter" from the first screen.
Why is reporting so poor in wealth management?
Because the data lives in systems that do not talk to each other. In Advisor360's 2026 Connected Wealth Report, 74% of advisors say their technology is not fully integrated, 72% say their stack needs an upgrade and 74% say they are not getting full value from tools they already pay for. Orion's research puts disconnected systems as advisors' top technology pain point, cited by 51%. When the CRM, planning tool, custodian feed and marketing platforms hold separate versions of the same client, every dashboard built on top inherits the disagreement.
Does dashboard and tech adoption correlate with growth?
The utilisation figures suggest it does. Firms that grew fastest in 2025 used 65% of their technology stack, while firms that did not grow at all used just 52% - the gap is in usage, not licences. Separately, RIAs with a documented marketing plan acquire 67% more new clients, and only 27% maintain one. Reporting is the mechanism that makes a plan enforceable: without a scoreboard, the plan reverts to whichever activity feels most urgent that week.
How much AI is actually being used in advisory reporting?
More in aggregate than in analytics specifically. 63% of RIAs now use AI in some capacity - more than double the 2023 rate - and 74% of advisors say AI will help their business, with 57% naming automation of routine tasks as the biggest benefit. But marketers overall use AI mostly for content and copywriting (50%) while reporting and analytics sits at 35%, and Schwab's benchmarking found only 20% of RIA firms using AI to produce digital marketing content. The reporting layer is where the least automation and the most manual hours still live.
What is a realistic reporting cadence for an advisory firm?
Monthly for economics, weekly for pipeline, quarterly for cohorts. Advisors allocate roughly 7% of their working hours to business development and 83% of firms cite limited resources and advisor time as a major constraint, so a dashboard that needs manual assembly will not survive. Automating attribution reporting cuts manual analytics workload by 30% to 40%, and 56% of marketers already say they lack the time to analyse the data they have. Build for a five-minute read, and reserve deep analysis for the quarterly cohort review.
The verdict
Wealth management reporting fails upstream of the dashboard. 74% of advisors say their technology is not integrated, 51% name disconnected systems as their biggest technology problem, and the firms that grew fastest simply used more of what they already owned - 65% of the stack against 52%. Fix field ownership, capture source at intake, automate assembly, and cap page one at the four things a partner can act on. Talk to our team if you want your current reporting stack mapped against these benchmarks.
Sources
Advisor360 - 2026 Connected Wealth Report
Orion - 2026 State of the Advisor Report, tech utilisation and AI adoption
Cerulli - State of US Wealth Management Technology 2026
Supermetrics - Marketing Data Report 2026 (435 marketers)
Konabayev - marketing analytics and data unification statistics
InvestmentNews - Schwab RIA benchmarking, digital marketing and AI adoption
ProFundCom - Schwab 2026 RIA Benchmarking Study referral data
Defiance Analytics - documented marketing plans and RIA acquisition data
Vantage Point - state of CRM in financial services 2026
Wolf Financial - financial services CPL and compliance overhead benchmarks
LinkedInsider - advisor AUM and client relationship benchmarks