Table of contents

Only 33% of marketing leaders say their attribution is mostly accurate, and roughly 38% of B2B pipeline is invisible to any multi-touch model. In wealth management both numbers understate the problem, because the industry's best channel is a conversation between two people and its average client stays for about a decade. This report collects the 2026 attribution, measurement and business-intelligence data that advisory firms should be planning against.
Key Takeaways
- Only 33% of marketing leaders call their attribution mostly accurate, and 67% say accuracy has declined since 2021 on the back of privacy changes.
- 38% of B2B pipeline sits in the dark funnel - 51% for product-led motions - with no attributable touchpoint of any kind.
- Marketing mix modelling adoption jumped from 9% to 26% in three years, and 33% of teams now run MTA and MMM in parallel rather than choosing.
- 44% of marketers still run last-touch, usually because their tooling cannot do anything else.
- RIAs with a documented referral programme brought in 1.6x more new client assets (Schwab 2026 RIA Benchmarking Study, 1,236 firms, USD 2.5T+ AUM) - yet only 44% of larger firms have one.
- Only 27% of RIAs maintain a documented marketing plan, down from 46%, while firms with documented strategies acquire 67% more new clients.
- Attribution improvements are worth about 33% more marketing ROI and 29% lower acquisition cost, mostly through reallocation.
The state of attribution in 2026
Model adoption no longer adds up to 100% because teams stopped treating models as mutually exclusive. In an analysis of more than 1,200 marketing teams, the same organisations report running two or three approaches side by side and reconciling them.
| Model | Adoption | Note |
|---|---|---|
| Multi-touch attribution (MTA) | 47% | Most common single model |
| Last-touch | 41% | Default in most CRMs and ad platforms |
| Hybrid MTA + MMM | 33% | The current leading edge |
| Marketing mix modelling (MMM) | 26% | Up 17 points in three years |
| Cross-device attribution | 38-44% | Identity resolution accuracy 60-80% |
| AI-driven attribution models | 27-34% | Adds fidelity, not certainty |
| Mature model (data-driven or regression) | 14% of B2B | The rest are single-touch |
Two drivers explain the MMM surge: 43% of new adopters cite signal loss from cookie deprecation and Apple App Tracking Transparency, and 38% cite the arrival of open-source MMM tooling as the practical enabler. Meanwhile 72% of marketing leaders name attribution as their number-one measurement challenge, ahead of data quality at 58% and channel integration at 54%.
The dark funnel is the wealth management default
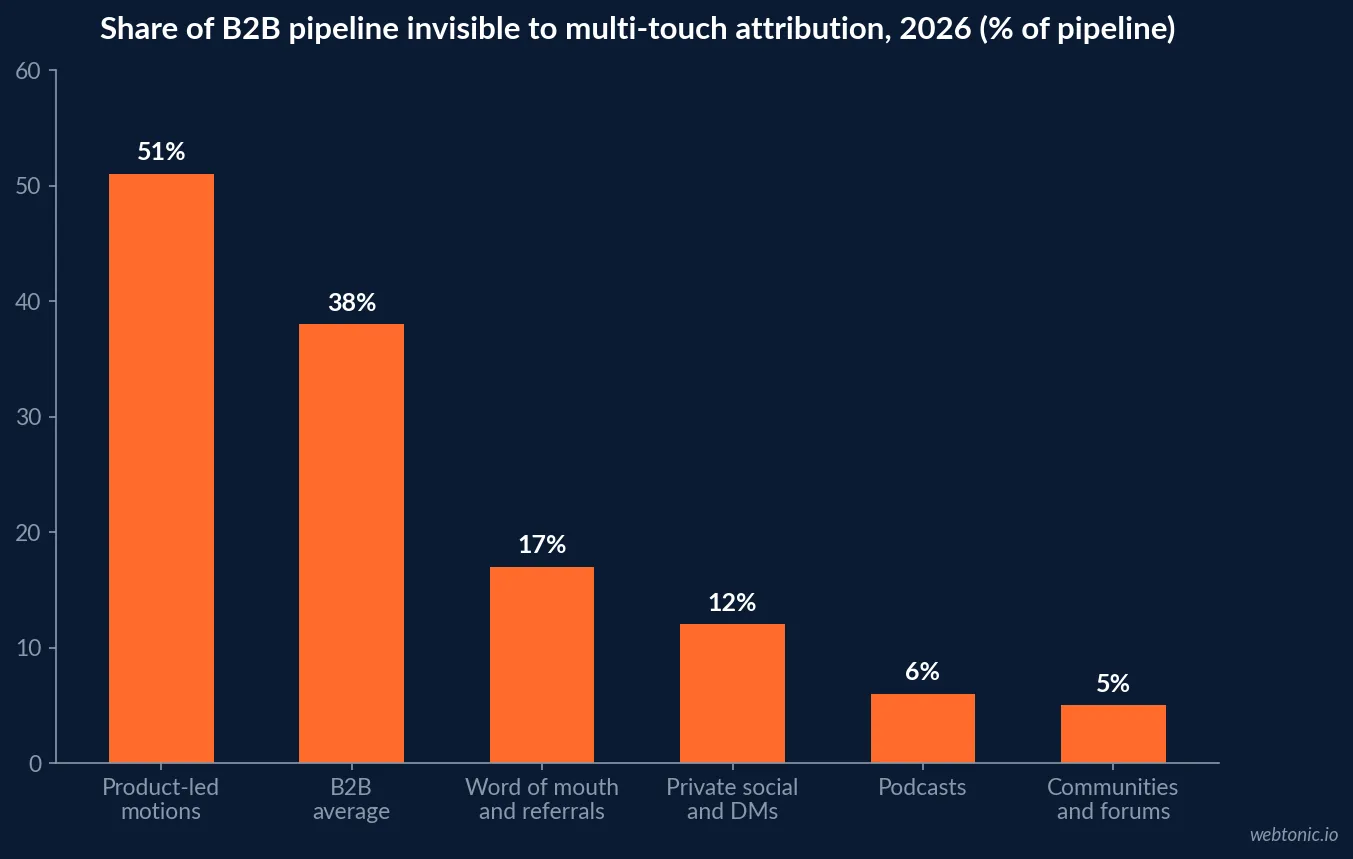
The uncomfortable number is 38%: the share of average B2B pipeline with no attributable touchpoint. It is not spread evenly. Word-of-mouth and referrals account for 17% of it, private social channels 12%, podcasts 6%, communities and forums 5%, and internal buying-committee conversations 4%. Read that list again with an advisory firm in mind - it is a fairly complete description of how wealth management actually grows.
| Source of influence | Share of dark-funnel pipeline | Wealth management equivalent |
|---|---|---|
| Word of mouth and referrals | 17% | Client and COI referrals |
| Private social and DMs | 12% | Peer intros, private groups |
| Podcasts | 6% | Advisor interviews, niche shows |
| Communities and forums | 5% | Professional and industry groups |
| Internal committee conversations | 4% | Spouse and family decision-making |
Benchmark data from advisor practices lines up with this: existing clients account for about 35% of production and referrals plus centres of influence a further 15%, while educational and meal-based seminars combine for 25% of production - and 48% of surveyed advisors say networking and referrals deliver their best returns. None of those channels produce a click. Any attribution programme in this industry that starts with tags rather than intake questions is measuring the minority of its own pipeline. Our growth marketing team starts with intake questions for exactly that reason, and our paid social cost breakdown prices the measurable half of the mix.
The referral is a programme, not luck - and that is measurable
The 2026 Schwab RIA Benchmarking Study, drawn from 1,236 firms representing more than USD 2.5 trillion in assets, produced the cleanest causal-looking number in advisory marketing: firms with a formal client referral programme brought in 1.6 times more new client assets than firms without one. The follow-through gap is the story.
| Finding | Figure | What it implies for measurement |
|---|---|---|
| New assets from firms with a documented referral programme | 1.6x | Referrals respond to process, so they can be forecast |
| Firms above USD 250M AUM with a documented client referral programme | 44% | Most growth is unmanaged |
| Firms with a documented COI referral programme | 30% | The highest-value source is the least run |
| Top performers with a client referral programme | 52% | Even leaders are barely over half |
| RIAs with a documented marketing plan | 27% (down from 46%) | Reporting has no plan to report on |
| Firms citing limited resources and advisor time | 83% | Attribution competes with client work |
| Advisor hours spent on business development | 7% | The scarcest input in the model |
| New client acquisition lift, documented-strategy firms | 67% | Documentation is the variable |
The measurement lesson is that referrals behave like a channel when a firm runs them like one - defined asks, timing, follow-up mechanics, and a source field in the CRM. Without that, referral growth shows up in reporting as direct traffic or branded search, which quietly credits the wrong budget line. Industry researchers peg organic growth across RIAs and independent broker-dealers at under 2%, so misattributing the one channel that works is expensive.
What a client actually costs, and why nobody agrees
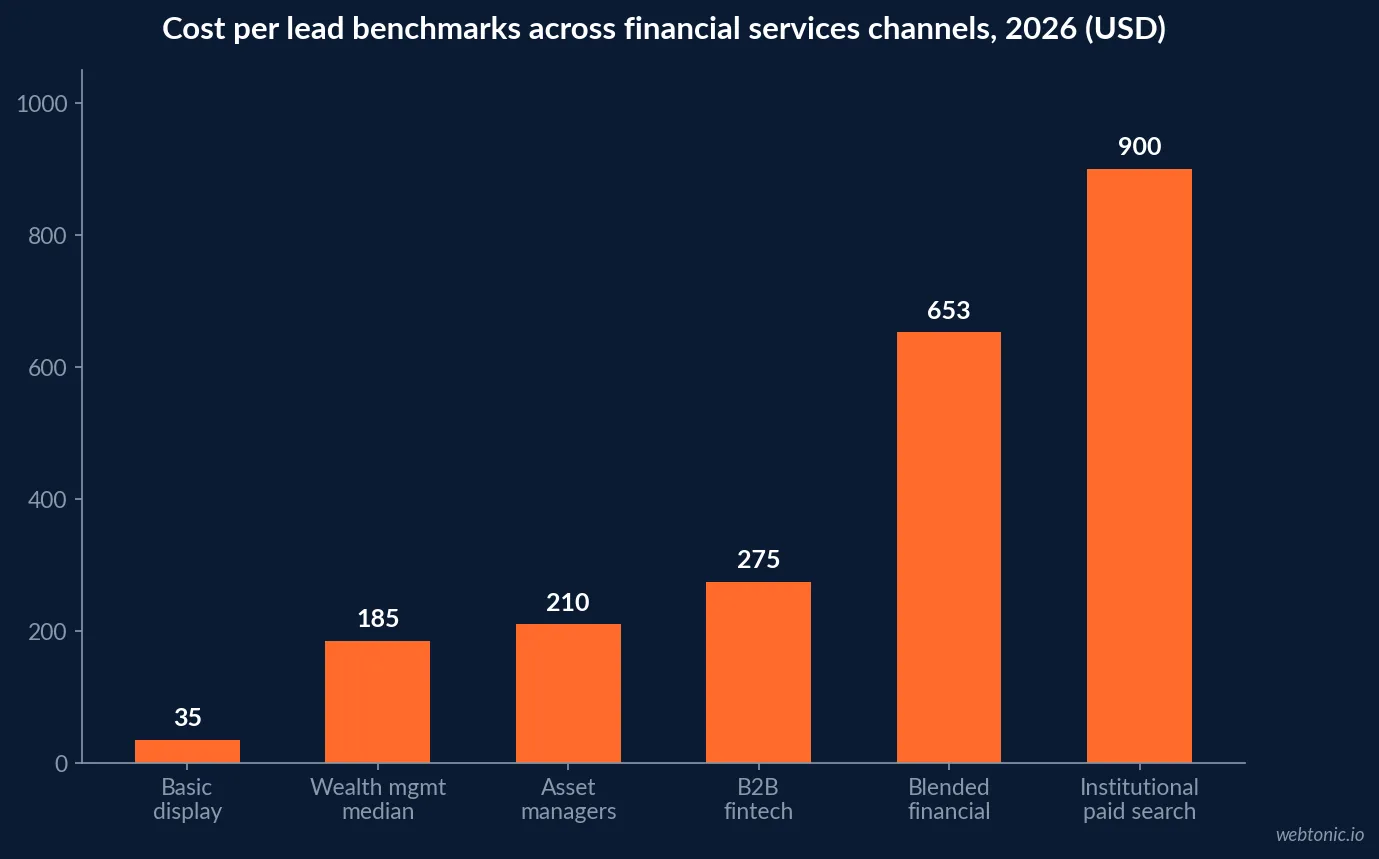
Cost figures in this industry differ by an order of magnitude, and almost always because the definitions differ rather than the performance.
| Cost metric | Figure | What it includes |
|---|---|---|
| Median CPL, wealth management, all paid channels | ~USD 185 | Media only |
| Median CPL, asset managers | ~USD 210 | Media only |
| Median CPL, B2B fintech | ~USD 275 | Media only |
| Blended financial services CPL | ~USD 653 | Mixes high-intent search and institutional |
| Basic display and programmatic CPL | From USD 35 | Cheapest and weakest quality |
| High-intent institutional paid search CPL | USD 900+ | Narrow, expensive auctions |
| Average advisor client acquisition cost | ~USD 3,800 | Includes advisor time |
| Share of acquisition cost that is staff time | ~71% | The line most firms omit |
| Compliance overhead added to effective CPL | 8-15% | Under 5% with pre-approved libraries |
Lead-type conversion rates then decide what any of it means: referral leads close at 40% to 60%, seminar leads at 15% to 25% and purchased leads at 2% to 8%. A USD 200 purchased lead converting at 5% is USD 4,000 per acquired client - which is worth knowing before comparing it with a USD 653 "expensive" lead that closes at ten times the rate. Retargeting cuts CPL by 30% to 55% against cold prospecting, and firms that track cost per qualified lead allocate budget 34% more efficiently, yet fewer than 40% of financial firms do so.
Attribution windows versus a ten-year client
Wealth management inverts the usual measurement problem. Most industries struggle because value is small and diffuse; advisory firms struggle because value is enormous and arrives slowly. Deals above USD 50,000 in value typically need 7 to 12 marketing touchpoints, the average tracked B2B journey now carries 12+ touchpoints, and 57% of sales professionals report cycles lengthening. Against that, last-click attribution undercounts channels such as LinkedIn by 40% to 60%.
- Use asset-weighted outcomes, not lead counts: a lead that funds USD 2M of assets at 25 basis points over a ten-year tenure is worth roughly USD 50,000 in revenue; one that funds USD 180,000 is worth about USD 4,500.
- Record the asset band at intake, not at close - otherwise the CRM cannot separate a good channel from a busy one.
- Run incrementality tests on brand and search: 25% to 40% of conversions credited to paid search are demand that would have converted anyway.
- Report a rolling 12-month cohort, not monthly CPL, because a month of advisory marketing contains no complete journeys.
- Instrument the phone: consultations booked by call are the norm in this industry, and untracked calls are the second-largest attribution hole after referrals.
The data foundation problem underneath all of it
Attribution failures are usually plumbing failures. In a 2026 survey of 435 marketers, the top data problems were a unified customer view (34%), predictive analytics and forecasting (34%) and competitive intelligence (33%); 56% said they lacked the time to analyse data properly and 38% lacked tools to integrate and report on it at all. Query volumes are exploding - average rows returned by marketing-data queries rose 230% between 2020 and 2024 - while only 32% of marketers measure traditional and digital spend holistically.
| Foundation metric | Figure | Consequence for attribution |
|---|---|---|
| Marketers lacking time to analyse data | 56% | Dashboards go unread |
| Marketers lacking tools to integrate and report | 38% | No single source of truth |
| Measuring traditional and digital spend holistically | 32% | Offline events stay invisible |
| Planned investment in marketing mix modelling | 40% | The next 12 months of budget |
| Planned investment in A/B testing | 36% | Cheap incrementality evidence |
| AI used for reporting and analytics | 35% | Underused against 50% for content |
| Teams with attribution capability, martech spend | +23% | Capability costs money |
| Teams with attribution capability, pipeline | 1.6x | And returns it |
That last pair is the business case in one line: attribution-capable teams spend 23% more on martech and report 1.6x more pipeline. Building that layer for advisory firms - CRM lead sourcing, call tracking, asset-band tagging, consolidated reporting - is what our data intelligence team does, and it is the prerequisite for any conversation about growth marketing spend.
A 90-day attribution build for an advisory firm
| Phase | Days | Work | Success measure | Stop condition |
|---|---|---|---|---|
| Definitions | 1-15 | Agree on lead, qualified lead, client; add asset band and life-stage trigger fields | One written definition per term, in the CRM | Two teams using two definitions |
| Capture | 16-35 | Self-reported attribution question at intake, call tracking, UTM standard, form hygiene | Over 80% of new enquiries carry a source | Under 50% coverage - fix forms first |
| Reconciliation | 36-55 | Compare platform-reported, CRM-reported and self-reported sources | Gaps explained rather than averaged | Platforms claim more clients than exist |
| Modelling | 56-75 | First-touch plus multi-touch view; blended CAC including advisor hours | CAC calculable per source, staff time included | Cannot cost advisor hours |
| Testing | 76-90 | One holdout or geo test on brand search or display | Incremental lift measured, not assumed | No channel large enough to test - keep capturing |
Nothing in that plan requires an enterprise stack, and the first two phases matter more than the last two. An advisory firm with an honest self-reported source field and tracked phone calls will out-measure a competitor with a sophisticated model fed by incomplete capture, because most teams overestimate their attribution precision by 20% to 30% to begin with.
Frequently Asked Questions
Why is marketing attribution so hard in wealth management?
Three structural reasons. First, the sales cycle: relationships are researched for months and held for roughly a decade, so a 30-day conversion window measures almost nothing that matters. Second, the dominant channel is human - referrals from clients and centres of influence - and referrals leave no click trail, which is why they get credited to whatever page the prospect happened to land on. Third, signal loss: 67% of marketing leaders report attribution accuracy has declined since 2021 because of iOS App Tracking Transparency, cookie deprecation and email privacy changes, and paid-social attribution accuracy specifically dropped 30% to 50%.
What share of marketing is actually unattributable?
In B2B, roughly 38% of pipeline sits in the dark funnel - private messages, communities, podcasts, peer conversations - completely invisible to any multi-touch model, rising to 51% for product-led motions. In wealth management the equivalent figure is arguably higher, because the referral conversation happens entirely off-platform. The practical response is to plan capacity assuming a third or more of growth will never be click-attributable, and to measure it with surveys, self-reported attribution fields and holdout tests rather than pretending the tag will find it.
What is a realistic client acquisition cost for an advisory firm?
It depends on whether staff time is counted. Kitces research puts the average advisor client acquisition cost near USD 3,800, and roughly 71% of that cost is staff time rather than media. Blended cost per lead in financial services is often quoted at USD 653, while the paid-channel median for wealth management firms is nearer USD 185 per lead, and purchased leads converting at 2% to 8% work out to about USD 4,000 per acquired client. The single biggest reporting failure in the industry is excluding advisor hours, which makes referrals look free and paid media look expensive.
Which attribution model should a wealth management firm use?
Two in parallel, not one. Across 1,200+ teams, multi-touch attribution is used by 47%, last-touch by 41%, marketing mix modelling by 26% - up from 9% three years ago - and 33% already run hybrid MTA plus MMM. For an advisory firm the workable stack is: a CRM-native first-touch and lead-source field for honesty, a multi-touch view for digital sequencing, self-reported attribution at intake for the dark funnel, and periodic holdout or geo tests for the channels that refuse to be modelled.
Does better attribution actually improve returns?
The measured effects are consistent rather than dramatic. Teams that improve attribution accuracy report a 33% average increase in marketing ROI and a 29% average reduction in customer acquisition cost, mostly by moving budget from over-credited to under-credited channels. Firms with mature attribution infrastructure cut wasted ad spend by about 23% in year one, data-driven models outperform last-click users by roughly 18% in ROAS, and B2B financial firms that track cost per qualified lead instead of raw cost per lead allocate budget 34% more efficiently.
The verdict
Attribution in wealth management is not a tooling problem, it is an honesty problem with tooling symptoms. 38% of B2B pipeline is structurally invisible, only 33% of leaders trust their own numbers, and the channel that actually drives growth - referrals, worth 1.6x more new assets when documented - leaves no trace unless someone asks the client. Capture first, model second, test third, and count advisor time as the real cost it is. Talk to our team if you want your current measurement stack audited against these benchmarks.
Sources
BunkerDB - attribution model adoption across 1,200+ teams and dark-funnel data
AM World Group - marketing attribution statistics 2026
Empire325 - attribution statistics with source citations
Konabayev - marketing analytics statistics digest
Supermetrics - Marketing Data Report 2026 (435 marketers)
ProFundCom - Schwab 2026 RIA Benchmarking Study, referral programme data
Defiance Analytics - RIA client acquisition and documented-strategy data
Wolf Financial - financial services cost per lead benchmarks 2026
IvyForms - advisor lead type conversion benchmarks
AcquireUp - 2026 industry index for financial professionals
Foundry CRO - last-click undercounting and B2B channel ROAS data