Table of contents
Key Takeaways
- Water damage restoration keywords command $91–$251 per click on Google Ads, making them the most expensive niche in all of home services (ALM Corp 2026).
- The average water damage insurance claim pays $11,098, so a $200 lead that closes at 25–50% still delivers strong positive ROI (NAIC / ConsumerShield 2026).
- Restoration companies spend 6–10% of revenue on marketing, while franchises average 3–5% and growth-mode operators push to 15% (MarketingLTB 2026).
- SEO produces 5.3× higher long-term ROI than print advertising for restoration companies, with local SEO delivering the lowest cost per lead over 12 months (MarketingLTB 2026).
- Email marketing returns $36–$42 for every $1 spent, compared to $8 for Google Ads, making it the highest-ROI channel available (Omnisend / PipelineOn 2026).
- The global water damage restoration market reached $5.97 billion in 2026 and is projected to grow to $8.97 billion by 2032 at a 6.93% CAGR (GII Research).
Water Damage Restoration Digital Marketing Benchmarks at a Glance
The table below consolidates cost-per-lead, ROI, and channel-fit data from multiple verified sources. Restoration marketing is uniquely shaped by emergency intent — a homeowner with a flooded basement calls the first company that answers, which is why response speed and channel selection matter as much as budget size.
| Channel | Avg. Cost Per Lead | Avg. ROI / ROAS | Best For |
|---|---|---|---|
| Google LSA | $95–$280 | 13–19× ROAS | Emergency high-intent leads |
| Google Search Ads | $91–$251/click | ~$8 per $1 spent | Active-search capture |
| Local SEO / GBP | $0 (organic) | 5.3× vs print ads | Long-term cost efficiency |
| Meta / Facebook Ads | $32–$58 | 60% cheaper CPL vs Google | Brand awareness and retargeting |
| Email Marketing | $0.05–$0.15/contact | $36–$42 per $1 spent | Customer reactivation |
| Referral Programs | Varies | 75% retention rate | Insurance adjuster relationships |
Water Damage Restoration Market Size and Growth
The water damage restoration industry is expanding rapidly, driven by aging infrastructure, climate-related disasters, and rising insurance claim volumes. Understanding the market context helps restoration marketers allocate budgets with confidence and forecast demand cycles. The industry is fragmented — over 62,000 firms with fewer than two employees on average — which creates opportunity for companies that invest in digital visibility.
| Metric | Value | Source |
|---|---|---|
| Global market size (2026) | $5.97 billion | GII Research |
| Projected market size (2032) | $8.97 billion | GII Research |
| CAGR (2026–2032) | 6.93% | GII Research |
| U.S. restoration industry revenue | ~$7.2 billion annually | IBISWorld via ProofCo.ai |
| Number of U.S. restoration firms | ~62,582 | ProofCo.ai |
| Average employees per firm | < 2 | ProofCo.ai |
| Average water damage job value | $3,867 | Angi / Get X Media |
| Average insurance claim payout | $11,098 | NAIC / ConsumerShield |
| Annual industry growth rate | ~4% | IBISWorld |
SEO and Local Search Performance for Restoration Companies
Local SEO is the lowest-cost lead source for water damage restoration companies over a 12-month horizon. Google ranks local restoration companies on three factors: relevance, distance, and prominence, with reviews being the strongest prominence signal (Google Business Profile Help) you control. Restoration companies that maintain a Google Business Profile with 4.7+ star ratings, weekly photo uploads, and accurate 24/7 hours capture disproportionate Map Pack visibility.
68% of consumers require 4+ stars before contacting a service provider (Get X Media 2026). Authority Specialist's analysis of 34 contractors shows that search demand is dominated by emergency, high-intent queries where the Map Pack captures the majority of mobile clicks. The restoration companies ranking in the top 3 local results consistently invest in review generation, service-area page optimization, and schema markup for emergency services.
SEO produces 5.3× higher long-term ROI for restoration companies than print advertising (MarketingLTB 2026). While paid channels deliver immediate lead volume, organic search compounds over time — a well-optimized restoration website can generate 30–50% of its monthly leads from organic traffic within 12 months. For strategic guidance on building organic visibility, see our Google Ads strategy guide.
Google Ads and LSA Cost Benchmarks for Water Damage
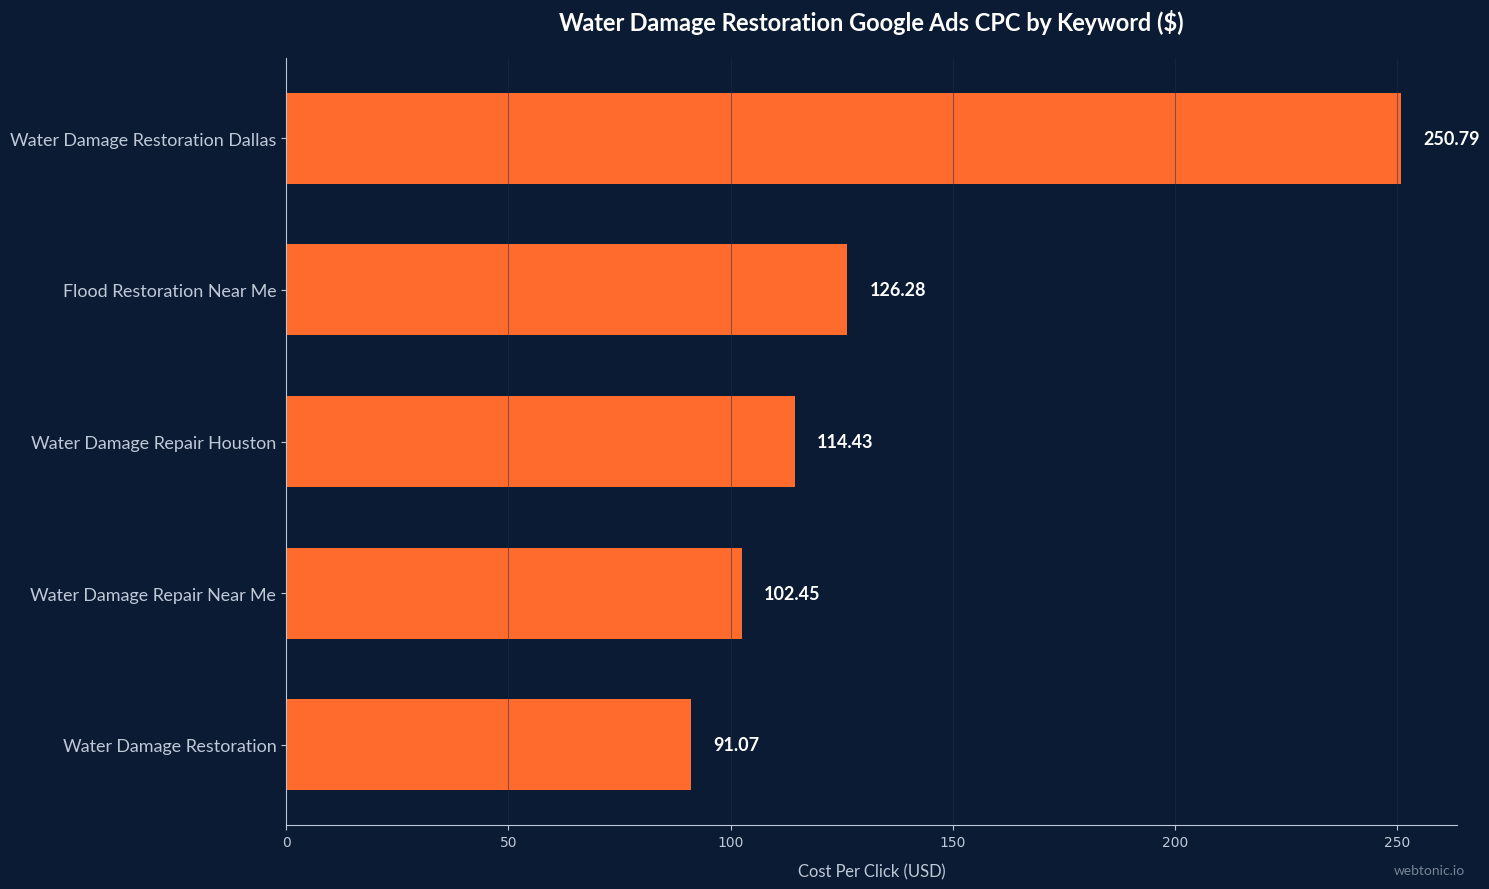
Water damage restoration keywords are the most expensive in home services, with "Water Damage Restoration Dallas" hitting $250.79 per click (ALM Corp 2026). Despite the extreme cost, PPC campaigns targeting water damage keywords convert at rates above 18%, making paid search a viable emergency-response acquisition channel for companies that track cost per job rather than just cost per click.
| Keyword | Avg. CPC | Intent Level |
|---|---|---|
| Water Damage Restoration Dallas | $250.79 | Extreme |
| Flood Restoration Services Near Me | $126.28 | Very high |
| Water Damage Repair Houston | $114.43 | High |
| Water Damage Repair Near Me | $102.45 | High |
| Water Damage Restoration (generic) | $91.07 | High |
Google LSA cost per lead for water damage restoration averages $156.32, with a median of $175.95 and a typical range of $82.94–$389.54 (99 Calls 2026). LSA costs have climbed roughly 40% since 2023, with 70% of restoration contractors now using Local Services Ads (Tygart Media).
One Tygart Media client generated 40 LSA leads per month, closed 28 jobs (70% close rate), averaging $3,500 per job for $98,000 in monthly revenue from $1,900–$7,000 in monthly ad spend — a 17.4× annual ROI. Companies that maintain verified job completion photos see 31% higher Quality Scores, while responding to every review within 4 hours further boosts LSA ranking. Learn more about paid search costs in our Google Ads pricing guide.
Marketing Budget Allocation for Restoration Companies
Independent restoration companies typically spend 6–10% of gross revenue on marketing, while franchises average 3–5% (MarketingLTB 2026). Growth-mode home service companies push that to 15% or higher (PipelineOn). The healthy benchmark for restoration marketing ROAS is $8–$12 return per dollar invested; channels consistently below $5 need optimization or reallocation (Tygart Media Martech Stack).
| Company Type | Marketing Spend (% of Revenue) | Monthly Budget Range |
|---|---|---|
| Franchise restoration | 3–5% | $2,000–$5,000 |
| Independent (< $1M revenue) | 6–10% | $2,250–$5,000+ |
| Mid-size ($1M–$3M revenue) | 8–12% | $5,000–$15,000 |
| Growth-mode ($3M+ revenue) | 10–15% | $10,000–$30,000+ |
Budget allocation should prioritize channels by proven ROI: Google Business Profile optimization and local SEO first (lowest cost, compounding returns), followed by Google LSA for immediate lead volume, email marketing for reactivation, and Meta Ads for brand building. The 47% of restoration companies that do not track cost per lead by channel are spending marketing dollars without knowing what generates revenue.

Social Media and Meta Ads Performance for Restoration
Meta Ads for home service businesses produce a $32–$58 cost per lead, roughly half what Google Ads costs in the same vertical (M.Wolf Media 2026). For water damage restoration specifically, social media advertising captures passive intent — building brand familiarity so your company is top-of-mind when an emergency strikes.
Restoration companies using targeted social media advertising see response rates 40% higher than generic home services ads (Restoration Marketers). Facebook lead ad CPL across home services runs $27.66, compared to $70.11 on Google (WordStream/LocaliQ 2025). Retargeting CPL is typically 50–70% lower than cold traffic CPL, making it the most cost-efficient layer of any paid media stack. For more on social advertising strategy, explore our Meta Ads services.
Analytics, Tracking, and Technology Adoption
47% of restoration companies do not track cost per lead by channel (PushLeads / RIA 2025), spending marketing dollars without knowing what actually generates calls. Meanwhile, only 4% of restoration companies use AI-powered CRM tools, and 79% use no AI at all (Tygart Media). Companies that deploy analytics dashboards improve marketing decision-making speed significantly, while those using data-driven strategies report $6–$12 ROI per $1 invested in CRM technology.
96–98% of website visitors leave without converting (PipelineOn / 6sense), making visitor identification and retargeting critical for restoration companies. At 2 AM emergency intent, a missed call is a lost $10,000+ claim. The restoration companies that invest in call tracking, lead source attribution, and CRM integration consistently outperform competitors who rely on intuition alone. For data-driven marketing approaches, see our data intelligence services.
Customer Retention and Referral Marketing
The average customer retention rate for restoration firms is 75%, with 60% of repeat business coming from insurance referrals (Zipdo / RIA). Among retained customers, 90% attribute their loyalty to "trustworthy service" (50%) and "competitive pricing" (30%). Restoration companies that maintain regular post-job communication through email and direct outreach see meaningfully higher referral and repeat rates than companies that disappear after the invoice (Tygart Media).
Repeat customers account for 39% of contractor annual revenue (ServiceTitan survey, 1,000+ contractors via PipelineOn). For restoration companies, property managers and insurance adjusters represent the highest-value referral relationships — a single adjuster relationship can drive dozens of jobs per year. Investing in referral partner email sequences and regular touchpoints delivers outsized returns relative to cold lead acquisition. Explore how growth marketing strategies can scale referral programs.
Digital Marketing Best Practices for Water Damage Restoration
- Track cost per lead by channel — the 47% of restoration companies that do not track this metric are spending blind (PushLeads / RIA).
- Invest in Google Business Profile optimization — free local leads from the Map Pack remain the highest-margin acquisition channel for restoration.
- Maintain a 4.7+ star rating — Google deprioritizes LSA profiles below 4.3 stars, and 68% of consumers require 4+ stars before contacting a service provider.
- Respond to leads within 5 minutes — emergency-intent callers contact the first company that answers, and a missed call is a lost five-figure claim.
- Build email reactivation sequences — at $36–$42 ROI per dollar, email is the cheapest way to generate repeat business from your existing customer list.
- Allocate 6–10% of revenue to marketing — or higher in growth mode — with at least 50% directed to digital channels that can be tracked and optimized.
- Diversify beyond Google Search — Meta Ads at $32–$58 CPL and email at near-zero CPL reduce dependency on increasingly expensive search ads.
- Deploy retargeting campaigns — 96–98% of site visitors leave without converting, and retargeting recaptures that lost intent at 50–70% lower CPL than cold traffic.
Frequently Asked Questions
How much should a water damage restoration company spend on digital marketing?
Independent restoration companies typically spend 6–10% of gross revenue on marketing, while franchises average 3–5%. Growth-mode companies push to 15% of revenue. For a company doing $1M in annual revenue, that translates to $5,000–$10,000 per month across all digital channels. Budget allocation should prioritize local SEO and Google LSA first, then email reactivation, then Meta Ads for brand building.
What is the average cost per lead for water damage restoration?
Cost per lead varies dramatically by channel. Google LSA averages $156.32 with a median of $175.95. Google Search Ads range from $91–$251 per click. Meta or Facebook Ads run $32–$58 per lead. Email marketing costs just $0.05–$0.15 per contact. The best-performing companies use a multi-channel approach weighted toward local SEO, LSA, and email rather than relying on any single channel.
Is SEO or PPC better for water damage restoration companies?
Both serve different purposes and work best together. PPC captures immediate high-intent emergency searches and converts above 18%, but costs $91–$251 per click. SEO produces 5.3× higher long-term ROI and delivers the lowest cost per lead over 12 months. Most successful restoration companies run both — PPC for immediate lead flow and SEO for compounding organic visibility that reduces paid dependency over time.
What digital marketing channels have the highest ROI for restoration?
Email marketing leads with $36–$42 return per dollar spent, followed by local SEO at 5.3× long-term ROI versus print, Google LSA at 13–19× ROAS, and Meta Ads at roughly 60% cheaper CPL than Google Search. The key is tracking cost per job rather than cost per lead across every channel to optimize allocation based on actual revenue generated.
How important are online reviews for water damage restoration marketing?
Critical. Google Business Profile prominence is heavily influenced by review volume and ratings. Companies with 4.7+ stars and verified job completion photos see 31% higher Quality Scores on LSA. Google manually deprioritizes LSA profiles below 4.3 stars, and 68% of consumers require 4+ stars before contacting a service provider. Review generation should be a core part of every restoration marketing strategy.
Sources
ALM Corp — Water Damage Restoration CPC Costs
99 Calls — Water Damage Restoration LSA Cost Per Lead
Tygart Media — Restoration Google Ads $127K Spend Analysis
PipelineOn — Water Damage Restoration Digital Marketing
GII Research — Water Damage Restoration Market Forecast
ProofCo.ai — State of Restoration 2026
MarketingLTB — Restoration Marketing Statistics 2026
Get X Media — Restoration Marketing Benchmarks 2026
M.Wolf Media — Meta Ads for Home Service Pros 2026
Zipdo — Water Damage Restoration Industry Statistics