



Table of contents
Key Takeaways
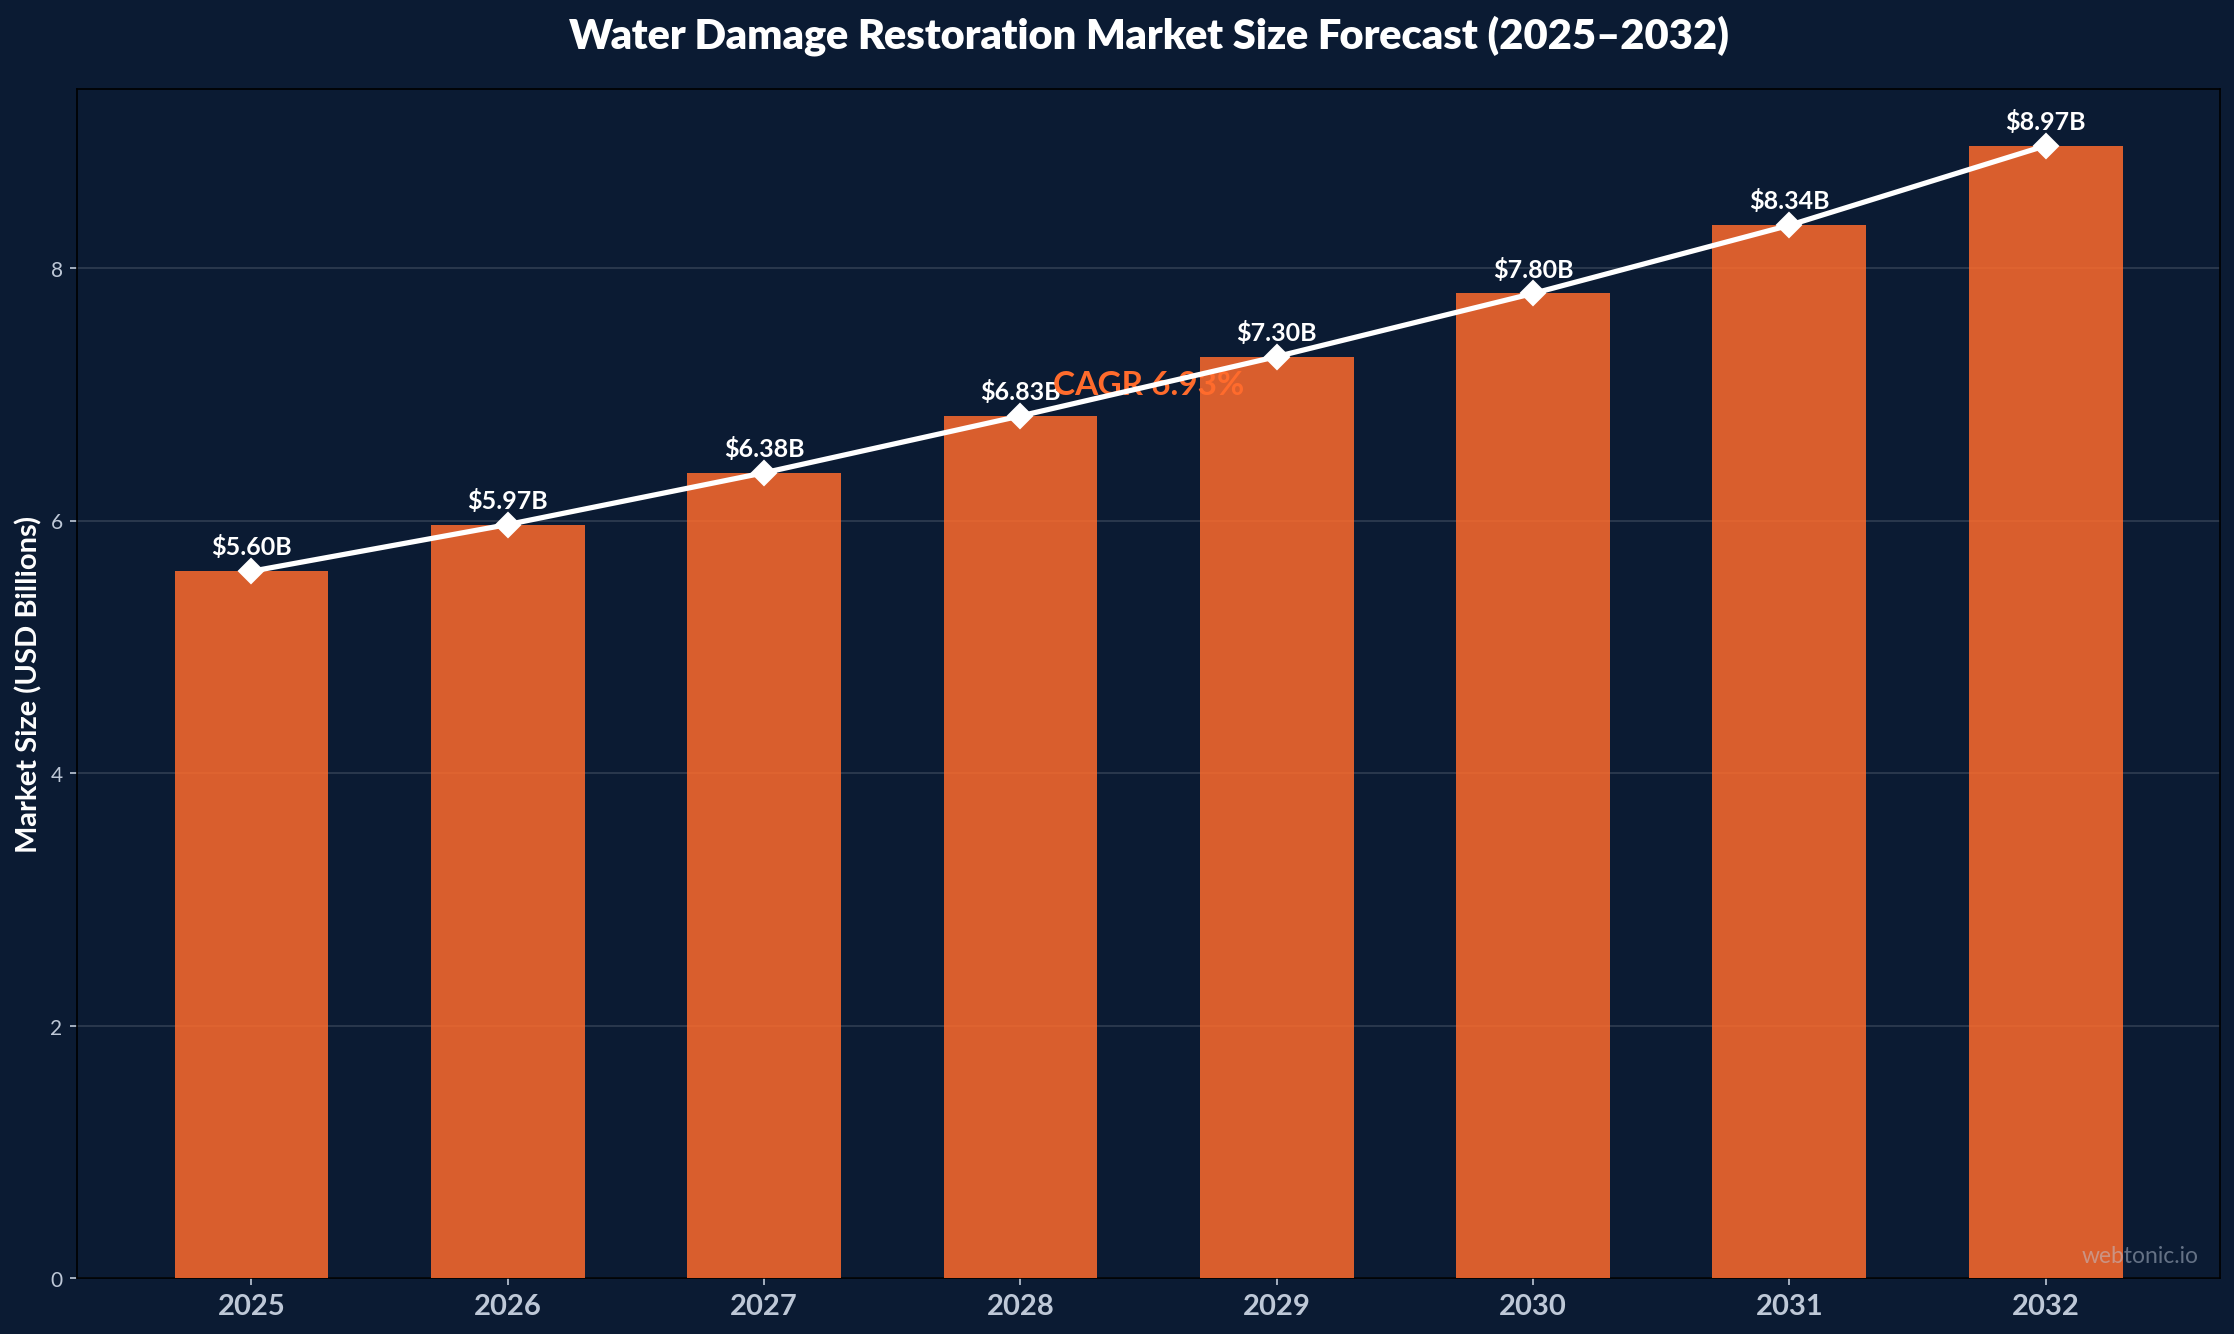
- The water damage restoration market is valued at $5.97 billion in 2026, growing at a 6.93% CAGR to reach $8.97 billion by 2032.
- The broader disaster restoration services market reaches $46.55 billion in 2026, projected to hit $60.43 billion by 2031 at a 5.36% CAGR.
- Only 4% of restoration contractors use AI features in their CRM, despite AI agents returning $6–$12 for every dollar invested in enterprise applications.
- The average U.S. homeowner water damage claim is $15,400 (III / Verisk data, 2019–2023 average), making it the second most costly claim type after fire.
- Non-weather water loss claim frequency decreased 7.8% from 2024 to 2025, while claim severity rose 2.5% — meaning fewer claims but larger payouts.
- Companies using call tracking improve marketing ROI visibility by 61% and make more accurate budget allocation decisions across channels.
- U.S. property claim volume fell 8.9% year-over-year in Q1 2026, running 13.13% below the five-year average according to Verisk's quarterly report.
- 79% of restoration contractors do not use AI at all, creating a significant competitive advantage for early adopters in operations and marketing analytics.
Water Damage Restoration Market Size and Growth
The water damage restoration industry continues to expand despite fluctuations in claim volume. According to GII Research's 2026 market report, the sector's growth is driven by aging infrastructure, increased severe weather events, and rising property values that inflate restoration costs.
- Water damage restoration market size (2026): $5.97 billion, up from $5.60 billion in 2025
- Projected market size by 2032: $8.97 billion at a 6.93% CAGR
- Broader disaster restoration services market: $46.55 billion in 2026, reaching $60.43 billion by 2031 at 5.36% CAGR
- Water damage remains the core profit engine for the restoration industry, accounting for the majority of service revenue
- Commercial water damage restoration grows faster (8.2% CAGR) than residential (5.8% CAGR) due to larger project sizes and insurance coverage
| Market Segment | 2025 Value | 2026 Value | Projected (2031–32) | CAGR |
|---|---|---|---|---|
| Water Damage Restoration | $5.60B | $5.97B | $8.97B (2032) | 6.93% |
| Disaster Restoration (Total) | $44.43B | $46.55B | $60.43B (2031) | 5.36% |
| Commercial Restoration | $12.8B* | $13.9B* | $20.5B* (2032) | 8.2%* |
| Residential Restoration | $18.4B* | $19.5B* | $26.1B* (2032) | 5.8%* |
* Estimated segments based on market reports and industry proportions.
Insurance Claims Analytics and Trends
Insurance claims data is the most important leading indicator for restoration companies. The Verisk Q1 2026 Property Report and LexisNexis 2026 Home Insurance Trends Report reveal critical shifts:
- Average U.S. homeowner water damage and freezing claim: $15,400 (III / Verisk, 2019–2023 average)
- U.S. property claim volume fell 8.9% year-over-year in Q1 2026, running 13.13% below the five-year average
- Non-weather water loss cost decreased 6.4% from 2024 to 2025, while severity rose 2.5%
- Non-weather water loss claim frequency decreased 7.8% — fewer claims but higher per-claim payouts
- Fire and lightning claims average $88,170, while wind and hail average $14,747 — positioning water damage as the second costliest claim type
- Claims severity reached an all-time high according to LexisNexis 2026 data, driven by labor costs, material inflation, and supply chain disruptions
For restoration analytics, the key insight is the divergence between frequency and severity. Fewer total claims means more competition for each job, but higher severity means larger per-job revenue — shifting the economics toward quality-focused, data-driven operators.
| Claim Type | Avg Claim Value | Frequency Trend | Severity Trend | Volume Impact |
|---|---|---|---|---|
| Water Damage & Freezing | $15,400 | ↓ 7.8% | ↑ 2.5% | ↓ 8.9% Q1 2026 |
| Fire & Lightning | $88,170 | Stable | ↑ | Low volume, high value |
| Wind & Hail | $14,747 | Variable | ↑ | Weather-dependent |
| All Property Claims | Varies | ↓ 8.9% | All-time high | 13.13% below 5-yr avg |
Technology and CRM Adoption Statistics
The restoration industry lags dramatically behind other sectors in technology adoption. According to Tygart Media's CRM AI adoption analysis and Cleanfax's 2026 Restoration Benchmarking Survey:
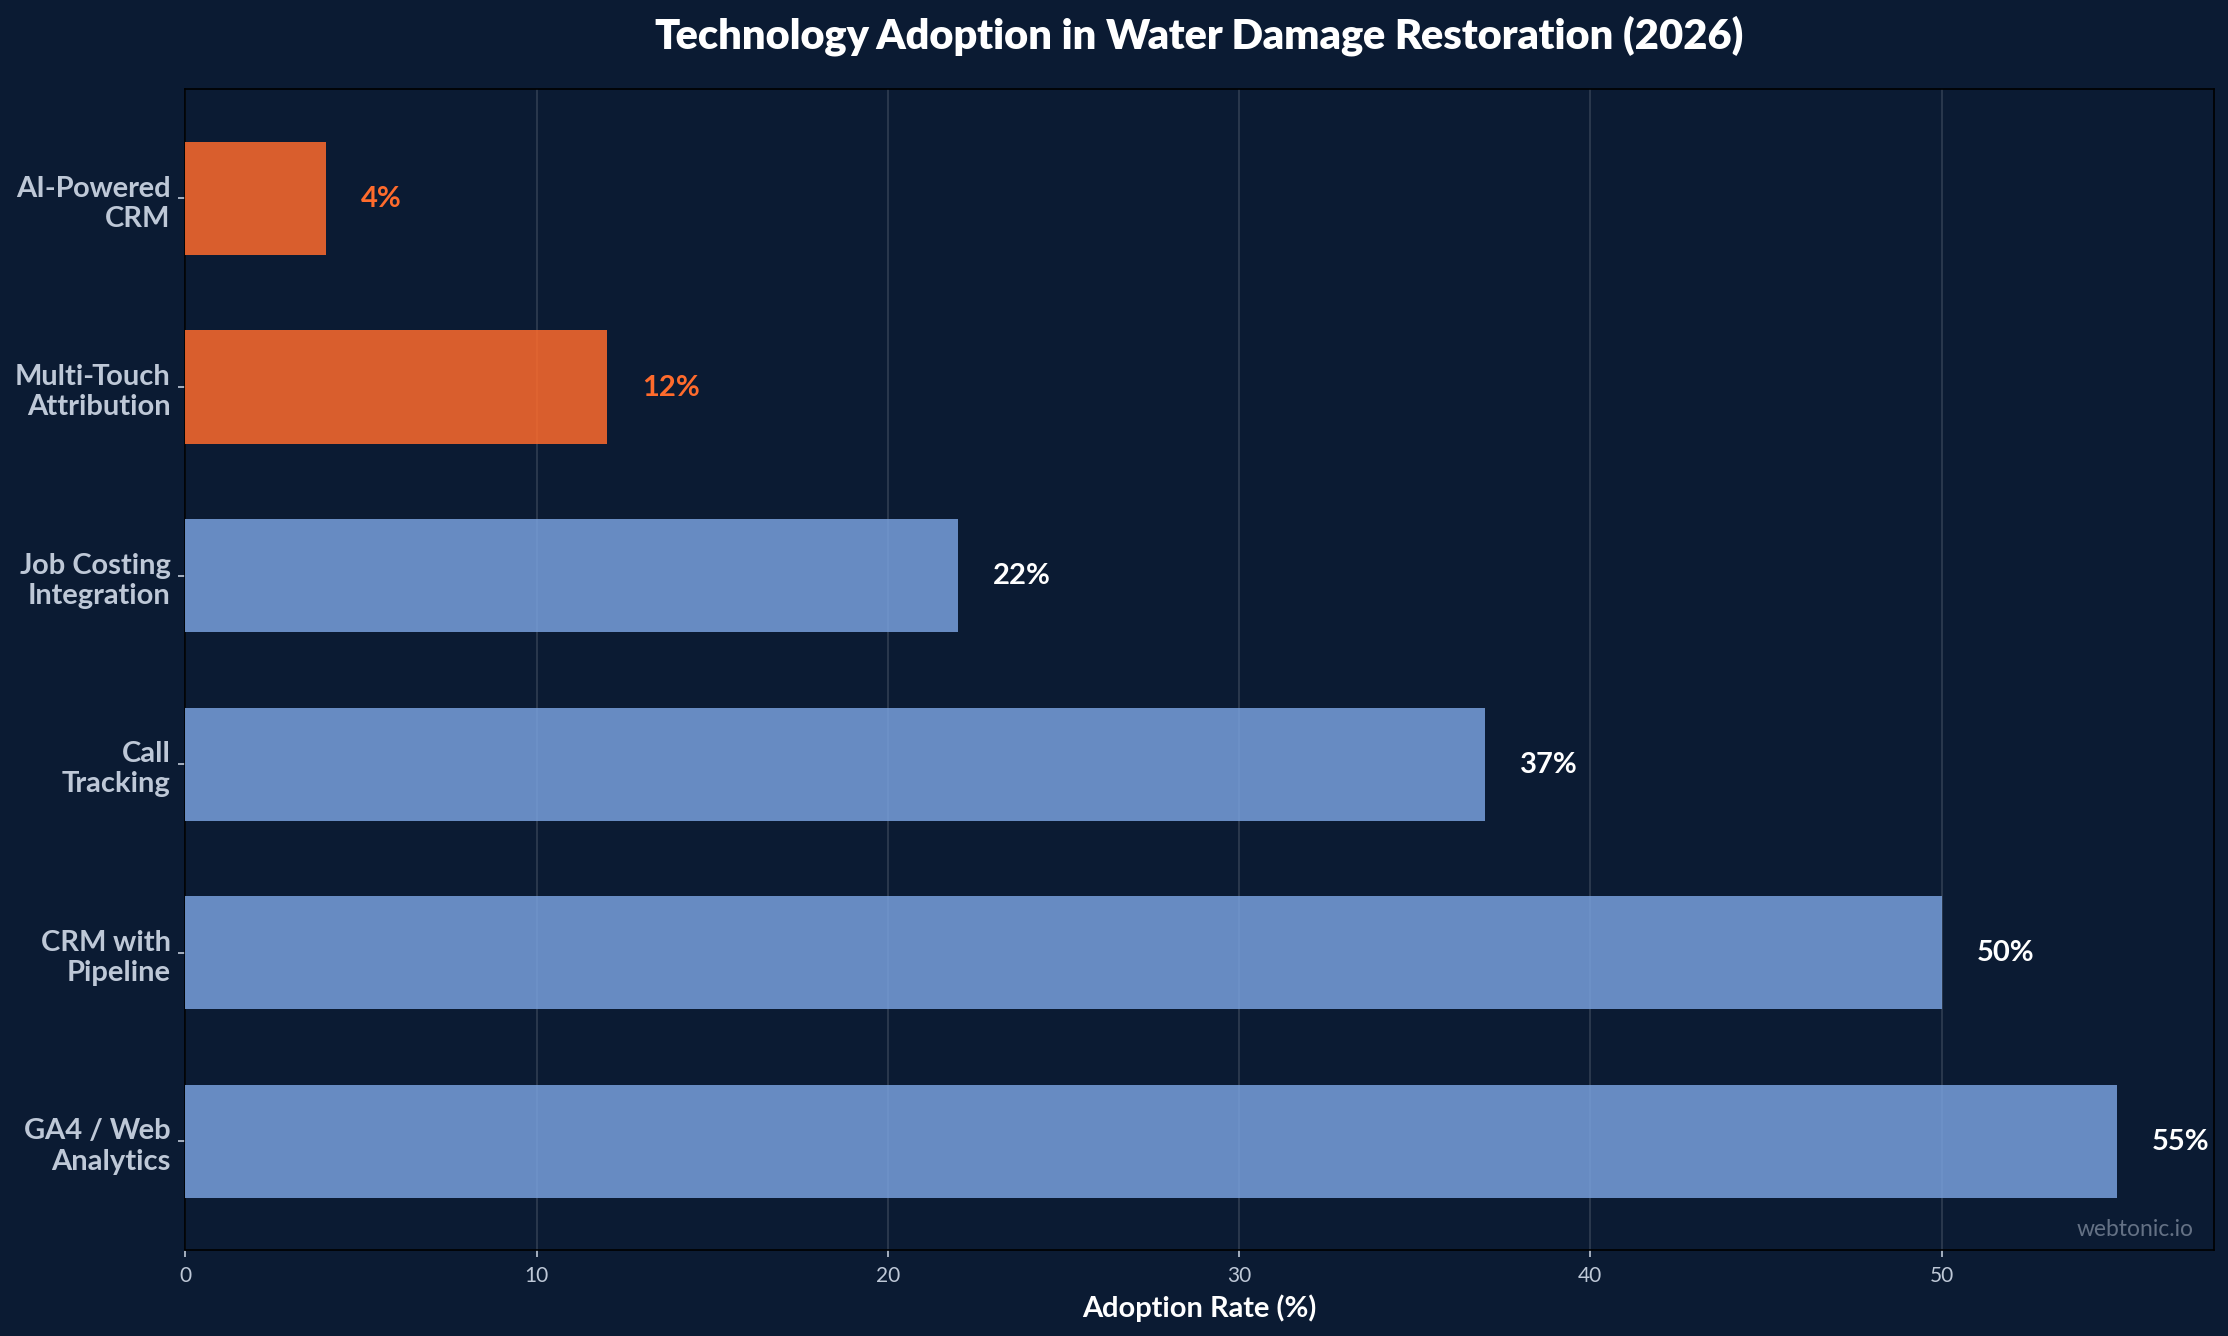
- Only 4% of restoration contractors use AI features in their CRM, up from 2.8% in 2024 and under 2% in 2023
- 79% of restoration contractors do not use AI at all in any business function
- AI agents return $6–$12 for every dollar invested in enterprise applications — restoration companies are leaving significant ROI on the table
- 80% of enterprise applications now embed AI agents, but small and mid-market restoration companies lag by 4–5 years
- AI-powered conversion rate improvements average 25%, and customer acquisition costs drop 30% for companies using CRM AI features
- Technology adoption is accelerating across the restoration industry, with most businesses projecting growth (Cleanfax 2026 survey)
The four primary barriers to AI adoption in restoration are lack of awareness (most owners don't know their CRM has AI), fear of complexity, perceived irrelevance, and change fatigue from managing 10+ platforms simultaneously. Companies that close this gap now gain operational advantages in lead scoring, automated follow-up, and predictive analytics.
Marketing Analytics and Tracking Benchmarks
Marketing analytics separates profitable restoration companies from those burning budget. Key tracking and analytics benchmarks for 2026:
- Companies using call tracking improve marketing ROI visibility by 61% — critical in a vertical where 60–80% of conversions happen by phone
- Multi-channel attribution shows 34% of conversions touch 2+ channels before the customer calls
- SEO produces 5.3x higher long-term ROI than print advertising for restoration companies
- Average marketing spend for competitive restoration companies: 8–12% of revenue
- PPC campaigns targeting emergency keywords outperform brand keywords by 42% on conversion rate
- Restoration companies with 5+ tracking numbers see 28% better lead source attribution accuracy
The most impactful analytics investments for restoration companies include call tracking with recording (identifies which campaigns generate real jobs), CRM pipeline tracking (measures lead-to-close rate by source), and job costing integration (connects marketing spend to actual project profitability rather than just lead volume).
| Analytics Capability | Adoption Rate | ROI Impact | Setup Complexity |
|---|---|---|---|
| Call Tracking | 35–40% | +61% attribution visibility | Low (plug-and-play) |
| CRM with Pipeline | 45–55% | Lead-to-close rate tracking | Medium |
| Google Analytics 4 | 50–60% | Web conversion tracking | Low |
| Multi-Touch Attribution | 10–15% | 34% cross-channel insight | High |
| AI-Powered CRM Features | 4% | 25% conversion lift | Medium (built into CRM) |
| Job Costing Integration | 20–25% | True profitability per source | High |
Restoration Industry Business Intelligence Statistics
Business intelligence and analytics adoption varies significantly across the restoration industry. Data from multiple 2026 industry surveys reveals the analytics maturity landscape:
- Only 20–25% of restoration companies integrate job costing with marketing attribution — meaning most cannot determine which marketing channels generate the most profitable jobs, only the most leads
- Companies with integrated analytics see 15–20% higher gross margins through better scope management, faster invoicing, and accurate cost tracking per project
- Technician productivity tracking increases average revenue per tech by 12–18% through identifying bottlenecks in drying cycles, documentation, and travel time
- Job aging analytics (time from FNOL to invoice close) averages 14–21 days for standard water damage — companies tracking this metric shorten cycles by 3–5 days, improving cash flow significantly
- Automated reporting saves 6–10 hours per week for office managers compared to manual spreadsheet tracking
- Moisture mapping analytics reduce equipment rental costs by 15–22% by optimizing dehumidifier and air mover placement and duration
The analytics gap creates a two-tier industry. Companies using tools like Albiware, Xactimate integrations, and restoration-specific dashboards operate with full visibility into job profitability, technician efficiency, and marketing ROI. Companies relying on manual tracking and gut decisions face margin compression and competitive disadvantage as the industry consolidates around data-driven operators.
| Analytics Maturity Level | % of Companies | Tools Used | Avg Gross Margin |
|---|---|---|---|
| Basic (Spreadsheets) | 35–40% | Excel, QuickBooks only | 38–42% |
| Intermediate (CRM) | 30–35% | CRM + call tracking | 45–50% |
| Advanced (Integrated) | 20–25% | Full stack + job costing | 50–55% |
| AI-Powered | 4% | CRM AI + predictive | 52–58% |
KPI Benchmarks for Restoration Companies
According to Tygart Media's restoration KPI dashboard framework and industry surveys, the critical operational metrics restoration companies should track include:
- Average job value: $2,500–$7,000 for standard water damage, with large-loss projects reaching $25,000–$100,000+
- Lead-to-close rate: 28–35% for quality leads, 8–12% for shared leads
- Cycle time (FNOL to final invoice): 14–21 days for standard water damage, 30–60+ days for large-loss
- Gross profit margin: 45–55% for well-managed restoration companies
- Customer acquisition cost: $275–$700 per acquired customer (not per lead)
- Average response time: under 60 minutes for emergency calls — companies responding in under 30 minutes close at 2.1x the rate of slower responders
- Repeat customer rate: 15–22% — maintenance plan subscribers have 3.5x higher lifetime value
The most sophisticated restoration analytics operations track these KPIs by job type (water extraction, structural drying, mold remediation, fire restoration), lead source (LSA, PPC, organic, referral), and technician (productivity and quality scores per team member).
Emerging Analytics Trends in Restoration
The restoration industry is at an inflection point in data-driven decision making. Key trends reshaping restoration analytics in 2026:
- Predictive weather analytics — leading companies use weather forecasting APIs to pre-position crews and increase ad spend 24–48 hours before predicted storms, capturing demand before competitors react.
- AI-powered lead scoring — CRM integrations that score incoming leads based on property value, insurance coverage probability, and job size potential. Currently at 4% adoption but growing rapidly.
- Real-time job costing — connecting field data (moisture readings, equipment runtime, labor hours) directly to financial dashboards. Companies using this see 15–20% gross margin improvement through better pricing and scope management.
- Automated review and reputation management — tracking and responding to reviews across Google, Yelp, and social platforms. Companies maintaining 4.7+ ratings see 31% lower CPL on LSAs.
- IoT sensor integration — smart water leak detectors and moisture monitoring creating proactive service opportunities. The smart home water sensor market is growing at 18% annually.
Related reading
- Water Damage Email Marketing Stats (2026)
- Water Damage Restoration Marketing Attribution Statistics for 2026
- Water Damage Restoration Dashboards & Reporting: 40+ Statistics for 2026
- Marketing Analytics services at Web Tonic
FAQ
How big is the water damage restoration market in 2026?
The water damage restoration market is valued at $5.97 billion in 2026, growing at a 6.93% CAGR from $5.60 billion in 2025 to a projected $8.97 billion by 2032. The broader disaster restoration services market reaches $46.55 billion in 2026.
What is the average water damage insurance claim?
The average U.S. homeowner water damage and freezing claim is $15,400 (III / Verisk data, 2019–2023 average). Claim severity reached an all-time high in 2025–2026 while claim frequency decreased 7.8%, meaning fewer but larger payouts.
What percentage of restoration companies use AI analytics?
Only 4% of restoration contractors use AI features in their CRM systems. 79% don't use AI at all in any business function. This creates a significant competitive advantage for early adopters, who see 25% conversion rate improvements and 30% lower acquisition costs.
What KPIs should a restoration company track?
Critical KPIs include average job value ($2,500–$7,000), lead-to-close rate (28–35%), cycle time (14–21 days), gross profit margin (45–55%), and response time (under 60 minutes). Track by job type, lead source, and technician for actionable insights.
How does call tracking improve restoration marketing?
Call tracking improves marketing ROI visibility by 61%. Since 60–80% of restoration conversions happen by phone, companies without call tracking have no visibility into which campaigns generate real jobs — effectively making most of their marketing spend unmeasurable.
Sources
giiresearch.com — Water Damage Restoration Market Report
riskandinsurance.com — Verisk Q1 2026 Property Report
risk.lexisnexis.com — 2026 Home Insurance Trends Report
tygartmedia.com — Restoration CRM AI: The 4% Adoption Gap
cleanfax.com — 2026 Restoration Benchmarking Survey
tygartmedia.com — Restoration Business KPI Dashboard
marketingltb.com — Restoration Marketing Statistics 2026
proofco.ai — State of Restoration 2026


