Table of contents
No published study prices "trucking Meta ads" as its own category, so this page applies 2025 Facebook lead-generation benchmarks to the two audiences a carrier or 3PL actually targets on Meta. One audience is drivers; the other is freight buyers. They do not behave the same way, and treating them as one line item is why so many carrier ad accounts look unpriced.
Key Takeaways
- Trucking is a USD 906 billion industry where more than 99% of carriers run 100 trucks or fewer (ATA, 2026).
- Trucks moved 72.7% of the nation's freight by weight in 2024 (ATA).
- The industry is in its third straight year of a freight recession (ATRI, 2026).
- Average cost to operate a truck hit a record USD 2.336 a mile in 2025, up 3.4% year over year (ATRI).
- ATA's For-Hire Truck Tonnage Index fell 1.6% year over year as of August 2026.
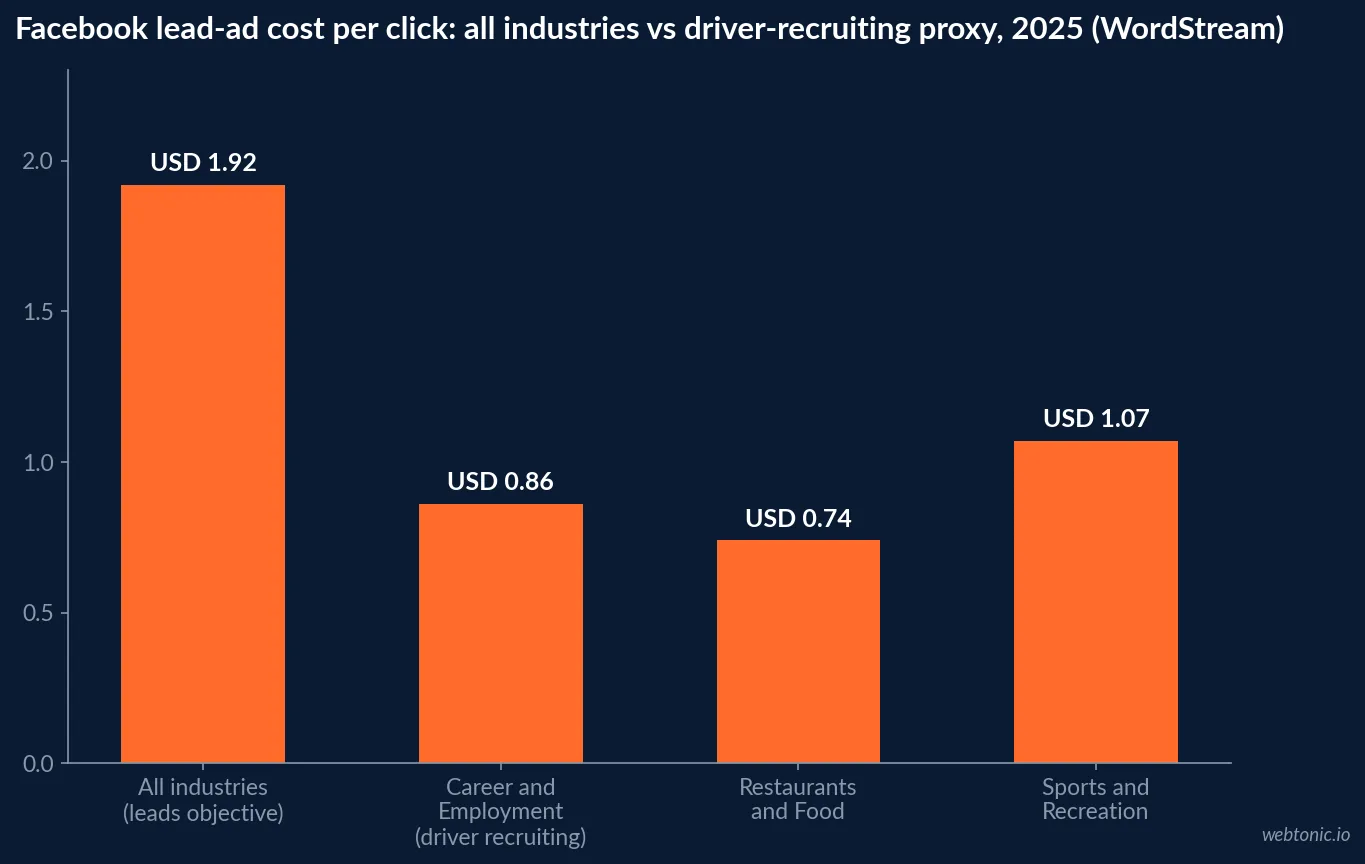
- All-industry Facebook lead campaigns average a USD 1.92 cost per click (WordStream, 2025).
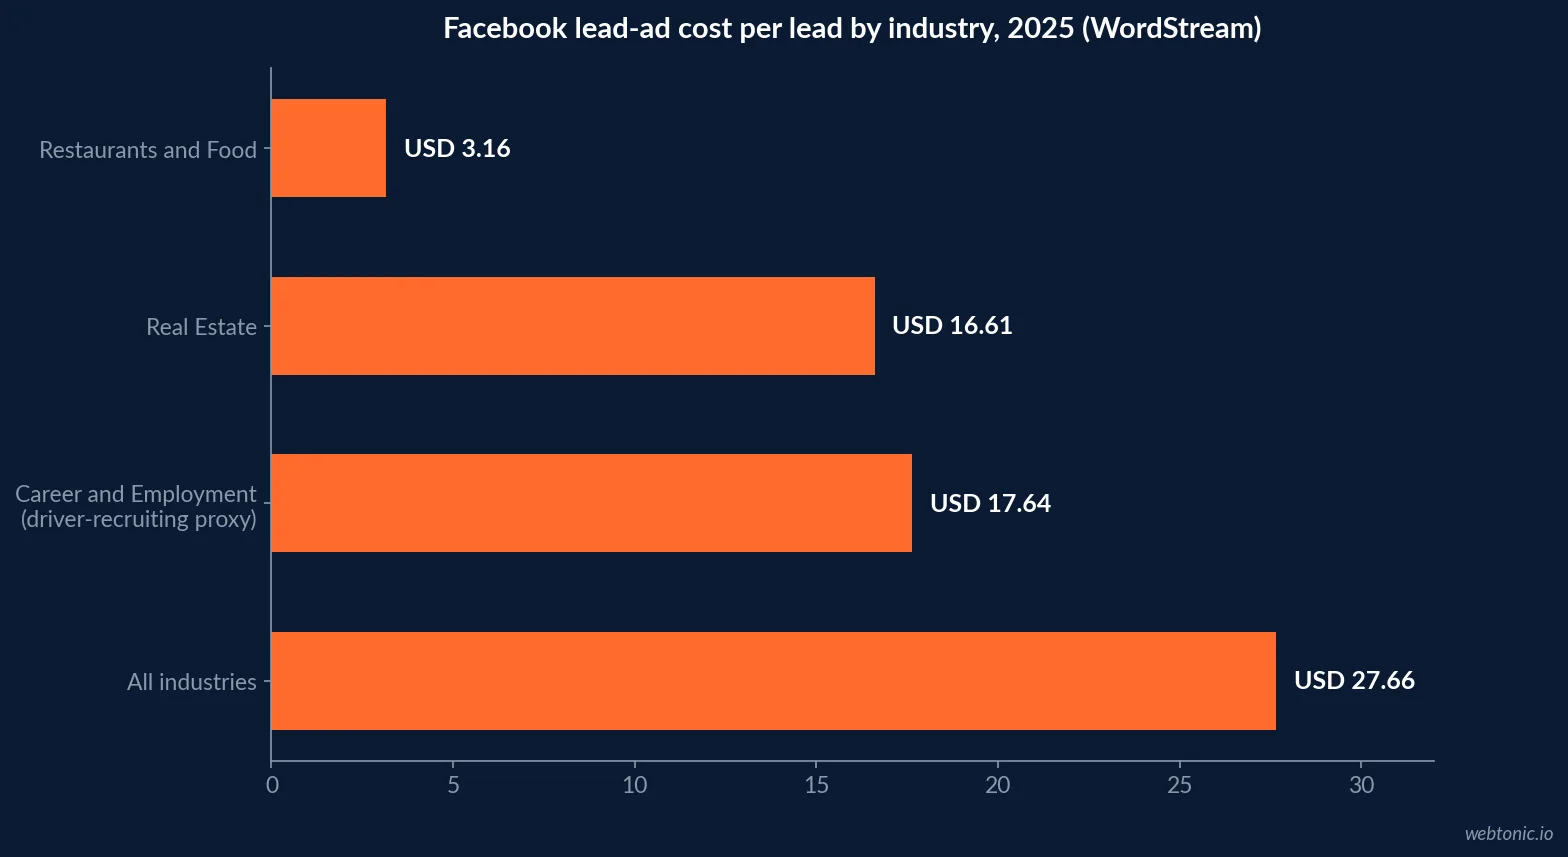
- All-industry cost per lead is USD 27.66, up 20% year over year (WordStream).
- All-industry lead conversion rate is 7.72%, down from 8.67% (WordStream).
- Career and Employment cost per click runs USD 0.86, one of the three cheapest tracked categories (WordStream, driver-recruiting proxy).
- Career and Employment click-through rate rose 34% year over year (WordStream).
- Career and Employment cost per lead runs USD 17.64, well under the USD 27.66 average (WordStream).
- Industrial and Commercial cost per lead rose 62% year over year, the largest increase of any tracked category (WordStream, freight-B2B proxy).
- Industrial and Commercial click-through rate rose 32% year over year (WordStream).
- All-industry traffic-objective click-through rate is 1.71%, at a USD 0.70 cost per click (WordStream).
- Median heavy and tractor-trailer driver pay is USD 58,640 a year (BLS OEWS via O*NET, May 2025).
- C.H. Robinson moved roughly 37 million shipments for 75,000 customers in 2025 across more than 450,000 contract carriers, a scale reminder of how fragmented carrier-side demand really is (C.H. Robinson, 2025 10-K).
Why there is no trucking line in the benchmark reports
WordStream's Facebook Ads Benchmarks 2025, built from 1,180 campaigns running April 1, 2024 through June 30, 2025, groups roughly 20 industries and none of them is trucking, logistics, or freight. That is not an oversight; Meta ad accounts for this industry split cleanly into two unrelated buyer intents, and a single "logistics" bucket would average them into a meaningless number.
The two intents map, imperfectly but usefully, onto two categories WordStream does track: Career and Employment for driver recruiting, and Industrial and Commercial for freight and 3PL B2B outreach. Every figure below is stated against one of those two proxies, never as a trucking-specific number.
| Metric, leads objective (2025) | All industries | Source |
|---|---|---|
| Click-through rate | 2.59% | WordStream |
| Cost per click | USD 1.92 | WordStream |
| Conversion rate | 7.72% | WordStream |
| Cost per lead | USD 27.66 | WordStream |
| Cost per lead, year over year | +20% | WordStream |
Audience one: driver recruiting is a cheap seat on Meta
Using Career and Employment as the closest available proxy, WordStream puts leads-objective cost per click at USD 0.86, one of the three lowest of roughly 20 tracked categories, and cost per lead at USD 17.64, well under the USD 27.66 all-industry average. The same category posted one of the largest click-through rate gains of the year, up 34%.
Set against a median driver salary of USD 58,640 a year (O*NET Online, sourcing BLS OEWS, May 2025), a sub-USD-1 click and a sub-USD-18 lead is an inexpensive way to build a recruiting funnel, which is exactly why so much of the industry's Meta spend already lives here rather than on the freight side.
| Audience proxy | Objective | Cost per click | Cost per lead | CTR, year over year |
|---|---|---|---|---|
| Career and Employment (driver recruiting) | Leads | USD 0.86 | USD 17.64 | +34% |
| Industrial and Commercial (freight/3PL B2B) | Leads | Not disclosed at category level | +62% (no absolute figure published) | +32% |
| All industries (blended benchmark) | Leads | USD 1.92 | USD 27.66 | n/a |
| All industries (blended benchmark) | Traffic | USD 0.70 | n/a (traffic objective) | n/a |
Audience two: freight and 3PL B2B is getting more expensive faster
WordStream does not publish an absolute cost per click or cost per lead for Industrial and Commercial, the closest tracked proxy for freight brokerage and 3PL demand generation. What it does publish is direction, and the direction is stark: cost per lead in this category rose 62% year over year, the single largest increase of any industry WordStream tracked, alongside a 32% rise in click-through rate.
Rising CTR next to rising CPL is a specific signal: more advertisers are bidding into the same B2B audience, and the auction is pricing that competition in. Freight-side Meta budgets should be built assuming that direction continues, not assuming last year's cost holds.
Why the industry can't spend like one advertiser
The reason a single Meta budget line rarely makes sense for this industry is structural. The American Trucking Associations puts trucking at a USD 906 billion industry in which more than 99% of carriers operate 100 trucks or fewer. Trucks still moved 72.7% of the nation's freight by weight in 2024, according to ATA's own economics data, which means enormous freight volume is being carried by operators too small to run a national ad program of any kind.
A one-truck or ten-truck carrier bidding for drivers on Meta is in the same auction as a thousand-truck fleet's recruiting budget. That is one more reason the Career and Employment proxy numbers, not the Industrial and Commercial ones, are the more useful reference point for most of this industry's actual Meta spend.
| Industry structure fact (2026) | Figure | Source | What it means for Meta budgets |
|---|---|---|---|
| Industry size | USD 906 billion | American Trucking Associations | A large market, thinly sliced |
| Carriers at 100 trucks or fewer | Over 99% | ATA | Most ad accounts are tiny by design |
| Freight moved by weight, trucks | 72.7% (2024) | ATA | Volume does not equal ad budget |
| For-Hire Truck Tonnage Index, YoY | Down 1.6% (Aug 2026) | ATA | Softer freight, softer B2B demand |
| Average operating cost per mile | USD 2.336 (2025), up 3.4% | ATRI | Margin pressure caps new spend |
The freight recession is the budget context, not a footnote
ATRI's Analysis of the Operational Costs of Trucking: 2026 Update puts the average cost to run a truck at a record USD 2.336 per mile in 2025, up 3.4% from 2024's USD 2.260, in what ATRI itself describes as the third consecutive year of a freight recession. ATA's own Truck Tonnage Index fell 0.5% in August 2026 and sits 1.6% below a year earlier.
Rising operating costs and softer freight volume argue for a defensive Meta budget: protect the cheap, high-converting recruiting seat that keeps trucks staffed, and treat the pricier, rising-cost freight-B2B seat as a smaller, closely measured test rather than an always-on budget line.
What a defensible Meta budget looks like for this industry
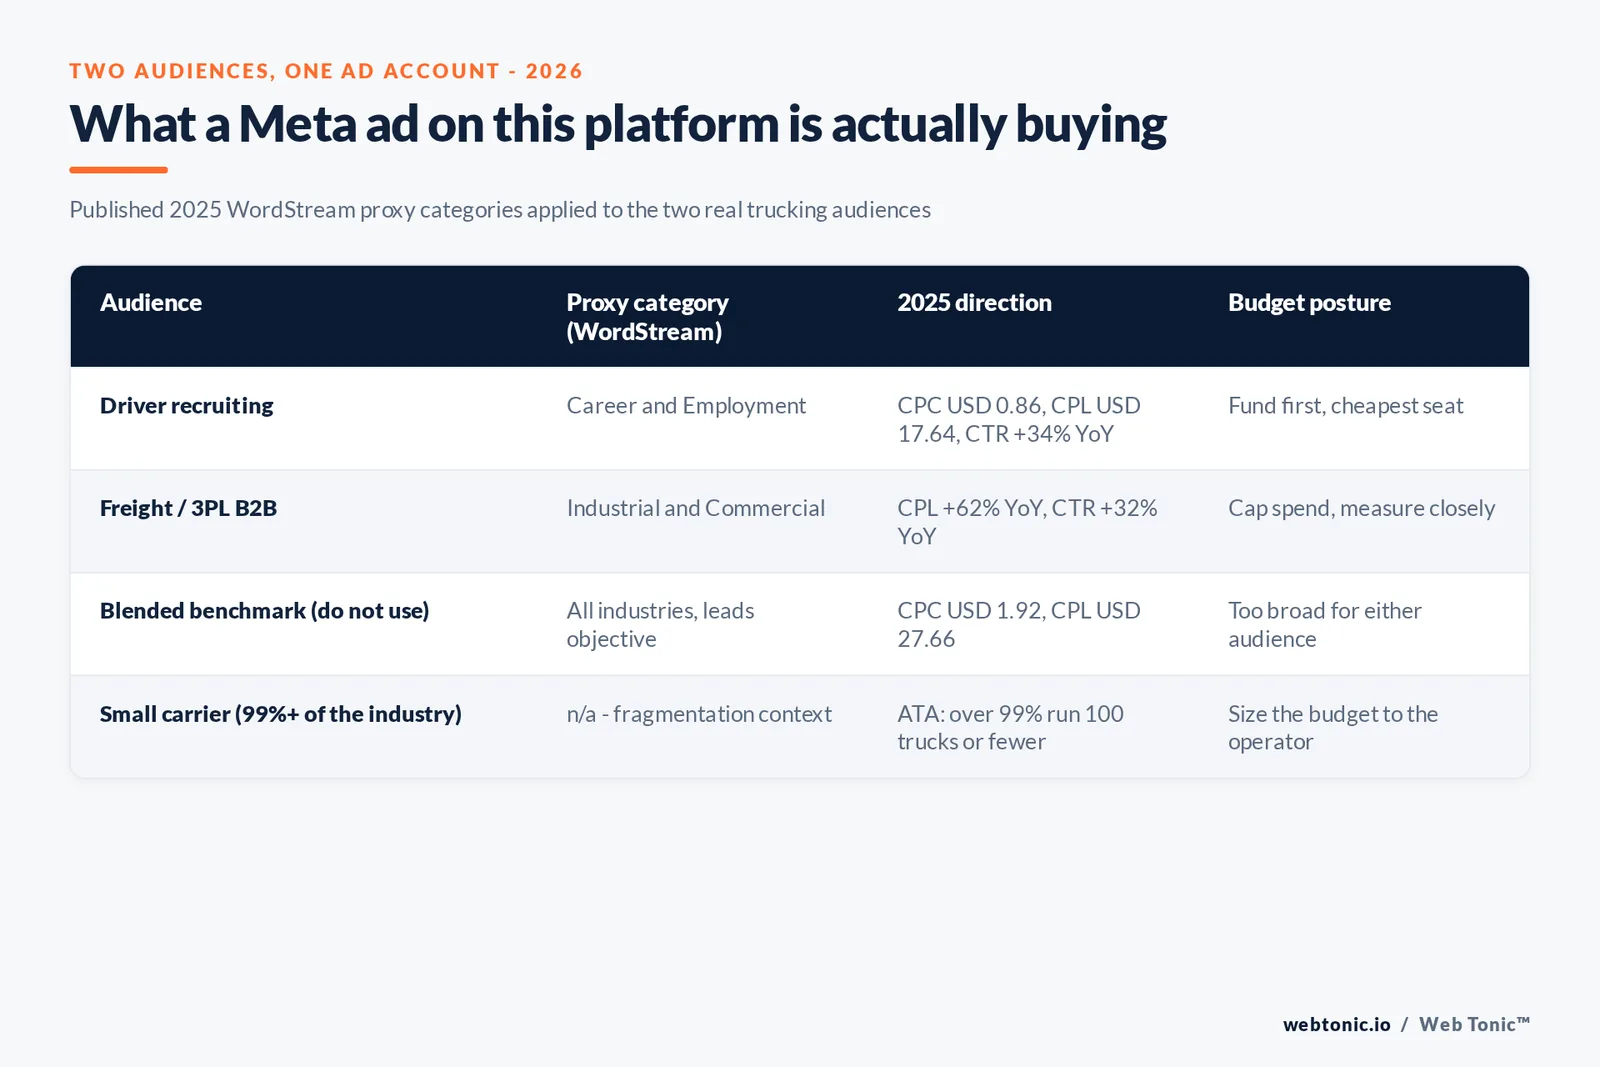
A defensible split treats the two audiences as two campaigns with two different jobs. Recruiting campaigns, benchmarked against Career and Employment, should be judged against a sub-USD-1 click and a cost per lead well under USD 20; underperformance there is a targeting or creative problem, not a market-price problem. Freight-B2B campaigns, benchmarked against Industrial and Commercial, should be judged against rising costs by design, and funded only as far as a measured, tracked pipeline justifies.
Neither number should be confused with a Web Tonic quote. These are third-party category averages applied as a planning proxy, and any carrier's real cost will move with its own creative, targeting and geography.
| Budget decision | Evidence base | Implication |
|---|---|---|
| Fund recruiting first | Career/Employment CPC USD 0.86, CPL USD 17.64 | Cheapest, most measurable seat |
| Cap freight-B2B spend | Industrial/Commercial CPL up 62% YoY | Costs are rising faster than the average |
| Size the account to the carrier, not the market | 99%+ of carriers run 100 trucks or fewer | Most budgets should stay small by design |
| Re-check quarterly, not annually | Freight recession, third year running (ATRI) | Conditions are moving fast enough to require it |
Who is actually behind the freight-B2B click
The Industrial and Commercial proxy audience is not one job title. O*NET Online, sourcing 2025 BLS wage data, puts median pay for logisticians at USD 82,320 a year, with the top 10% earning USD 133,160 or more. That is the buyer persona a freight-B2B Meta campaign is bidding to reach: a mid-to-senior operations or procurement role, not a driver, and not a shipping clerk clicking on impulse.
Creative built for that audience needs to answer a logistics coordinator's actual question, lane coverage, on-time performance, insurance and safety scores, in the first two seconds, because a six-figure buyer scrolling a feed is not converting on a generic "we haul freight" message the way a driver-recruiting ad can convert on pay and home time.
| Buyer persona (freight-B2B side) | Median annual pay | Source |
|---|---|---|
| Logisticians | USD 82,320 | BLS 2025 wage data via O*NET Online |
| Top 10% of logisticians | USD 133,160 or more | BLS 2025 wage data via O*NET Online |
| Heavy and tractor-trailer truck drivers (for comparison) | USD 58,640 | BLS OEWS via O*NET Online |
The freight rate backdrop the ad budget is competing against
Meta ad spend does not exist in a vacuum from the spot market. DAT Freight & Analytics reported the national average van spot linehaul rate fell 20 cents to USD 2.19 a mile in August 2026, in the steepest July-to-August pullback in DAT's 16-year rate history, with contract freight running USD 2.41, a 22-cent gap that had been roughly even the month before.
Falling spot rates squeeze the margin a small carrier has available for any discretionary spend, Meta included. That is one more reason the cheaper, higher-converting recruiting side of the account deserves priority over freight-B2B prospecting when the spot market is actively contracting.
| Freight rate signal, August 2026 | Figure | Source |
|---|---|---|
| Van spot linehaul rate | USD 2.19 a mile | DAT Freight & Analytics |
| Van contract freight rate | USD 2.41 a mile | DAT Freight & Analytics |
| Spot vs contract gap | 22 cents (was near zero in July) | DAT Freight & Analytics |
| Monthly rate move | Down 20 cents, steepest August pullback in 16 years of data | DAT Freight & Analytics |
Why the recruiting side of the budget keeps growing
Independent of Meta specifically, the driver labor market itself argues for protecting recruiting spend. Conversion Interactive Agency and People. Data. Analytics.'s Q2 2026 Driver Recruiting & Retention Data Report found carriers using modern recruiting technology achieved 26% more hires year over year, while carriers relying on traditional methods alone saw a 16% decline in hires over the same period. The same report found 26% of carriers had already raised driver pay in 2026 to stay competitive.
That same research found driver dissatisfaction concentrated in equipment (31.5%), compensation (25.3%) and operations (23.7%), with nearly 60% of compensation-related complaints actually about inconsistent miles rather than advertised pay. A cheap Meta click means nothing if the landing experience does not address what drivers are actually leaving over.
| Q2 2026 driver-recruiting data (Conversion Interactive Agency / PDA) | Figure |
|---|---|
| Hire growth, carriers using recruiting technology | +26% year over year |
| Hire decline, carriers using traditional methods only | -16% year over year |
| Carriers that raised driver pay in 2026 | 26% |
| Top driver dissatisfaction driver: equipment | 31.5% |
| Compensation complaints actually about inconsistent miles | ~60% |
Where to go from here
If Meta is one lane in a broader paid mix, our Meta Ads practice and Google Ads practice both start from the same benchmark discipline used above: proxy categories, stated assumptions, and a budget that is defended with a source, not a guess. For the search side of the same freight and 3PL B2B audience, our breakdown of what Google Ads actually costs is a useful second data point before setting a total paid budget.
Frequently Asked Questions
Does Meta publish a trucking or logistics ad benchmark?
No. WordStream's 2025 Facebook Ads Benchmarks report, built from 1,180 campaigns running April 2024 through June 2025, does not list a trucking or logistics category. The closest published proxies are Career and Employment (driver recruiting) and Industrial and Commercial (freight and 3PL B2B), and this page treats them as proxies, not exact figures, throughout.
What does a driver-recruiting Meta ad actually cost?
Using the Career and Employment proxy, WordStream reports a cost per click of USD 0.86 for the leads objective, among the three lowest of roughly 20 tracked categories, against a USD 1.92 all-industry average. The same category's click-through rate rose 34% year over year, the second-largest gain of any tracked industry. Recruiting ads are, on this evidence, a genuinely cheap way to reach a driver audience on Meta.
Is Meta getting more expensive for freight and logistics B2B advertisers?
Directionally, yes. The Industrial and Commercial proxy category saw cost per lead rise 62% year over year, the single largest increase WordStream recorded across every tracked industry, alongside a 32% click-through rate gain. Rising CTR alongside rising CPL usually means more advertisers are bidding on the same B2B audience, not that the audience itself is responding worse.
Why can't most carriers spend like a national fleet on Meta?
Because the industry is overwhelmingly small. The American Trucking Associations puts trucking at a USD 906 billion industry in which more than 99% of carriers run 100 trucks or fewer. A one-truck or ten-truck operation is competing in the same auction as a national fleet's recruiting budget, which is exactly why the cheaper Career and Employment proxy numbers matter more to most of this industry than the B2B proxy does.
Should freight recession conditions change the Meta budget?
They should shrink the freight-B2B side of it, not the recruiting side. ATRI's 2026 Update puts the average cost to operate a truck at a record USD 2.336 per mile in 2025, up 3.4% year over year, in what ATRI describes as the industry's third straight year of a freight recession. Margin pressure like that argues for protecting driver-seat spend, which keeps trucks moving, ahead of prospecting spend for freight that a shrinking market may not reward.
Sources
WordStream - Facebook Ads Benchmarks 2025
American Trucking Associations - Economics and Industry Data
American Trucking Associations - Navigate the Challenges of 2026
American Trucking Associations - Truck Tonnage Index, August 2026
American Transportation Research Institute - Operational Costs of Trucking, 2026 Update
O*NET Online (sourcing BLS OEWS) - Heavy and Tractor-Trailer Truck Drivers wages
O*NET Online (sourcing BLS OEWS) - Logisticians wages
DAT Freight & Analytics - Spot van rate falls, August 2026
Conversion Interactive Agency / PDA - Q2 2026 Driver Recruiting & Retention Data Report
C.H. Robinson Worldwide - 2025 Annual Report / 10-K