Table of contents
The average tax and accounting firm website takes 8.49 seconds to render its main content - almost six seconds past Google’s 2.50-second threshold - and 84.6% of graded firm homepages score a C or lower. Webflow sites pass Core Web Vitals at roughly 58% versus 42% for WordPress. That is the case, and the caveats, in one paragraph.
Key Takeaways
- Across 385 US accounting and tax sites, average LCP is 8.49s against a 2.50s threshold, and FCP is 3.75s against 1.80s.
- 70% of accounting sites score below 70 on PageSpeed; slow main content was flagged on 72.4%.
- Only 47.2% publish JSON-LD schema, 54.9% have a meta description and 60.6% a canonical tag.
- 84.6% of graded firm homepages lack online scheduling; the median homepage scores 71/100.
- Webflow passes all three Core Web Vitals on about 58% of sites versus 42% for WordPress, with mobile LCP of 2.4s versus 3.2s.
- WordPress runs 33.21% of measurable web origins and about 64% of sites with a detectable CMS; Webflow sits at 0.73% of origins and roughly 2.5% of the top 10 million sites.
- Webflow plans run $14-$39/month with hosting, CDN, SSL and security included; WordPress needs $30-$100+/month managed hosting plus tooling.
- 7,966 WordPress vulnerabilities were reported in a single year, 96% originating in plugins.
- Sites passing all three Core Web Vitals were ~35% more likely to rank in positions 1-3.
- A one-second delay cuts conversion about 7%; over three seconds, bounce approaches 40%.
- Accounting site traffic is 62% desktop but over 60% of overall web traffic is mobile - and mobile is where the failures cluster.
- Firm landing pages convert at 3.6% on average, with the top decile at 11.4% and a 22% lead-to-client close rate.
The state of accounting firm websites
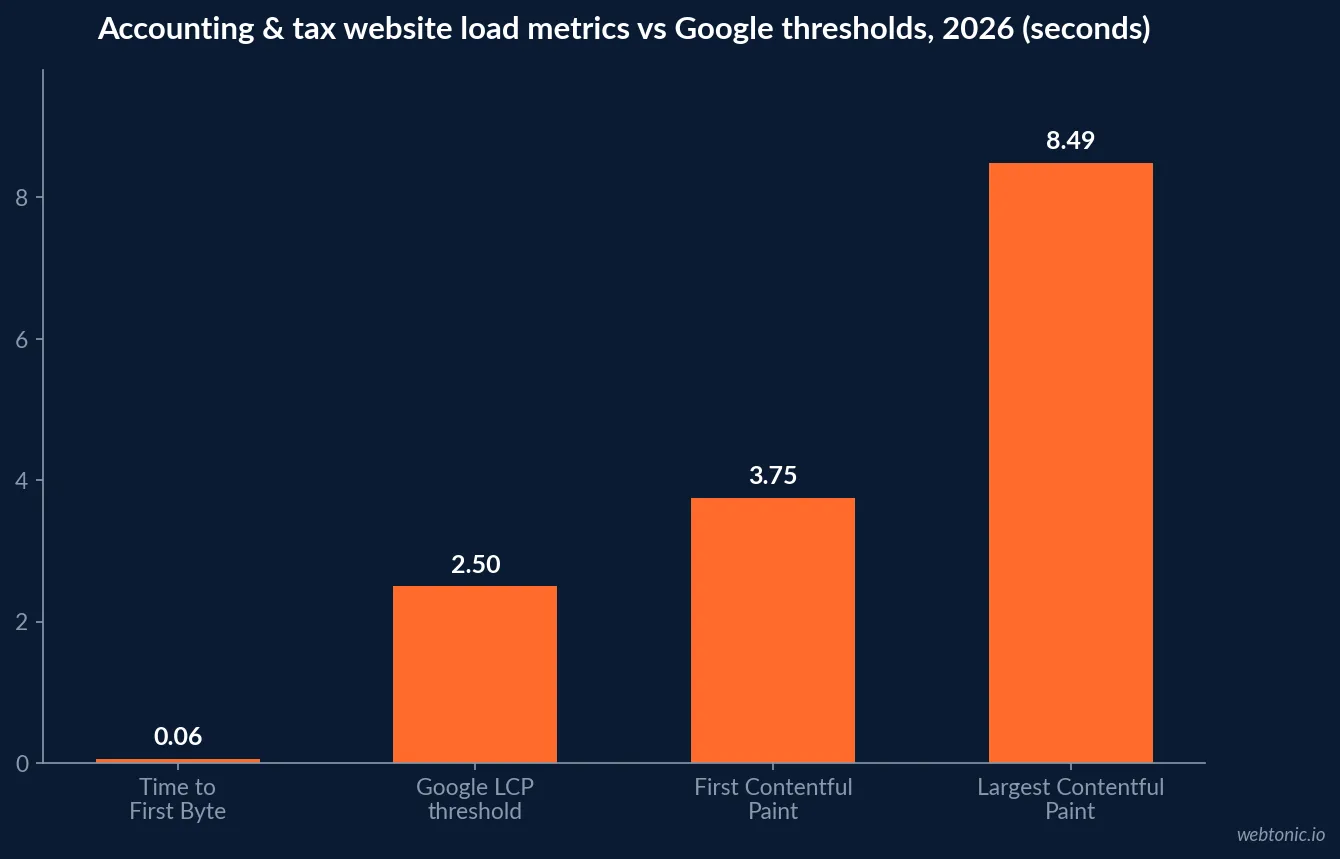
Start with the audit rather than the platform debate. Borah Labs’ benchmark of 385 US accounting and tax sites (July 2026) records an average Largest Contentful Paint of 8.49 seconds against Google’s 2.50-second passing mark, a First Contentful Paint of 3.75 seconds against 1.80, and a Time to First Byte of 0.06 seconds - meaning the server is fast and everything after it is slow. That is a front-end problem: render-blocking scripts, unoptimised images and plugin bloat, not hosting.
| Metric | Accounting & tax average | Google threshold | Gap |
|---|---|---|---|
| Largest Contentful Paint | 8.49s | 2.50s | +5.99s |
| First Contentful Paint | 3.75s | 1.80s | +1.95s |
| Time to First Byte | 0.06s | 0.80s | Passing |
| PageSpeed score below 70 | 70% of sites | n/a | Majority failing |
| Structured data (JSON-LD) | 47.2% | n/a | 52.8% invisible to rich results |
| Meta description populated | 54.9% | n/a | 45.1% ceding SERP control |
The crawl and hygiene layer is no better. The same dataset flags duplicate title tags on 75.5% of sites, broken links on 50.3%, no sitemap on 42.8%, and a viewport meta tag present on only 81.7% - which means nearly one firm in five still serves a desktop-zoomed page to a phone. Open Graph tags are present on 59.3%, so most firms have no control over how a link previews when a client shares it.
Conversion gaps that no platform fixes on its own
Speed is the visible failure; the conversion architecture is the expensive one. Grading of real US accounting homepages by Codivox puts the median at 71 out of 100, with 84.6% scoring a C or lower. The missing elements are consistent across the sample and each one is a booked consultation lost.
| Missing element | Share of firm homepages | Why it costs money |
|---|---|---|
| Online scheduling calendar | 84.6% | The single most common gap; forces email ping-pong |
| Clear specialization / niche | 69.2% | Undifferentiated firms compete on price |
| Lead magnet (calculator or guide) | 66.7% | No capture for the 98% who do not convert |
| Google Maps / reviews embed | 66.7% | 96% of buyers check reviews before first contact |
| Pricing or how-we-price | 53.8% | Silence pushes buyers to the next firm |
| JSON-LD structured data | 52.8% | No rich results, weaker AI-answer citation |
Those gaps show up in conversion data. Accounting firm landing pages convert at 3.6% on average, the top decile of firms reaches 11.4%, and lead-to-client close sits at 22% per accounting industry benchmarks. Firm-side reporting suggests most professional services sites land between 2% and 5%, with stronger niche sites reaching 6%-10%, and that moving from 1%-2% to 3%-5% is routine without adding a single visitor, according to Build Your Firm. The average form conversion rate across industries is 2.9%, and 98% of visitors leave without taking any action.
Webflow versus WordPress on measured performance
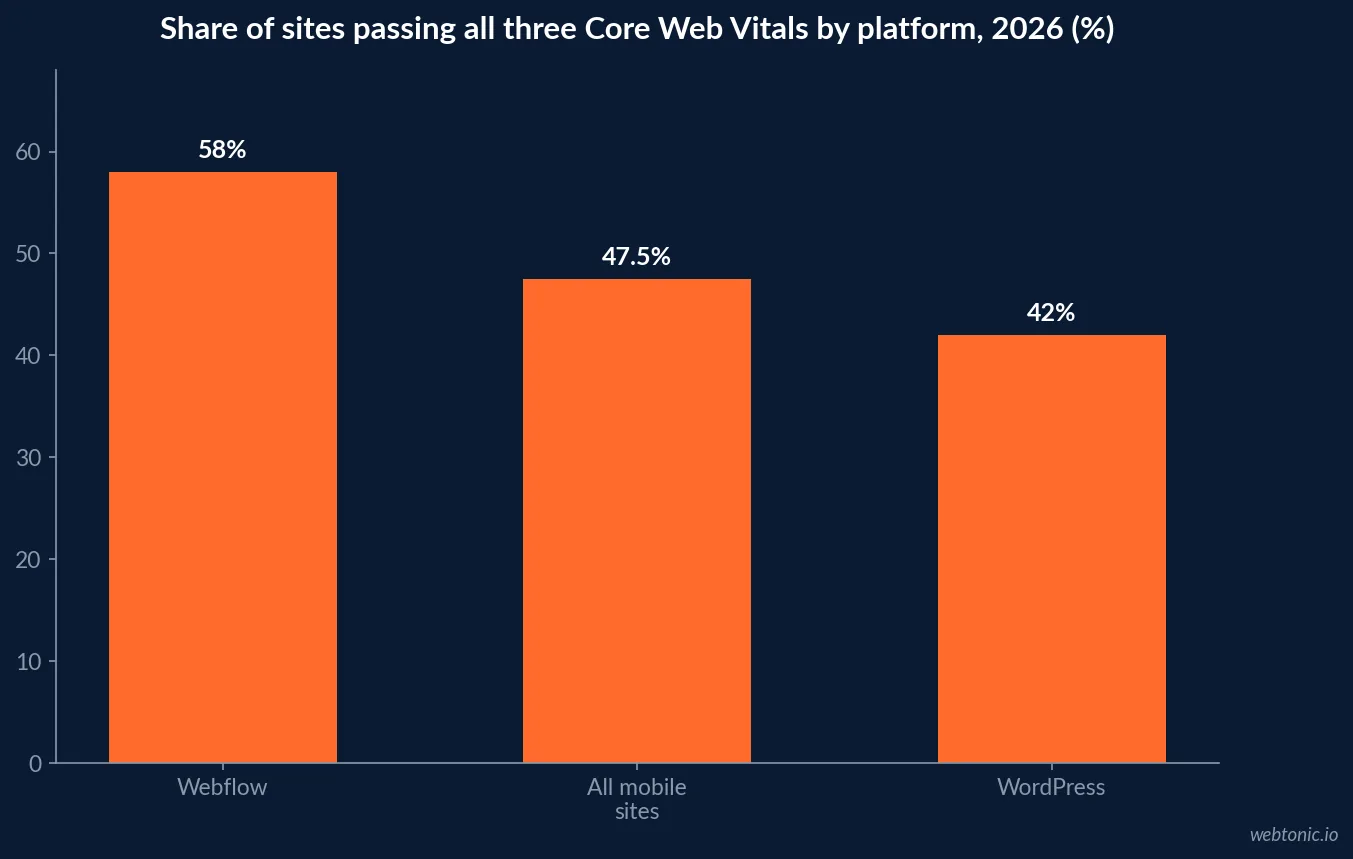
This is where platform choice earns its keep. HTTP Archive-derived reporting puts Webflow’s Core Web Vitals pass rate at roughly 58% against WordPress at 42%, with average mobile LCP of 2.4 seconds versus 3.2 seconds. For context, only about 47%-48% of mobile sites pass all three vitals at all, so both platforms sit near the middle of a difficult distribution - Webflow simply sits on the better side of it. Provider-level Core Web Vitals data shows the same ordering on individual metrics, with WordPress failing LCP on about 31% of sites.
| Dimension | Webflow | WordPress | Source basis |
|---|---|---|---|
| Core Web Vitals pass rate | ~58% | ~42% | HTTP Archive-derived reporting |
| Average mobile LCP | 2.4s | 3.2s | Platform comparison analysis |
| Share of measurable web origins | 0.73% | 33.21% | HTTP Archive, April 2026 |
| Share of top 10 million sites | ~2.5% | ~43% | Technology detection surveys |
| Annual security vulnerabilities | Platform-managed | 7,966 (96% in plugins) | Patchstack CNA reporting |
| Base monthly cost | $14-$39 all-in | $30-$100+ hosting plus tooling | Vendor pricing |
Two honest qualifications. First, the WordPress sample includes everything from lean custom themes to page-builder monoliths - 32.67% of WordPress sites run Elementor per HTTP Archive-based WordPress statistics - so the platform average punishes WordPress for choices its users made. A well-built WordPress site beats a badly built Webflow site every time. Second, WordPress is not collapsing: it peaked at 35.76% in July 2022 and has eased to 33.21%, a slow decline rather than a rout, and nearly 48.3% of the measurable web runs no detectable CMS at all.
Why Core Web Vitals matter for a firm that ranks locally
Analysis referenced by platform SEO comparisons found that sites passing all three Core Web Vitals in 2025-2026 were about 35% more likely to appear in positions 1-3 than sites failing them, controlling for content quality and backlinks. Layer that onto the accounting funnel: organic search delivers 48%-54% of firm traffic, the top three organic positions capture an estimated 45%-60% of clicks on high-intent queries, and tax season lifts traffic 45% between January and April. A speed deficit is therefore a seasonal revenue deficit.
The conversion arithmetic compounds it. Pages taking longer than three seconds face nearly 40% bounce rates, bounce probability rises 32% as load moves from one to three seconds, each additional second costs about 7% of conversions, and 75% of consumers judge credibility on design. At an 8.49-second LCP, a firm is paying full price for clicks and losing most of them before the page paints.
Total cost of ownership
Webflow bundles what WordPress itemises. Plans run $14 to $39 per month billed annually with hosting, CDN, SSL and security included, and Webflow CMS scaled to support up to 1 million items per project as of January 2026, per platform comparison research. A performance-equivalent WordPress stack needs premium managed hosting at $30-$100+ per month, a caching plugin around $59 per year, image optimisation at $5-$10 per month and periodic developer audits. WordPress malware incidents cost small businesses $4,000-$8,000 per cleanup, and 40% of installations run outdated versions.
| Cost line | Webflow | WordPress (managed) | Notes |
|---|---|---|---|
| Initial build | $15,000-$60,000 (enterprise-grade) | $5,000-$25,000 | Small-firm brochure sites far below both |
| Hosting / platform | Included in $14-$39/mo | $30-$100+/mo | Webflow includes CDN and SSL |
| Plugins & tooling | $0 (built in) | $100-$500/yr | Caching, SEO, image optimisation |
| Annual maintenance | $1,000-$5,000 | $2,000-$8,000 | Security patching drives the WordPress side |
| Security incident risk | Platform-managed | $4,000-$8,000 per cleanup | 96% of CVEs originate in plugins |
| Uptime commitment | 99.9% SLA on AWS | Host-dependent | Automatic scaling |
What migrations actually produced
Vendor-published case studies should be read as directional, not typical - they are selected and self-reported. Still, the pattern is consistent enough to be useful: a mobile marketing company recorded a 27% traffic increase in the first week post-launch and a 14% impressions increase; a commercial real estate advisory cut its content update cycle from a month to a day and reported a 56% increase in form fills plus 23% more organic traffic; a data platform reported a 98% increase in speed to market and 4x more SEO content production. A Forrester Total Economic Impact study commissioned by Webflow found a 332% three-year ROI across a composite of enterprise customers.
The transferable lesson for a firm is not the percentages - it is the mechanism. Every one of those wins came from removing developer dependency so marketing could ship pages. For an accounting firm, that means service pages per niche and city pages per office, which is exactly the work that organic growth programmes depend on.
A migration checklist for a firm site
- Fix scheduling first. With 84.6% of firms lacking a calendar, embedded booking is the highest-return single change.
- Ship JSON-LD on every template. 52.8% of firm sites publish none, which also weakens AI-answer citation.
- Budget images properly. TTFB is already 0.06s; the 8.49-second LCP is almost entirely front-end weight.
- Redirect at parity. Duplicate titles affect 75.5% of firm sites and broken links 50.3% - migration is the moment to clear both.
- Build a niche page per specialization. 69.2% of firms show no niche at all.
- Add reviews and a map embed. Missing on 66.7%, and 96% of buyers check reviews first.
- Publish a pricing page or a pricing model. 53.8% say nothing about price.
- Do it outside January-April. Tax season carries 60%+ of annual client acquisition; do not migrate into it.
Where platform choice stops mattering
Webflow will not make an undifferentiated firm rank. Generative AI use among tax and accounting firms jumped from 8% to 21% in a single year, high-growth firms spend 2.1% of revenue on marketing - twice the rest - and grew revenue 38.5%, and 69% of firms still rely mostly on word of mouth. Platform is the floor, not the strategy. The firms winning are the ones pairing a technically clean site with content and local search work and honest measurement and a credible next step on every page; the platform simply stops the site from being the bottleneck. If paid traffic is part of the mix, the same speed gains lift search campaign quality scores and landing page experience scores as a side effect.
Limits of this data
Three caveats. Platform market-share figures differ by an order of magnitude depending on method: HTTP Archive measures crawlable origins and puts Webflow at 0.73%, while top-site technology surveys put it near 2.5% of the top 10 million - both are correct about different populations. Core Web Vitals pass rates by CMS come from small provider samples in some datasets, so the 58%-versus-42% gap is a reliable direction with a soft margin. And every migration outcome quoted here is vendor-published and self-selected; treat them as existence proofs, not expectations.
Frequently Asked Questions
How slow are accounting firm websites in 2026?
Slower than almost any other professional-services category. An analysis of 385 US accounting and tax firm sites found an average Largest Contentful Paint of 8.49 seconds against Google's 2.50 second threshold - roughly six seconds over - with First Contentful Paint at 3.75 seconds. Seventy percent of those sites score below 70 on PageSpeed, and slow main content was flagged on 72.4% of them. Since a one-second delay cuts conversion roughly 7% and bounce probability rises 32% between one and three seconds, that gap has a direct revenue cost.
Is Webflow better than WordPress for an accounting firm website?
On measured technical outcomes, yes; on ecosystem and cost flexibility, WordPress still wins. HTTP Archive-based reporting puts Webflow's Core Web Vitals pass rate at roughly 58% against WordPress at 42%, with average mobile LCP of 2.4 seconds versus 3.2 seconds. Webflow includes hosting, CDN, SSL and security in plans from $14 to $39 per month, whereas an equivalent WordPress stack needs managed hosting at $30-$100+ per month plus caching and image tooling. WordPress's counter-argument is scale and choice: it runs 33.21% of measurable web origins and about 64% of sites with a detectable CMS.
What does a Webflow site cost for a tax or accounting firm?
Plan on $14-$39 per month for hosting on a Business plan, plus a one-off build. Agency pricing for a professional-services Webflow build commonly runs $15,000-$60,000 for enterprise-grade work, with small-firm brochure sites well below that; comparable WordPress builds are quoted at $5,000-$25,000 with $2,000-$8,000 in annual maintenance. The honest framing is total cost of ownership: Webflow front-loads cost and removes recurring plugin, security and hosting overhead, while WordPress front-loads less and spreads more.
Does site speed actually affect an accounting firm's leads?
Yes, and the mechanism is measurable. Sites passing all three Core Web Vitals were about 35% more likely to appear in positions 1-3 in 2025-2026 analyses, controlling for content and links. On the conversion side, pages taking over three seconds face nearly 40% bounce rates, each one-second delay cuts conversion around 7%, and 75% of consumers judge credibility on design. With 60-65% of traffic arriving on mobile, mobile LCP is the metric that decides whether a firm's paid and organic clicks turn into consultations.
What is the single biggest gap on accounting firm websites?
Online scheduling. Grading of real US accounting firm homepages found 84.6% missing an online scheduling calendar, 69.2% missing a clear specialization or niche, 66.7% missing a lead magnet, and 66.7% missing Google Maps or reviews. The median homepage scores 71 out of 100 and 84.6% grade C or lower. Structured data is missing on 52.8% of sites and 42.9% have no sitemap - so the gap is not design taste, it is basic conversion and crawl infrastructure.
Sources
Borah Labs - Accounting & Tax Website Benchmarks (385 sites)
Codivox - State of Accountant Websites
GravityKit - WordPress Statistics (HTTP Archive)
State of CWV - Core Web Vitals by CMS
WordPress vs Webflow SEO Analysis
Hubstic - Webflow vs WordPress 2026
Build Your Firm - Accounting Website Conversion Benchmarks
CUFinder - Accounting Industry Benchmarks 2026
Composite - WordPress vs Webflow 2026
MYCPE ONE - CPA Firm Website Conversion Failures