Table of contents
Accounting firms build real-time dashboards for their clients and run their own practice on a month-end spreadsheet. With realization targets sitting at 85-92% and write-downs happening weekly, that lag is where firm profit quietly leaks.
Key Takeaways
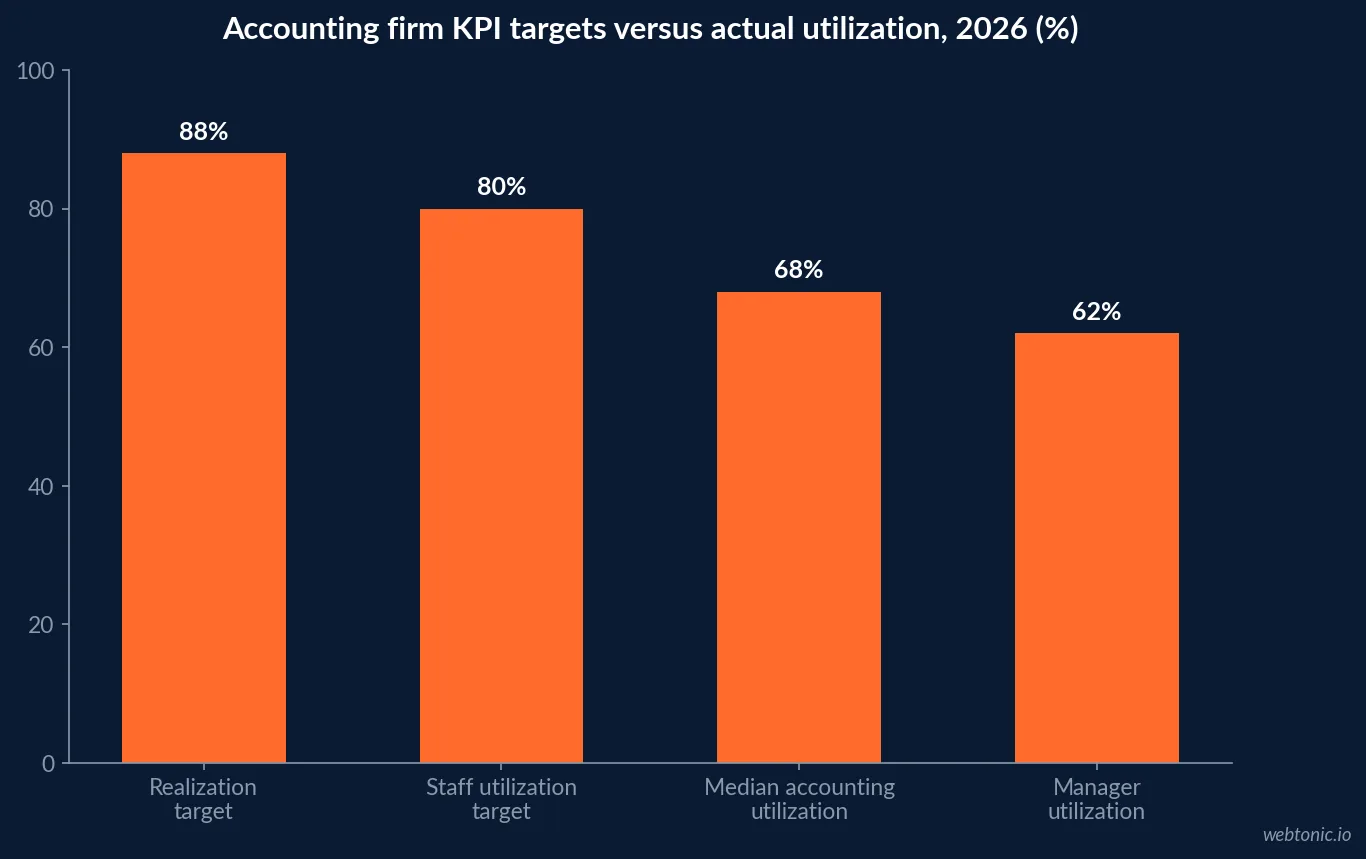
- Realization rate target is 85-92% for well-managed firms; best-in-class hold above 88%.
- Realization below 78% signals a systemic write-down problem, not individual performance.
- Firm-wide realization has hovered between 85% and 90% in recent benchmark surveys.
- Staff utilization target is 80%+; managers and directors 55-70%.
- Accounting and audit median utilization is 68% - bottom quartile 58%, top quartile 78%, best-in-class 84%.
- Keep most WIP under 45 days and treat the 60-day bucket as an intervention threshold.
- DSO target is under 45 days, with AR over 90 days below 15% of the balance.
- Invoice within 0-14 days of completion; lag beyond 30 days correlates with write-downs.
- Client retention below 85% annually indicates a service-quality problem that compounds.
- Utilization below 60% for domestic staff suggests overstaffing or poor work allocation.
- Revenue per FTE, revenue per partner and leverage all rose in IPA’s early 2026 survey results.
- The share of revenue from traditional charge-hour billing has declined as fixed-fee and value pricing grow.
- Median firm revenue growth was 6.7%, down from 9.1% in the prior AICPA MAP survey.
- Net remaining per partner rose 11.9%, from $225,725 to $252,663.
- 81% of MAP respondents were firms at $5M revenue or below - these are small-firm benchmarks.
- AI use is already appearing in client communications, real-time dashboards and forecasting models.
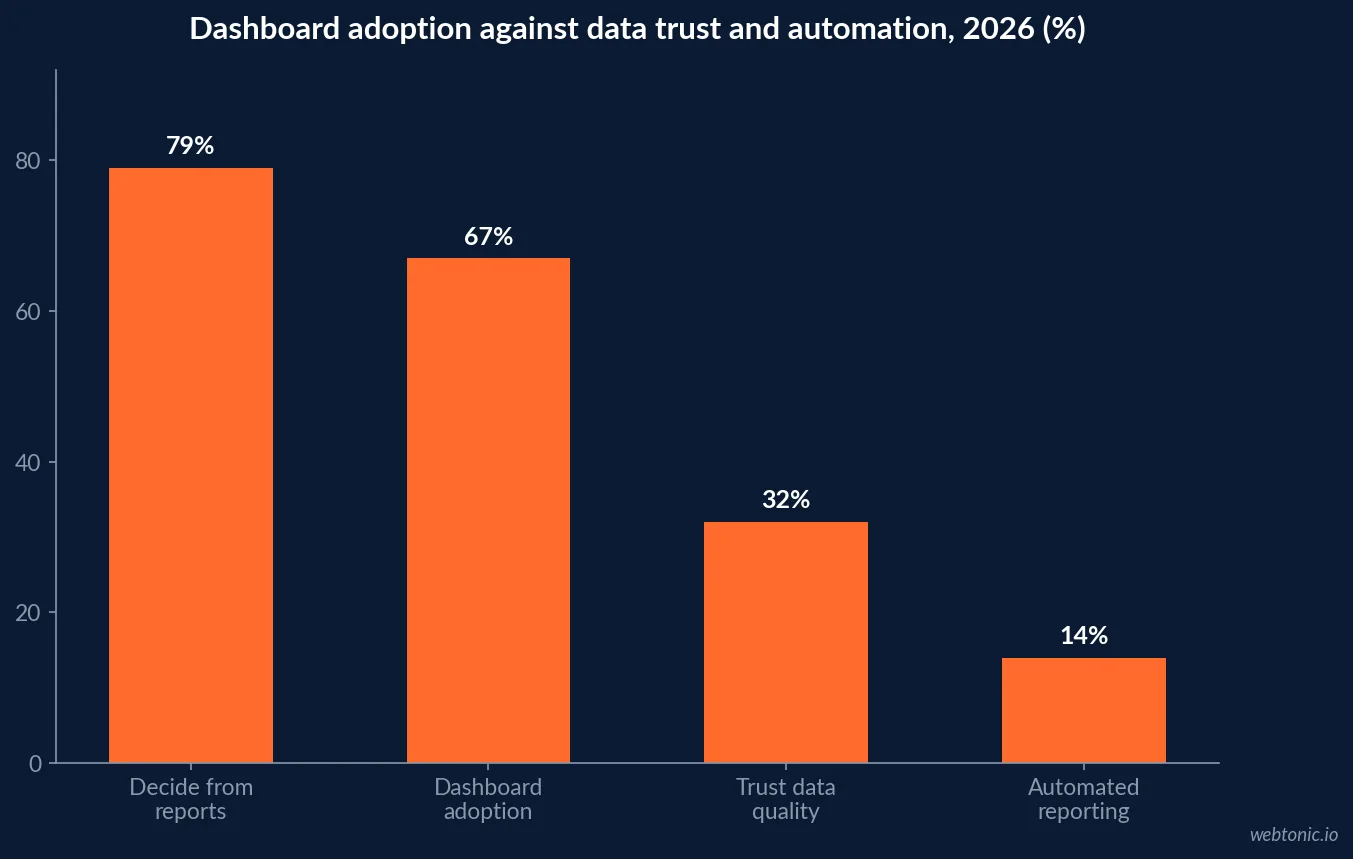
- Enterprise dashboard adoption is about 67%, up from 52% in 2020.
- 79% of executives decide from reports but only about 32% trust their data quality.
- Tax season drives 60%+ of annual acquisition, so marketing reporting must be seasonal.
- NPS falls from 84 at 15+ years to 37 at 6-9 years of client tenure.
The six numbers a firm dashboard has to carry
The 2026 target ranges are well established. Realization of 85-92% for well-managed firms, staff utilization at 80%+ and 55-70% for managers and directors, the bulk of WIP under 45 days with 60 days as an intervention line, DSO under 45 days with over-90-day AR below 15% of the balance, and invoicing within 0-14 days of work completion. Realization under 78% is read as a systemic write-down problem - scope creep, pricing misalignment or billing delay - rather than a staffing issue.
Independent guidance lands in the same band: firm-wide realization has hovered between 85% and 90% in recent benchmark surveys, and client retention below 85% annually or utilization below 60% for domestic staff are treated as structural warnings.
| KPI | 2026 target | Warning threshold | Review cadence |
|---|---|---|---|
| Realization rate | 85-92% | Below 78% | Weekly by partner and service line |
| Staff utilization | 80%+ | Below 60% | Weekly |
| Manager / director utilization | 55-70% | Below 50% | Monthly |
| WIP aging | Majority under 45 days | Over 60 days | Weekly |
| DSO | Under 45 days | 90-day AR above 15% | Weekly |
| Billing velocity | 0-14 days | Beyond 30 days | Weekly |
Utilization: where firms actually sit versus the target
Targets and reality diverge. Cross-industry professional services benchmarks put accounting and audit median utilization at 68%, with a bottom quartile of 58%, a top quartile of 78% and best-in-class at 84% - below management consulting at 72% median and IT services at 75%. A firm sitting at 68% is average for the sector and 12 points under the staff-level target, which is a capacity conversation rather than a dashboard colour.
That gap is the argument for weekly visibility. A 10-point utilization swing during tax season is invisible in a month-end report and obvious in a weekly one, and by the time a month-end pack shows the write-down, the client has already received the invoice they will push back on.
| Sector | Median utilization | Bottom quartile | Top quartile |
|---|---|---|---|
| Accounting and audit | 68% | 58% | 78% |
| IT services and SI | 75% | 65% | 83% |
| Management consulting | 72% | 62% | 80% |
| Engineering and architecture | 70% | 60% | 79% |
| Marketing and creative | 65% | 55% | 75% |
| Accounting staff-level target | 80%+ | n/a | 84% best-in-class |
The KPI set is shifting away from hours
Inside Public Accounting’s early 2026 Practice Management Survey results show the share of revenue from traditional charge-hour billing declining while fixed-fee and value-based pricing gain ground, with revenue per FTE, revenue per partner and leverage all moving up. When revenue stops tracking hours, utilization and realization stop being sufficient - they measure the input to a price that no longer depends on it.
That reframes the dashboard. Outcome metrics - revenue per FTE, margin per engagement, effective rate, leverage - describe whether the firm converts capacity into value; realization and utilization together decide whether growth becomes profit. A busy firm with poor realization is just working hard to stand still.
| KPI generation | Metric | What it answers | Best for |
|---|---|---|---|
| Hours-based | Utilization | Is capacity being sold | Charge-hour service lines |
| Hours-based | Realization | Is billed work collected | All firms |
| Outcome-based | Revenue per FTE | Is the workforce productive | Fixed-fee and value pricing |
| Outcome-based | Revenue per partner | Is the model scaling | Partnership economics |
| Outcome-based | Leverage | Is work pushed down properly | Growing firms |
| Outcome-based | Margin per engagement | Is this client worth it | Advisory and CAS |
Firm economics give the dashboard its stakes
The AICPA’s 2025 National MAP Survey - the largest benchmarking survey of US public accounting practices, with 81% of responses from firms at $5M revenue or below - reported median net client fee growth of 6.7%, down from 9.1% two years earlier, while net remaining per partner rose 11.9% from $225,725 to $252,663. Growth slowed and per-partner profit rose, which is a story about margin management, and margin management is a reporting function.
The same survey notes AI and automation usage already appearing in client communications, real-time dashboards and forecasting models, while most firms have yet to allocate formal budgets or structured training for it. Firms are adopting the tooling faster than the operating discipline around it.
Adoption is high, trust is low, automation is rare
The wider dashboard picture explains why so many firm reporting projects stall. Enterprise dashboard adoption sits at roughly 67%, up from 52% in 2020, and about 79% of executives say they make decisions from reports - but only around 32% say they trust their data quality and only about 14% have automated the reporting itself. That combination produces confident decisions on unverified numbers, which is worse than no dashboard.
For accounting firms the trust problem has a specific cause: the numbers are assembled by hand from practice management exports, so every refresh is a person’s afternoon and every discrepancy is attributed to the assembly rather than the business. Automating the pull is usually the cheapest single improvement to trust, which is the premise of our data intelligence engagements.
Reporting maturity by firm size
Reporting capability in accounting scales with headcount rather than ambition, and the AICPA MAP sample is a reminder of the real distribution: 81% of respondents were firms at $5M revenue or below. A ten-person practice does not need a BI deployment; it needs the six operational numbers pulled automatically once a week and read out loud in a fifteen-minute meeting. The failure mode at every size is the same - a pack that exists and is never presented - but the remedy scales.
| Firm size | Typical reporting today | Next upgrade | Expected gain |
|---|---|---|---|
| Solo to 5 staff | Month-end spreadsheet | Weekly one-page WIP and AR view | Faster billing, less write-down |
| 6-25 staff | Practice management exports | Automated pull, realization by partner | Write-downs caught in week |
| 26-100 staff | Monthly partner pack | Service-line profitability plus pipeline | Mix decisions on evidence |
| 100-500 staff | Departmental dashboards | Revenue per FTE and leverage layer | Outcome-based pricing support |
| 500+ staff | BI platform | Governed data model, trust metrics | Decisions on verified numbers |
| Any size | No client-experience metric | NPS segmented by tenure | Catches the 6-9 year trough |
One structural note for smaller firms: the benchmark ranges quoted above come predominantly from small and mid-sized practices, so they are usable as-is rather than as aspirational large-firm numbers. Realization of 85-92%, DSO under 45 days and billing within two weeks of completion are achievable in a ten-person office with a weekly report and no software purchase at all. What is not achievable without reporting is knowing which of the three went wrong when profit per partner slips.
The marketing half nobody puts on the screen
Practice dashboards answer whether work is profitable. They do not answer whether next season’s work exists. In a profession where tax season drives 60%+ of annual acquisition at a $4.44 median Google Ads CPC and a $101 CPA, pipeline reporting has a harder deadline than WIP does - and it is almost never in the same pack.
Client-experience data belongs there too. ClearlyRated’s March 2026 survey of 180 accounting clients found NPS falling from 84 at 15+ years to 54 at 3-5 years and 37 at 6-9 years, with 91% of buyers wanting proactive advisory against 27% of firms initiating it. No financial KPI on a practice dashboard would surface a mid-tenure book quietly preparing to leave. Our growth reporting pairs the two halves deliberately.
| Reporting layer | Core metrics | Cadence | Owner |
|---|---|---|---|
| Practice performance | Realization, utilization, WIP, DSO | Weekly | Managing partner |
| Firm economics | Revenue per FTE, per partner, leverage | Monthly | Firm administrator |
| Pipeline | Enquiries, consultations, engagement letters | Weekly in season | Marketing lead |
| Acquisition efficiency | CPL, cost per client, source mix | Monthly | Marketing lead |
| Client experience | NPS by tenure, advisory initiation rate | Quarterly | Client service lead |
| Season readiness | Pipeline for next Q1, capacity plan | Monthly off-season | Partner group |
How to build a dashboard a partner group will actually use
- One page, six numbers. Realization, utilization, WIP aging, DSO, revenue per FTE and pipeline for next season.
- Weekly for realization and WIP. The 2026 guidance is explicit that monthly review arrives after the damage.
- Thresholds, not colours. Below 78% realization, over 60-day WIP and 90-day AR above 15% are actions, not amber.
- Add one outcome metric - revenue per FTE - as fixed-fee revenue grows.
- Automate the pull. With only about 14% of reporting automated, manual assembly is the main source of distrust.
- Put pipeline beside profit, because 60%+ of acquisition happens in one quarter.
- Segment NPS by tenure to catch the 6-9 year trough at NPS 37.
- Report creative and campaign output too - see our performance creative reporting for the pipeline side.
- Name an owner per layer. Unpresented dashboards decay; if nobody owns the pipeline view, get one appointed.
Frequently Asked Questions
What KPIs should an accounting firm dashboard actually show?
Six operational numbers cover most of it: realization rate against an 85-92% target, staff utilization at 80%+ for staff and 55-70% for managers and directors, WIP aging with the bulk under 45 days, DSO under 45 days with over-90-day AR below 15% of the balance, billing velocity of 0-14 days from completion to invoice, and revenue per FTE. IPA's 2026 practice management data shows revenue per FTE, revenue per partner and leverage all rising in importance as fixed-fee pricing displaces charge-hour billing.
Why do accounting firms track client KPIs better than their own?
Because client reporting is billable and internal reporting is not. Firms assemble dashboards from practice management systems manually, which means the numbers arrive at month-end after the write-down has already happened. The 2026 KPI guidance is explicit that realization should be monitored weekly by partner and service line rather than reviewed monthly, and that WIP past 60 days is an intervention threshold rather than a reporting footnote.
What does good realization and utilization look like in 2026?
Realization of 85-92% for well-managed firms, with best-in-class holding above 88% and anything below 78% signalling a systemic write-down problem from scope creep or pricing misalignment rather than staff performance. Utilization targets differ by role: 80%+ for staff accountants, 55-70% for managers and directors who carry supervision and business development load. Wider professional-services benchmarks put accounting and audit median utilization at 68%, with a top quartile of 78% and best-in-class 84%.
Should marketing sit on the same dashboard as practice metrics?
Yes, and almost nowhere does. Practice dashboards answer whether work is profitable; marketing dashboards answer whether the pipeline is being refilled - and in a business where tax season drives 60%+ of annual acquisition, those questions share a calendar. The minimum joint view is new engagement letters by source, cost per acquired client, pipeline for next season, and NPS by client tenure. ClearlyRated's 2026 survey found NPS falling from 84 at 15+ years to 37 at 6-9 years, which no financial KPI would surface.
Do dashboards actually change decisions?
Only when someone owns them. Enterprise dashboard adoption is about 67%, up from 52% in 2020, and 79% of executives report making decisions from reports - but only about 32% say they trust their data quality, and roughly 14% have automated the reporting itself. A weekly one-page view with an owner beats a comprehensive BI deployment that nobody presents, which is why we scope reporting around a decision cadence rather than a tool.
Sources
AccountingTek BI - accounting firm KPI benchmarks (realization, utilization, WIP, AR)
MyFirm360 - accounting firm KPIs and realization benchmarks
Acculink - 15 CPA firm KPIs to track in 2026
KnowledgeLib - professional services utilization benchmarks 2026
Inside Public Accounting - what firms are measuring if not hours
Jirav - top KPIs every accounting firm should track
AICPA - 2025 National MAP Survey results
ClearlyRated - what accounting clients actually want in 2026
Benchmarketing - accounting marketing benchmarks 2026