



Table of contents

Solar media buyers should analyze native ad data in three layers: whether the impression was measurable, whether spend was paced as planned, and whether the cost per lead clears breakeven in a shrinking residential market. No issuer publishes a solar native benchmark, so this page relies on definitions from the Media Rating Council and the networks, plus SEIA and EnergySage market data.
Key Takeaways
- A viewable display impression needs 50% of pixels in view for at least one continuous second (MRC).
- Taboola daily spend can reach up to 2x the daily cap on a given day.
- US residential solar installed 995 MWdc in Q2 2026, down 12% year over year.
- Q1 2026 residential installs were 1,179 MWdc, up 6% year over year.
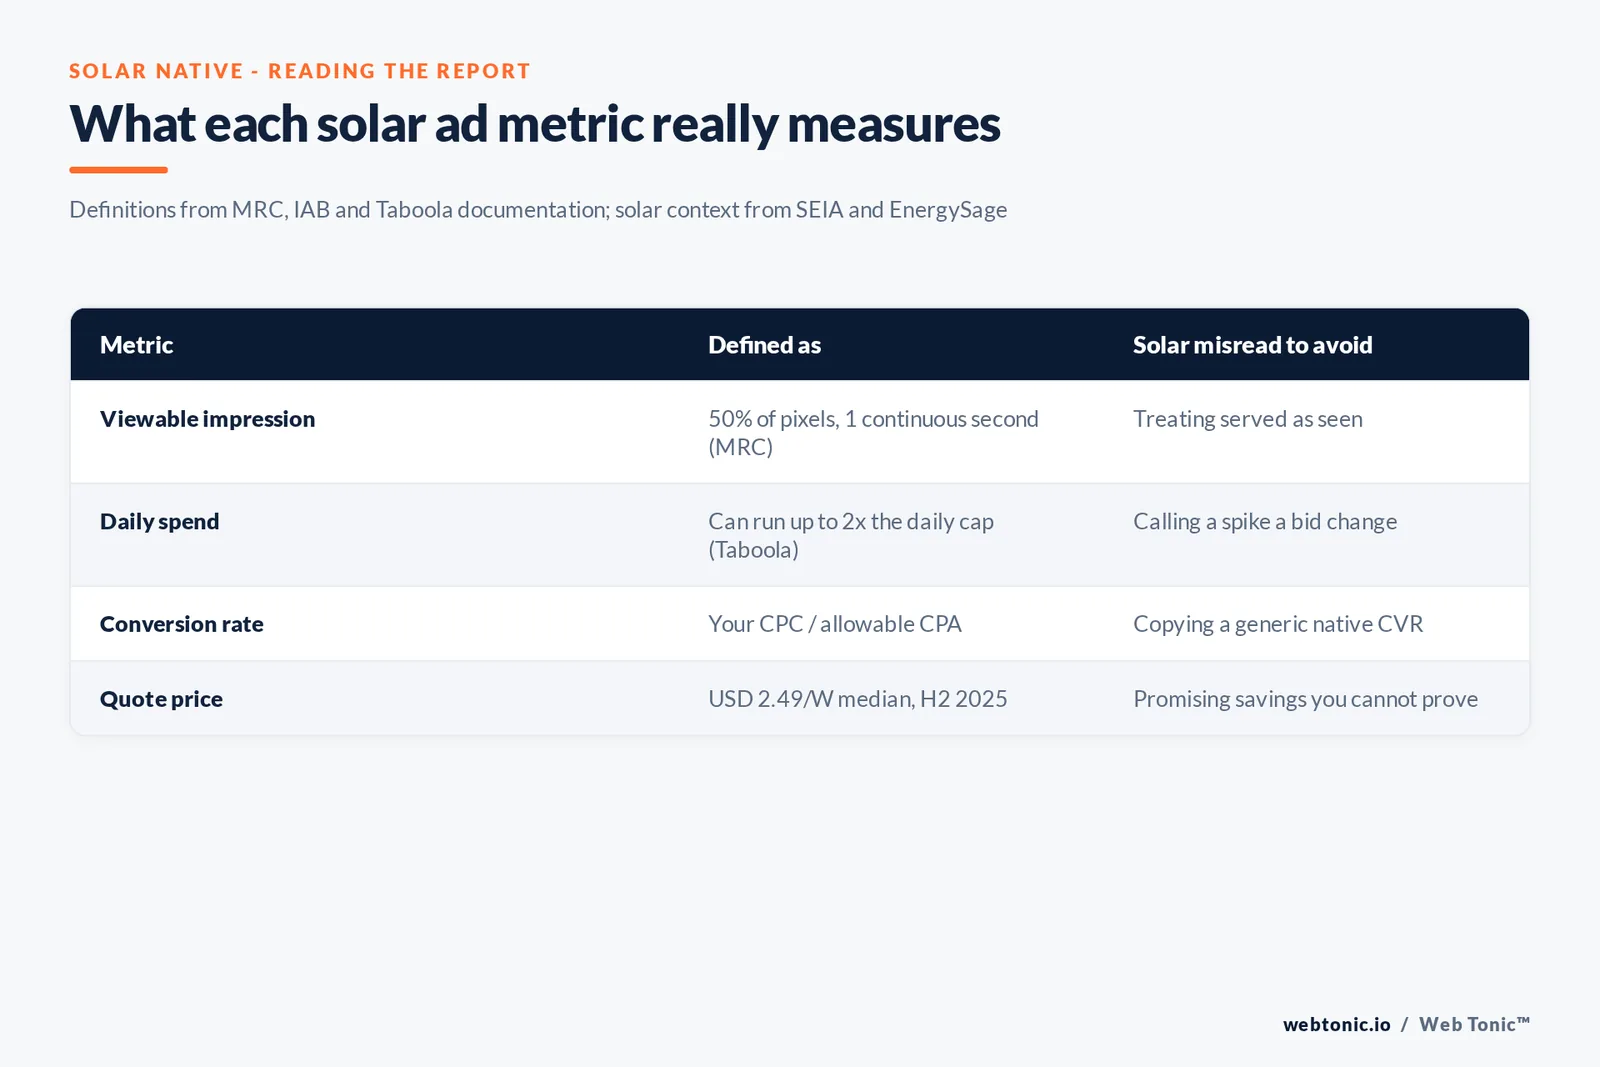
- EnergySage's H2 2025 median quote was USD 2.49 per watt.
- The quoted price spread widened 24% to USD 0.72 per watt, about USD 8,500 per system.
- Battery attachment fell from 41% to 38% in H2 2025.
- No solar native CTR, CPL or conversion rate is published anywhere.
Solar ad performance data: what to check first
Each layer of a native report has a definition you can look up. Check these before comparing any campaign result with another.
| Report layer | Question to ask | Reference definition | Issuer |
|---|---|---|---|
| Impressions | Served or viewable? | 50% of pixels, 1 continuous second | MRC (2015) |
| Format | In-feed, recommendation widget or branded content? | Three native types | IAB Playbook 2.0 (2019) |
| Spend | Daily, monthly or lifetime cap? | Daily cap can reach 2x on a given day | Taboola help (Jul 2026) |
| Conversions | Above or below breakeven? | CPC divided by allowable CPA | OpenAdLibrary (vendor) |
| Market | Did demand move? | Quarterly residential MWdc | SEIA / Wood Mackenzie |
Layer one: was the impression measurable?
The MRC Viewable Ad Impression Measurement Guidelines (version 2.0, August 18, 2015) count a display impression as viewable only when "greater than or equal to 50% of the pixels in the advertisement were on an in-focus browser tab on the viewable space of the browser page" and that held for at least one continuous second after the ad rendered. Mobile and in-app viewability was covered by separate interim guidance, and the document says mobile viewable impressions should be reported apart from desktop.
For a solar buyer, the practical rule is to compare cost per viewable thousand, not cost per served thousand, across placements. Recommendation widgets below long articles often load out of view; a cheap served impression can be an expensive viewable one.
Layer two: which native format produced the result?
The IAB Native Advertising Playbook 2.0 (May 2019) separates in-feed or in-content ads, content recommendation ads delivered "primarily below article", and branded or native content. Solar campaigns often mix all three in one report. Split them before reading results, because a sponsored savings calculator article and a below-article headline unit attract readers at very different stages of a USD 2.49-per-watt decision.
| IAB native type | Typical solar use | What to read in the data |
|---|---|---|
| In-feed / in-content | Short savings or financing story in a news feed | Viewable rate, click-through rate |
| Content recommendation | Headline unit below articles | Bounce rate, cost per engaged visit |
| Branded / native content | Sponsored guide on a publisher site | Time on page, quote-request rate |
Layer three: was spend paced the way you planned?
Taboola's budget and pacing article, updated July 23, 2026, warns that "in some cases your daily cap could be up to double the daily cap set" and that overspend beyond that is not charged. It recommends a daily budget of 10 times the CPA goal or at least USD 50, and its Pace Ahead option adds 20% to each day's share of the remaining budget. A solar report that shows a one-day cost spike is often pacing, not a change in auction price.
Read spend and cost per lead over the whole flight. A weekly view smooths the double-cap days and makes creative or audience changes visible.
Layer four: does the lead cost clear breakeven?
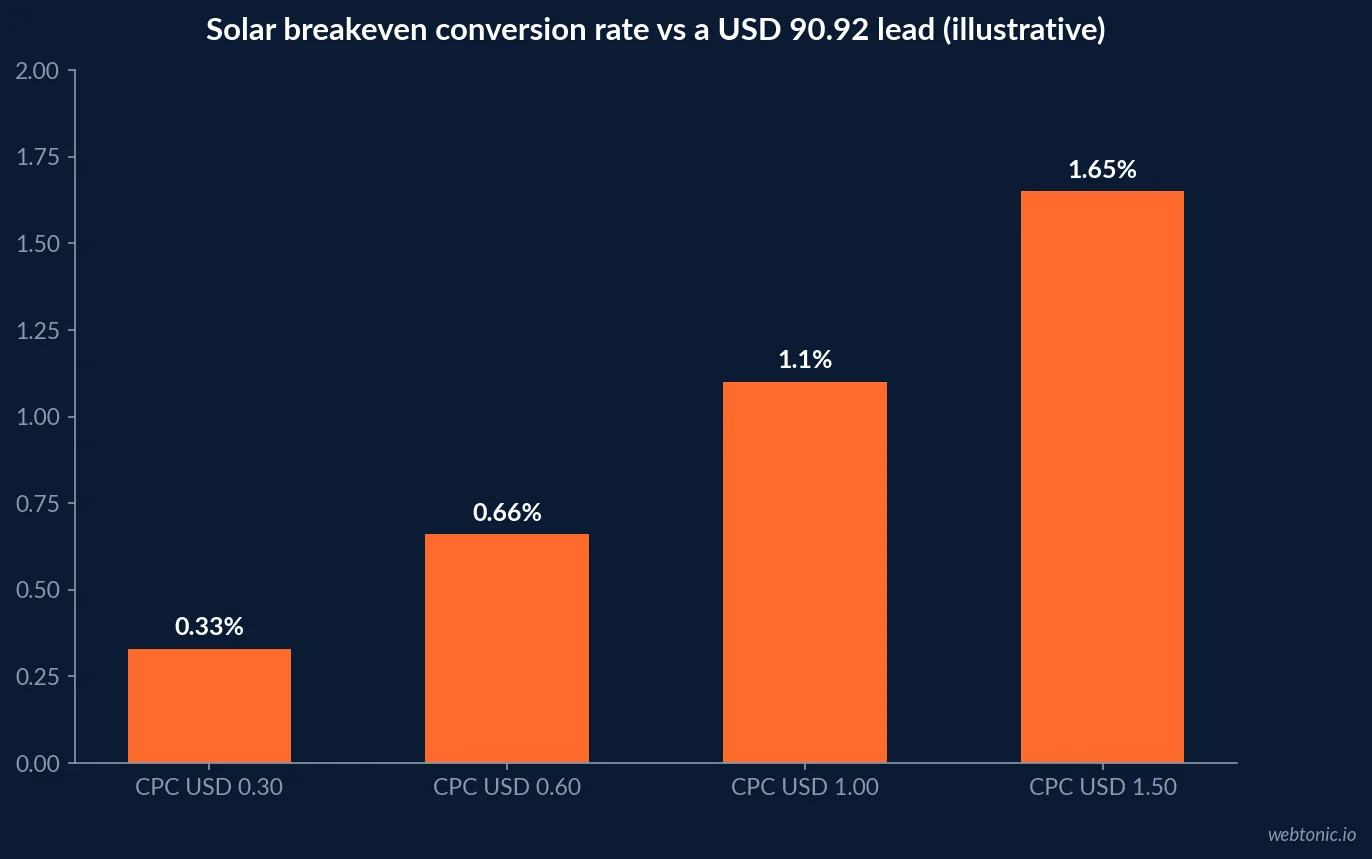
OpenAdLibrary, a native spy-tool vendor, argues that "there is no trustworthy universal conversion rate benchmark for native ads" and that buyers should compute breakeven as cost per click divided by allowable cost per acquisition. Solar has no published native lead cost, so the chart below uses the LocaliQ 2025 home services search median of USD 90.92 per lead as an illustrative allowable cost. At a USD 0.60 click, a solar native landing page must convert at about 0.66% to break even; at USD 1.50, about 1.65%.
| Native CPC (scenario) | Allowable CPL | Breakeven CVR (calc.) | Read it as |
|---|---|---|---|
| USD 0.30 | USD 90.92 | 0.33% | Low bar; check lead quality |
| USD 0.60 | USD 90.92 | 0.66% | Typical test zone |
| USD 1.00 | USD 90.92 | 1.10% | Needs a strong pre-lander |
| USD 1.50 | USD 90.92 | 1.65% | Only with qualified traffic |
The demand context behind every solar report
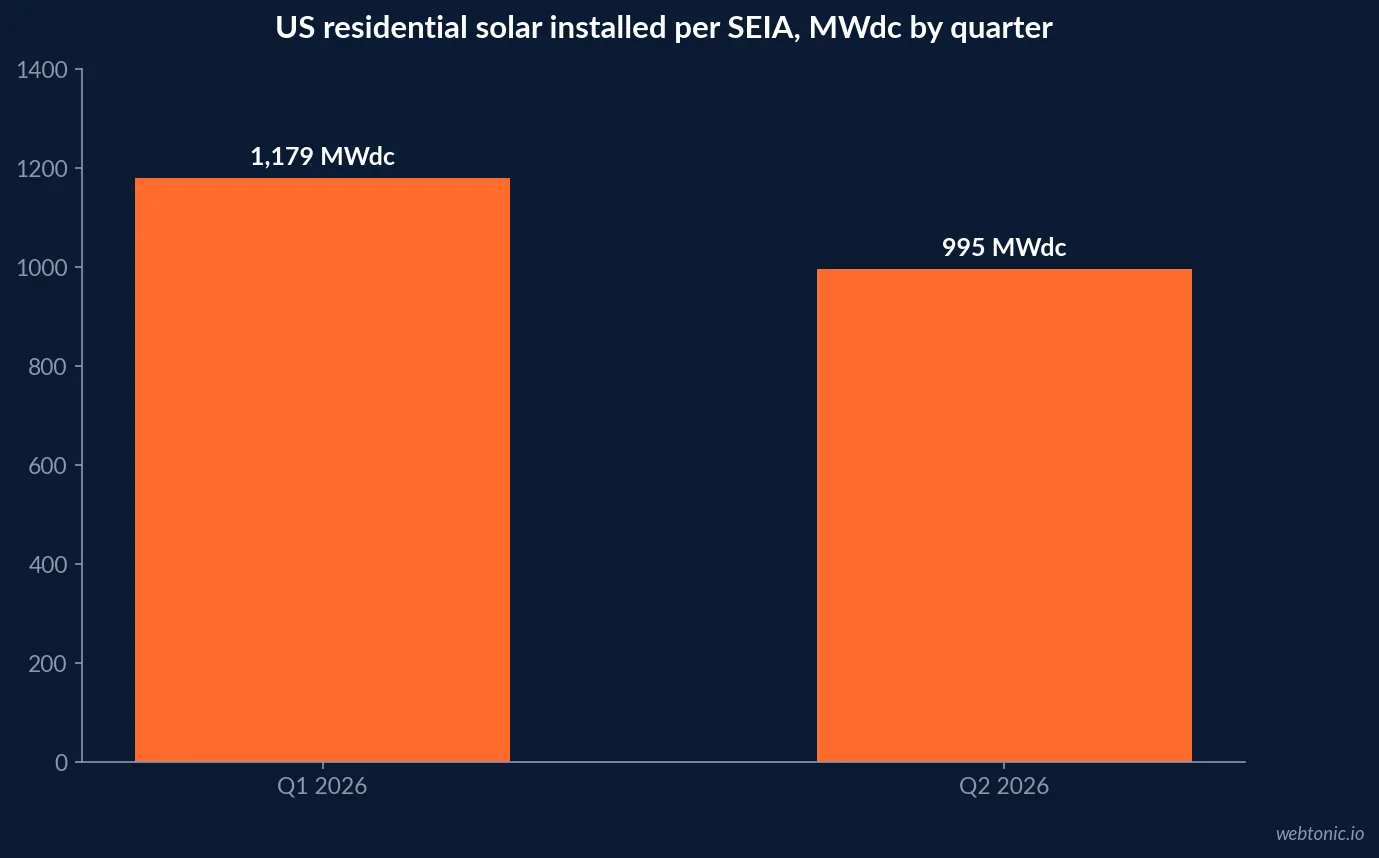
Lead costs move with demand, and residential solar demand dropped in 2026. SEIA and Wood Mackenzie's Q2 2026 Solar Market Insight reported 1,179 MWdc of residential installs in Q1 2026, up 6% year over year and down 15% from Q4 2025, after customer-owned systems had to be installed by the end of 2025 to claim the Section 25D credit. The Q3 2026 report then put Q2 2026 at 995 MWdc, down 12% year over year and 10% quarter over quarter.
A campaign whose cost per lead rose 10% between those quarters may simply be bidding into a smaller pool of ready buyers. Compare your results with the market trend before blaming creative.
| SEIA residential segment | Installed | Year over year | Quarter over quarter |
|---|---|---|---|
| Q1 2026 | 1,179 MWdc | +6% | -15% |
| Q2 2026 | 995 MWdc | -12% | -10% |
Price signals that change conversion rates
EnergySage's H2 2025 marketplace report found the median quoted price rose 0.4% to USD 2.49 per watt, while the spread between the highest and lowest average quotes widened 24%, from USD 0.58 to USD 0.72 per watt, "an $8,500 difference in total cost" for an average system and the largest gap it has recorded. National battery attachment rates fell from 41% to 38%, while interest in storage slipped only from 74% to 73%.
For analysis, that means quote-request rates can fall when shoppers see wide price gaps, and storage upsell rates may lag interest. Segment conversions by offer (panels only versus panels plus battery) before judging a native placement.
| EnergySage H2 2025 signal | Value | How it affects ad data |
|---|---|---|
| Median quoted price | USD 2.49/W (+0.4%) | Stable headline price |
| High-low quote spread | USD 0.72/W (from 0.58, +24%) | More comparison shopping, slower conversions |
| Spread per average system | About USD 8,500 | Higher-intent leads ask more questions |
| Battery attachment rate | 38% (from 41%) | Lower storage upsell in lead value |
| Interest in storage | 73% (from 74%) | Demand deferred, not lost |
Claims that distort the data
Aggressive savings claims can inflate click-through rates and then collapse at the quote stage, which makes a placement look better than it is. The FTC's August 2024 business guidance on solar tells companies to "disclose the total cost for your product or service, be clear about financing options, and don't overpromise cost savings that might come through tax credits, rebates, or incentives." Its September 2024 consumer alert says a promise of free rooftop solar panels at no cost is "likely a scam". The FTC native advertising guide adds that the ad itself must be identifiable as advertising.
Strip "free solar" language from native headlines and the remaining click data becomes far more useful.
Comparing native with Google's feed formats
Many solar buyers run native beside Google Demand Gen. Google's Demand Gen help page describes campaigns across YouTube, Discover, Gmail and the Display Network that can "reach up to 3 billion monthly active users". That is Google's reach claim; it publishes no solar benchmark either. Compare both channels on the same definition: cost per qualified quote request from the same landing page.
A weekly solar native report template
Pull the layers together in one weekly view. The template below carries only metrics you can define with a published rule or compute from your own account, plus the two market series that explain moves you did not cause. Fill the last column from your ad platform and CRM; leave a cell blank rather than borrowing a number from another industry.
Two habits make the template useful. First, keep the definitions fixed for the whole season: if one week counts served impressions and the next counts viewable ones, the trend line is meaningless. Second, add a note every time the market moves. A quarter like Q2 2026, when residential installs fell 12% year over year, will show up as a weaker quote-request rate even if every placement performs exactly as before.
| Weekly metric | Definition | Benchmark to compare with | Your value |
|---|---|---|---|
| Viewable impressions | MRC: 50% of pixels, 1 second | Your own prior weeks | From ad server |
| Cost per viewable thousand | Spend / viewable impressions x 1,000 | Other placements in the flight | Calculated |
| Engaged visits | Visits past the pre-lander | Search traffic to the same page | From analytics |
| Quote requests | Completed quote forms | Breakeven CVR at your CPC | From CRM |
| Cost per quote request | Spend / quote requests | USD 90.92 home services search median (labelled) | Calculated |
| Market index | SEIA residential MWdc | 995 MWdc in Q2 2026 | Quarterly |
A solar native analysis checklist
- Report viewable impressions against the MRC 50% and one-second rule.
- Split results by IAB native type before averaging anything.
- Read pacing weekly; a daily cap can run to 2x.
- Set breakeven from your own allowable cost per lead.
- Index results to SEIA demand, which fell 12% in Q2 2026.
- Segment battery offers, given the 41% to 38% attachment drop.
For cross-industry channel data see our native advertising statistics. Solar organic search data is in our solar enterprise SEO statistics and solar international SEO statistics. Our data intelligence team builds the reporting layer.
Frequently Asked Questions
Is there a native advertising benchmark for solar companies?
No. No network, trade body or benchmark vendor publishes a native click-through rate, cost per lead or conversion rate for solar. Buyers should benchmark against their own allowable cost per lead and, as a labelled comparator, the LocaliQ 2025 home services search median of USD 90.92.
What counts as a viewable native impression?
Under the Media Rating Council's guidelines (version 2.0, August 2015), a display impression is viewable when at least 50% of the ad's pixels are in view on an in-focus browser tab for at least one continuous second after the ad renders. A served impression is not the same thing.
Why did my solar native spend exceed the daily budget?
Taboola's help center says a daily cap can in some cases reach up to double the cap set on a given day, and that you are not charged beyond that. Read spend over the whole flight, not one day.
How should solar ads describe savings and costs?
The FTC told clean energy companies in August 2024 to disclose the total cost, be clear about financing options and not overpromise savings from tax credits, rebates or incentives. Its September 2024 consumer alert says a pitch for free rooftop panels at no cost is likely a scam.
Which solar market numbers matter when reading ad results?
Demand and price. SEIA reports residential installs of 1,179 MWdc in Q1 2026 and 995 MWdc in Q2 2026, and EnergySage reports a USD 2.49 per watt median quoted price in H2 2025, with the high-to-low spread at USD 0.72 per watt. Falling demand can lift cost per lead even when creative is unchanged.
Sources
Media Rating Council, Viewable Ad Impression Measurement Guidelines v2.0 (2015)
IAB, Native Advertising Playbook 2.0 (2019)
Taboola Realize Help Center, Setting Your Budget and Pacing (Jul 2026)
OpenAdLibrary, Native Ads Conversion Rate Benchmarks
SEIA / Wood Mackenzie, Solar Market Insight Q2 2026
SEIA / Wood Mackenzie, Solar Market Insight Q3 2026
EnergySage, Home Energy Market H2 2025 Highlights
LocaliQ, Home Services Search Advertising Benchmarks 2025
FTC, Don't waste your energy on a solar scam (2024)
FTC Consumer Advice, solar scams alert (2024)
FTC, Native Advertising: A Guide for Businesses
Google Ads Help, Demand Gen campaigns


