Table of contents
LinkedIn is the most expensive lead-generation channel available to a solar company and, for the right segment, the cheapest. The dividing line is project size: a $25,000 residential system cannot carry a $60 to $150 cost per lead, while a commercial rooftop starting at $200,000 barely notices it. Here are the 2026 numbers.
Key Takeaways
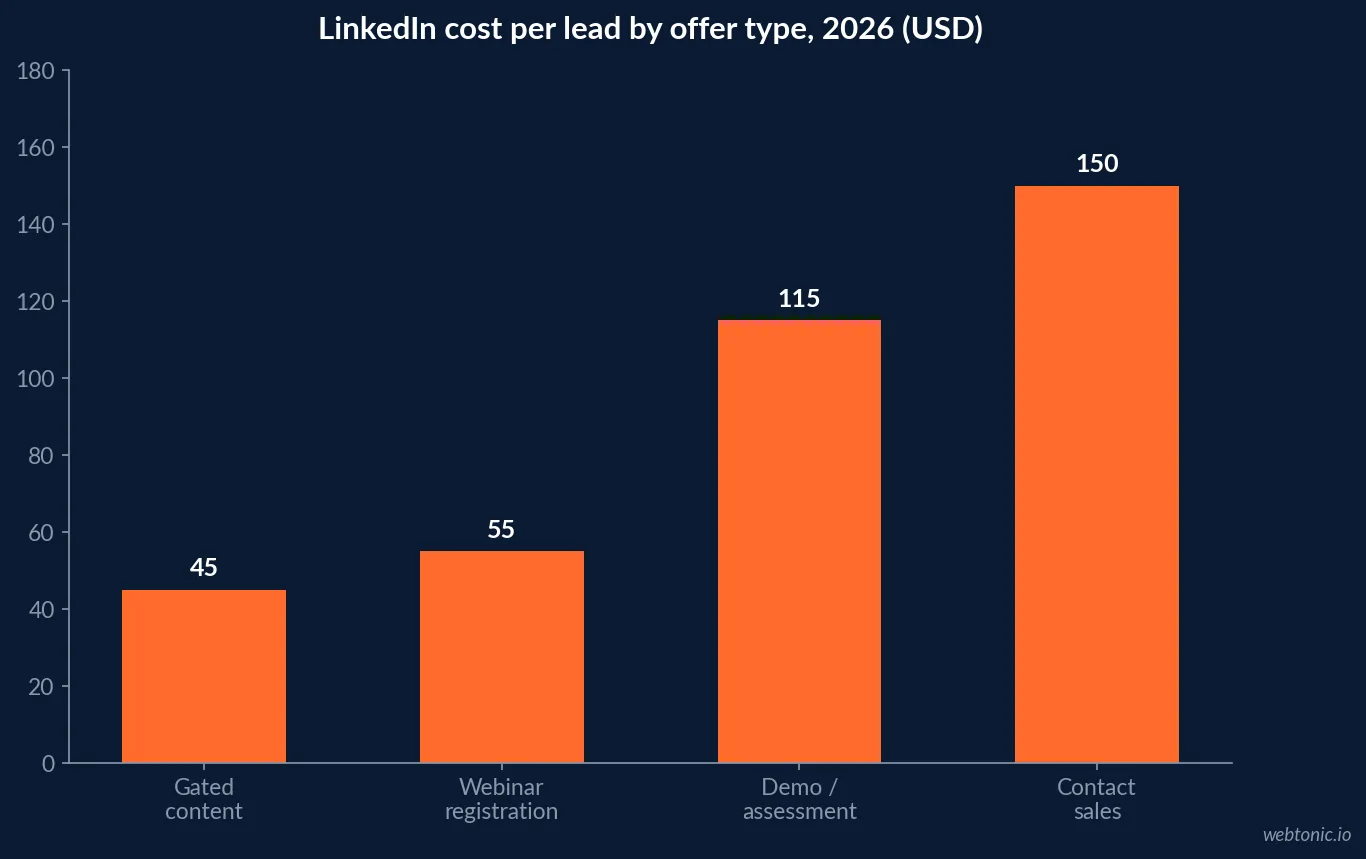
- LinkedIn cost per lead by offer type: $45 gated content, $55 webinar, $115 demo request, $150 contact sales.
- B2B solar benchmarks put LinkedIn CPL at EUR 60-120 against EUR 40-80 for Google search and EUR 15-40 for SEO.
- LinkedIn CPC by vertical runs $4.10 to $15.20, with industrial and manufacturing targeting near $5.75.
- Median Sponsored Content CTR: 0.62% document ads, 0.55% carousel, 0.50% single image, 0.44% video.
- Lead Gen Forms convert at 10% to 18% (median 13%) versus 2% to 6% for landing pages, cutting CPL 25% to 40%.
- In-platform form completion reaches 10% to 15% against 3% to 5% on an external landing page.
- Message Ads open at 35% to 55% (median 42%) with a 4.2% median CTA click rate.
- LinkedIn now takes about 41% of total B2B ad budgets and reports 121% ROAS, up from 113% in 2024.
- Commercial solar projects start near $200,000 and run past $5 million, with typical deals of $200K to $2M.
- Lead-to-deal conversion in B2B solar is 5% to 10%, and deals close on a 6 to 18 month cycle.
- On a EUR 200,000 project at 15% installer margin, an EUR 80 lead at 7% conversion implies EUR 1,140 acquisition cost against EUR 30,000 gross margin.
- Commercial solar search clicks cost $15 to $50, with CAC of $1,000 to $3,000+ on competitive terms.
- Average B2B solar CAC is around $0.43 per watt - about $2,580 on a 6 kW system.
- Top-performing commercial campaigns book 6 to 12 meetings per month.
- US commercial solar grew 6% in 2025 while residential is forecast to contract about 21% in 2026 after the Section 25D sunset.
- Personalised LinkedIn connection requests reply at about 9.36%, but cost per qualified conversation runs $200 to $400 versus $50 to $150 for cold email.
Why the segment split decides everything
The 2026 market did solar marketers one favour: it made the channel decision obvious. Residential is forecast to contract about 21% after the Section 25D credit lapsed at the end of 2025, while commercial installations grew 6% year over year as legacy net-metering pipelines came online, per Wood Mackenzie's 2026 outlook and the SEIA year-in-review data.
| Segment | Typical deal value | Allowable cost per lead | Is LinkedIn viable? |
|---|---|---|---|
| Residential rooftop | $25,000-$35,000 | $50-$100 from paid | No - use search, social and referral |
| Small commercial (under 100 kW) | $100,000-$250,000 | $150-$400 | Yes, with tight ICP filters |
| Mid commercial (100-500 kW) | $250,000-$1M | $400-$1,200 | Strong fit |
| Large C&I / portfolio | $1M-$5M+ | Four figures | Best fit; account-based targeting |
| Community solar subscriber | Subscription | $69 per kW acquisition | No - consumer channels win |
The allowable column is the discipline most solar teams skip. It comes from margin, not from what the platform charges: at a 15% installer margin on a EUR 200,000 project, gross margin is about EUR 30,000, so an EUR 80 lead converting at 7% produces a EUR 1,140 acquisition cost - under 4% of margin, as laid out in this commercial solar lead generation analysis.
LinkedIn cost benchmarks for 2026
Platform costs have stabilised while budgets have concentrated: LinkedIn now absorbs roughly 41% of B2B ad budgets and reports 121% ROAS. The cost table below draws on CPC and CPL benchmarks by industry, Dreamdata's 2026 LinkedIn Ads benchmarks and 2026 LinkedIn advertising cost data.
| Metric | 2026 benchmark | Solar-relevant reading |
|---|---|---|
| CPC range by vertical | $4.10-$15.20 | Industrial and construction targeting near $5.75 |
| CPL, gated content | About $45 | Cheapest entry point; savings case studies |
| CPL, webinar registration | About $55 | Works for utility-rate and incentive briefings |
| CPL, demo or assessment request | About $115 | Closest to a site-assessment offer |
| CPL, contact sales | About $150 | Only defensible above $250,000 project value |
| Lead Gen Form conversion | 10-18%, median 13% | Use for content, not for site assessments |
| Landing page conversion | 2-6% | Slower but better-qualified on complex bids |
| Message Ads open rate | 35-55%, median 42% | Reserve for named-account lists |
| Share of B2B budgets | About 41% | Auction pressure is not going down |
One caveat worth pricing in: LinkedIn organic outreach is not a cheaper substitute. Personalised connection requests reply at about 9.36%, but the time cost pushes cost per qualified conversation to $200 to $400 against $50 to $150 for well-run cold email, per B2B solar channel ROI analysis. Paid LinkedIn buys reach; it does not buy patience.
Format performance and what to put in the ad
The CTR spread across Sponsored Content formats is narrow in absolute terms and large in relative terms. Document ads at 0.62% outperform video at 0.44% by roughly 40%, which for solar aligns neatly with how commercial buyers actually evaluate: they want the numbers as a document, not a brand film.
| Format | Median CTR | Best solar use case | Watch-out |
|---|---|---|---|
| Document ad | 0.62% | Savings case study on a named building type | Needs real figures, not a brochure |
| Carousel | 0.55% | Before/after and payback breakdown by panel | Do not exceed five cards |
| Single image | 0.50% | Retargeting an assessment offer | Fatigues fastest |
| Video | 0.44% | Site walkthrough for credibility | Costs more per completed view |
| Message Ads | 4.2% CTA click | Named accounts, post-event follow-up | Volume limits and higher cost |
The content itself matters more than the format. Solar-specific engagement data shows savings-oriented content ("how a 300 kWp rooftop saves EUR 45,000 a year") reaching 2% to 4% engagement, well above platform averages, while product-specification creative underperforms. Our performance creative team builds these asset sets, and the cross-channel cost comparison sits in our Google Ads pricing guide.

Targeting a commercial solar ICP that is actually buyable
The most common waste in solar LinkedIn campaigns is geographic targeting standing in for qualification. "Businesses in sunny states" is not an ICP; utility rate, roof size and ownership status are. The filters below come from operators running commercial solar outbound and paid programmes.
| Filter | Threshold that matters | Why |
|---|---|---|
| Commercial utility rate | Above $0.12 per kWh | Below this the payback case rarely clears committees |
| Building footprint | 50,000+ sq ft roof area | Determines whether the project reaches viable size |
| Ownership | Owner-occupied or long lease | Tenants cannot authorise a 25-year asset |
| Job titles | Facilities, operations, CFO, sustainability | Four-person committee is typical |
| Company size | 100+ employees or multi-site | Correlates with capex authority |
| Trigger events | New facility, rate hike, ESG mandate | Lifts reply rates from 0.8% to 3.5% on identical copy |
Installations above 9 kWp already account for 75% of installed capacity in some national markets despite far fewer projects than residential - the concentration argument for targeting commercial at all. And a human who can answer "what is the payback?" on the first reply lifts meeting-set rates from 12% to 28% on positive-reply pools, per B2B solar lead generation data.
Measuring a channel with a six-to-eighteen-month cycle
The fastest way to kill a working commercial solar programme is to judge it on same-month CPA. Commercial solar sales-cycle analysis puts typical deals at six months and up, with procurement committees, RFP responses and board approvals in between.
| Period | What to judge | Benchmark | What not to judge |
|---|---|---|---|
| Month 1-3 | Qualified conversations and meetings booked | 6-12 meetings/month at scale | Closed revenue |
| Month 4-6 | Pipeline value and proposal volume | $400K-$1.2M pipeline building | Cost per acquisition |
| Month 7-12 | Closed deals and blended CAC | Lead-to-deal 5-10% | Single-campaign attribution |
| Month 12+ | Cost per closed project vs gross margin | Under 5% of project margin | Platform-reported ROAS alone |
Reported compounding is real but slow: outbound and paid programmes in solar show reply and meeting rates improving through month 12 as targeting tightens, with pipeline growing several times over from month one on flat spend. Building that measurement layer is what our data intelligence team does before we recommend scaling any LinkedIn budget.
Best practices for solar LinkedIn Ads in 2026
- Run LinkedIn only against commercial and industrial pipelines; keep residential on search and social.
- Set the allowable cost per lead from project margin, not from platform averages.
- Lead with a savings document, not a company overview - document ads carry the highest CTR at 0.62%.
- Use Lead Gen Forms for content offers (13% median conversion) and landing pages for site assessments.
- Filter on utility rate and roof size before geography.
- Cap frequency and rotate creative monthly; single-image formats fatigue fastest.
- Staff replies with someone who can answer payback and financing questions the same day.
- Retarget site visitors and document openers rather than broadening the audience.
- Track meetings booked as the primary KPI for the first two quarters.
- Feed closed-won data back into the platform so optimisation targets deals, not form fills.
- Reserve Message Ads for named accounts and post-event follow-up, given $200-$400 per qualified conversation on manual outreach.
A first 90-day LinkedIn plan for a commercial solar team
Budget assumption: $4,000 to $8,000 per month, which is realistic for an installer targeting $200K to $2M projects and consistent with the 5% to 12% of revenue commercial solar companies allocate to marketing.
| Window | Work | Target output |
|---|---|---|
| Days 1-14 | Build ICP list on rate, roof size and ownership; write the savings document | 500-2,000 qualified accounts |
| Days 15-30 | Launch document-ad campaign plus Lead Gen Form; conversion tracking live | First 20-40 leads at $45-$115 |
| Days 31-60 | Add retargeting for openers and site visitors; test carousel payback creative | 3-6 meetings booked |
| Days 61-90 | Layer Message Ads on named accounts; hand pipeline reporting to the CRM | 6-12 meetings/month cadence |
| Quarter 2 | Cut the bottom third of audiences; scale winners 20% at a time | Pipeline above $1M |
Run by our growth marketing team or in-house, the sequence is the same: prove qualified conversations first, then buy more of them. Get in touch if you want the commercial-solar version costed against your project margins.
Frequently Asked Questions
Do LinkedIn Ads work for solar companies?
For commercial and industrial solar, yes. For residential rooftop, rarely. LinkedIn cost per lead runs about $45 for gated content up to $150 for a contact-sales offer, and B2B solar campaign benchmarks put LinkedIn CPL in the EUR 60 to 120 band - impossible to justify against a $25,000 residential system, straightforward against a commercial project that starts near $200,000 and can exceed $5 million.
What is a good cost per lead for commercial solar on LinkedIn?
Benchmarks land between roughly $60 and $150 depending on offer type, versus EUR 40 to 80 for Google Ads search and EUR 15 to 40 for SEO and content. LinkedIn is the most expensive of the inbound channels per lead and usually the best on decision-maker fit. With lead-to-deal conversion at 5% to 10% in B2B solar, an $80 lead implies roughly $800 to $1,600 of acquisition cost per closed project - comfortable against $30,000 of gross margin on a $200,000 installation.
Which LinkedIn ad format performs best for solar?
Document ads and carousels lead on click-through - median Sponsored Content CTR is 0.62% for document ads, 0.55% carousel, 0.50% single image and 0.44% video. For solar specifically, a savings-case document ('how a 300 kWp rooftop saves EUR 45,000 a year') performs well because it matches how facility and finance teams evaluate projects, with engagement on that content type reaching 2% to 4%.
Should solar companies use LinkedIn Lead Gen Forms?
For top-of-funnel offers, yes: Lead Gen Forms convert at 10% to 18% with a median near 13%, against 2% to 6% for landing pages, and cut cost per lead by roughly 25% to 40%. Completion rates on in-platform forms reach 10% to 15% versus 3% to 5% on an external page. For complex commercial bids, landing-page leads still qualify better, so run forms for content and pages for site-assessment requests.
How long is the commercial solar sales cycle from a LinkedIn lead?
Plan for six to eighteen months. Trade-show and outbound benchmarks in B2B solar report deals closing on a 6 to 18 month cycle, top-performing campaigns booking 6 to 12 commercial meetings per month, and average deal sizes of $200,000 to $2 million. That means LinkedIn should be measured on qualified conversations and meetings booked in quarter one, and on pipeline value from quarter two onward - never on same-month cost per acquisition.
Sources
Ryze - LinkedIn Ads CPC and CPL Benchmarks by Industry 2026
Dreamdata - LinkedIn Ads Benchmarks Report 2026
Metadata - LinkedIn Ads Benchmarks 2026
Ad Library - LinkedIn Advertising Costs 2026
Leadfeeder - LinkedIn Statistics
ioQuery - Commercial Solar Lead Generation Benchmarks
LeadHaste - B2B Lead Generation for Solar
SurgePV - Commercial Solar Sales Cycle
DanishLeadCo - Best ROI Marketing Channels for B2B Solar
Wood Mackenzie - Why 2026 Is Looking Flat
pv magazine USA - US Solar Adds 43 GW in 2025