



Table of contents
Key Takeaways
- Energy and utilities emails average a 34.34% open rate — nearly 10 points above the cross-industry mean of roughly 24%, making the vertical one of the strongest for inbox engagement (Designmodo).
- Click-through rates for the energy sector sit at 4.78%, with a 12.85% click-to-open ratio, outperforming most B2C verticals (Designmodo).
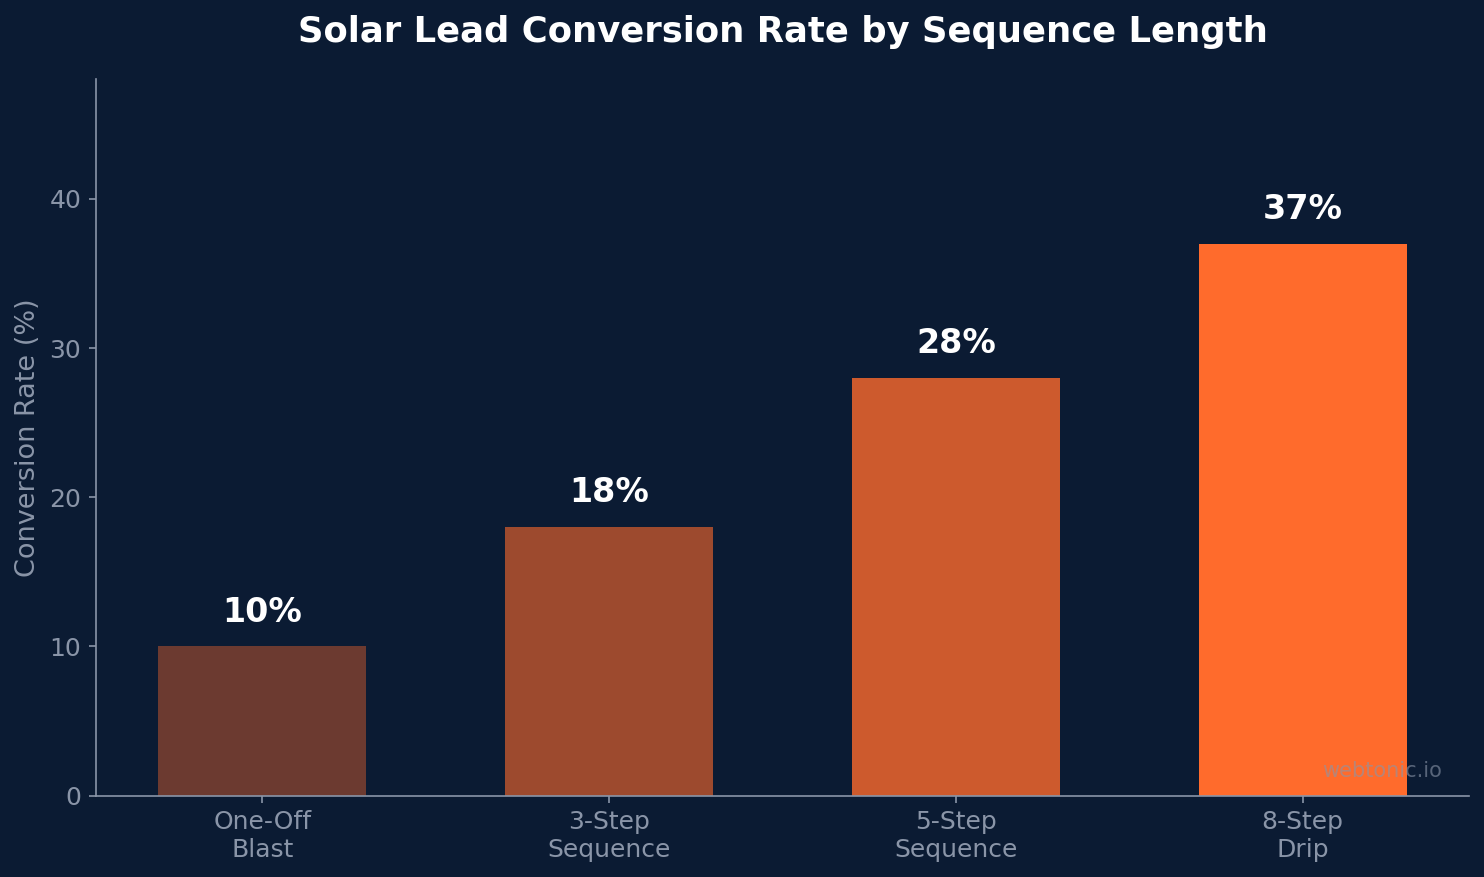
- Solar drip campaigns convert 30–45% of prospects versus just 8–12% from one-off blasts, a 3.6× improvement documented in a controlled Phoenix installer study (SurgePV).
- Buyers in this space typically require 10–15 marketing touches spread across a 90–180 day consideration window before signing a contract (SurgePV).
- Residential customer acquisition costs jumped 40% in early 2026 to roughly $0.84 per watt, making low-cost nurture channels like automated sequences more critical than ever (PipelineOn).
- Email delivers an average return of $36–$42 for every $1 invested, the highest ROI of any digital channel and a lifeline for operators facing rising acquisition costs (Litmus).
- Subject-line optimization alone drives 25–40% open-rate gains over 12 months of consistent A/B testing (SurgePV).
Solar Email Performance Benchmarks at a Glance
| Metric | Energy / Utilities Benchmark | Cross-Industry Average |
|---|---|---|
| Open rate | 34.34% | ~24% |
| Click-through rate (CTR) | 4.78% | ~2.6% |
| Click-to-open rate (CTOR) | 12.85% | ~10.5% |
| Unsubscribe rate | 0.38% | ~0.26% |
| Bounce rate | 3.60% | ~2.7% |
| Average ROI (per $1 spent) | $36–$42 | $36 |
| Drip-campaign conversion | 30–45% | 8–12% (single send) |
The figures above are drawn from aggregated 2025–2026 reporting by Designmodo, Litmus, and SurgePV. The clean-energy vertical consistently outperforms cross-industry norms because subscribers actively seek policy updates, incentive changes, and savings calculations — content that naturally aligns with high engagement.
Why Automated Sequences Outperform One-Off Blasts
A Phoenix-based installer ran a controlled comparison in 2024 across two nearly identical lead cohorts. Cohort A (4,800 prospects) received a single follow-up message plus phone outreach and closed at 9.2%. Cohort B (4,650 prospects) received the same phone outreach but also entered an 8-step automated drip sequence — their close rate reached 33.4%, a 3.6× increase (SurgePV).
Why such a dramatic gap? Buyers considering panel installation need repeated reinforcement. Research consistently shows 6–8 marketing touches before a purchase decision in most verticals, but in the clean-energy space that figure stretches to 10–15 touches over 90–180 days. Automated sequences deliver those touches without burdening sales teams, and they do so at virtually zero marginal cost per contact.
The recommended cadence is every 3–5 days during the first two weeks, tapering to weekly after that. Each message in the flow should serve a specific role: immediate inquiry response, educational content, a personalized estimate, common objection handling, a customer success story, incentive explanation, ROI walkthrough, and a final re-engagement nudge. Installers using disciplined sequences consistently deliver 12–20 total touches before a prospect either converts or disqualifies.
Open-Rate and Click-Rate Trends by Segment
| Segment / List Type | Avg. Open Rate | Avg. Click Rate | Best Practice |
|---|---|---|---|
| Post-inquiry nurture | 38–45% | 5–8% | Personalize with location + roof data |
| Newsletter (existing leads) | 28–35% | 3–5% | Policy updates + seasonal tips |
| Re-engagement (dormant) | 18–24% | 2–3% | Subject-line A/B test + new incentive hook |
| Post-install customer | 42–50% | 6–9% | Maintenance reminders + referral programs |
| Commercial / B2B outreach | 22–30% | 2–4% | Case studies + ROI calculators |
Post-install customer lists show the highest engagement because recipients already trust the installer and actively monitor system performance. Smart operators leverage this relationship: referral-program sequences sent to satisfied customers produce some of the lowest-cost qualified prospects in the entire funnel. Segment by installation date, system size, and whether the homeowner added storage to keep messaging relevant (Marketing LTB).
Drip Campaign Structure That Converts
The most effective automated flows for panel installers follow a proven 8-step framework spread across 30–90 days (SurgePV):
- Immediate inquiry response — Acknowledge within minutes; confirm the prospect's data and set expectations.
- Educational primer (day 2) — Explain how installations work, typical timelines, and local permitting basics.
- Personalized estimate (day 5) — Leverage roof-assessment data, utility rate, and system size.
- Common questions (day 7) — Address concerns about maintenance, warranties, and grid-tie vs. off-grid.
- Customer success story (day 10) — Include real savings figures from a nearby homeowner.
- Incentive breakdown (day 14) — Detail available rebates, state credits, and financing options.
- ROI walkthrough (day 21) — Calculator-style payback analysis tailored to the prospect's monthly bill.
- Final re-engagement (day 30+) — Counter the most common objection and offer a limited-time consultation.
Operators who follow this framework and track stage-level metrics consistently close at rates three to four times higher than those relying on phone-only outreach. The key metric to watch is delivery rate (target: 98%+), followed by opens (22–40%), clicks (2–8%), and spam complaints (under 0.1%).
Subject-Line Optimization and Deliverability
Subject lines determine 40–60% of whether a message gets opened. Installers who run disciplined A/B tests — varying length, personalization tokens, urgency language, and emoji use — typically improve open rates by 25–40% over 12 months (SurgePV).
Deliverability infrastructure is equally critical. Authentication protocols — SPF, DKIM, and DMARC — must be properly configured to pass inbox filters at providers like Gmail and Yahoo. Without these, bounce rates climb above the 3.60% sector average, and spam complaint rates can cross the 0.10% threshold that triggers domain reputation penalties. An unsubscribe rate above 0.50% signals either poor list hygiene or irrelevant messaging (Designmodo).
Best practices for list management include:
- Scrub inactive contacts every 90 days — recipients who haven't opened in three months dilute engagement scores.
- Use double opt-in for newsletter signups to maintain list quality above 95% deliverability.
- Segment by lead source (paid vs. organic vs. referral) because open-rate benchmarks differ by as much as 15 points across acquisition channels.
- Monitor Google Postmaster Tools and Microsoft SNDS for domain reputation shifts.

Cost Comparison: Automated Sequences vs. Other Channels
| Channel | Avg. CPL (2026) | Avg. CAC | Speed to First Touch |
|---|---|---|---|
| Automated sequences | $5–$15 (nurture cost) | Incremental | Instant (triggered) |
| Google Ads (search) | $150–$400 | $600–$1,200 | Seconds (ad click) |
| Meta / Facebook Ads | $30–$100 | $700–$1,100 | Seconds (ad click) |
| Shared lead marketplace | ~$110 | $900–$1,500 | Minutes (lead distribution) |
| Organic / SEO | ~$196 (blended) | $400–$800 | Self-serve (site visit) |
While automated outreach carries a near-zero marginal cost per contact, it is not a standalone acquisition channel — it amplifies every other source. Prospects who enter through paid search or social campaigns and then receive a well-timed nurture sequence are far more likely to convert. BaaDigi's 2026 benchmarks peg the blended cost per prospect across all channels at roughly $206, while operators who layer automated follow-up on top consistently report acquisition costs 20–35% below that blended average (BaaDigi).
Cold Outreach Performance for B2B Installers
Commercial and utility-scale contractors operate in a different arena from residential operators. Cold outreach to facility managers, property developers, and municipal procurement teams follows distinct benchmarks:
- Average open rate for cold B2B sequences: 22–30% when the sender domain has a clean reputation and sends under 100 per day.
- Reply rates: 3–7% on well-targeted lists with personalized subject lines referencing the prospect's building size, utility spend, or state incentive eligibility.
- Ideal Customer Profile (ICP) segmentation — target companies with monthly utility bills above $5,000, buildings with flat roofs exceeding 10,000 sq ft, and organizations with published sustainability goals.
- SPF, DKIM, and DMARC configuration is non-negotiable for cold senders — without all three, inbox placement drops below 60%.
Successful B2B operators build prospect files from Google Maps data, commercial property records, and industry directories. Sequences of 4–6 touches over 14–21 days perform best, mixing case studies, ROI projections, and a direct calendar booking link. Martal Group and similar agencies report that solar-specific cold sequences outperform generic outreach by 2–3× when the messaging references local incentive programs and recent utility rate hikes (CUFinder).
Market-Level Data: Performance Across U.S. States
Campaign performance varies dramatically by market. States with aggressive renewable incentives — California, Texas, Florida, New York, and Arizona — see higher engagement numbers because prospects actively research installation financing, local rebates, and equipment specifications before requesting a quote. A company operating in sun-belt states will typically observe open rates 5–10 points above the national 34.34% benchmark due to that heightened buyer intent (WiFi Talents).
The underlying numbers tell a clear story: the U.S. residential solar market grew to ~6 GW of annual installations, with the average system size sitting at 8–10 kW and the average job value near $30,505. These big-ticket transactions justify longer, more data-rich nurture sequences. A full breakdown of system pricing, financing options (loans, leases, PPAs), and available tax credits should form the backbone of every automated flow. Companies that include localized incentive reports — referencing state-level programs and utility-specific rebates — see 20–30% higher click-through on those messages versus generic templates (BaaDigi).
Building a High-Quality Contact File
The quality of your contact file determines the ceiling on every metric downstream. Businesses that invest in list hygiene — removing invalid addresses, suppressing previous unsubscribers, and enriching records with property and utility data — consistently outperform those sending to bloated, unvalidated lists. Key file-building best practices for solar companies include:
- Source diversification: Pull contacts from web form fills, marketplace leads (EnergySage, Service Direct), Google Maps scraping (for B2B), and referral programs. Each source enters a separate segment with its own welcome sequence.
- Data enrichment: Append roof age, monthly electricity bill, homeownership status, and local utility provider. These data points enable the hyper-personalized messaging that drives a full 15–25% open-rate premium.
- Progressive profiling: Use early-stage messages to collect missing data — ask about current utility company, roof orientation, and interest in storage or panels-only installation. Each reply enriches the prospect record.
- Compliance: Every outreach file must comply with CAN-SPAM (for the United States market) and CASL (for Canadian businesses). Include a one-click unsubscribe, valid physical address, and accurate sender information.
Well-maintained contact files produce bounce rates below 1.5% — significantly better than the 3.60% sector average — and keep sender reputation scores high enough to maintain inbox placement above 95% across Gmail, Yahoo, and Microsoft providers.
Equipment and Installation Content That Drives Engagement
The highest-performing messages in solar nurture sequences are those that educate prospects about equipment specifics and the full installation process. Homeowners considering a $25,000–$40,000 purchase want detailed information on panel technology (monocrystalline vs. polycrystalline), inverter types (string vs. micro), storage battery options, and racking systems. Companies that dedicate at least two messages in their drip sequence to equipment comparison content report 35–50% higher time-on-page when linking from the message to detailed landing pages (SurgePV).
The installation timeline — from initial site survey through permitting, equipment delivery, and final grid interconnection — is another high-engagement content pillar. A company that breaks this process into a visual timeline and sends it as an early-stage nurture message often sees that single touchpoint drive 8–12% click rates, well above the sector average. Including real numbers — average time to install (1–3 days for residential), permit wait times by state, and financing approval timelines — builds confidence and reduces the sales cycle by helping prospects set accurate expectations.
Best Practices for Installers
- Segment from day one. Separate residential from commercial, new prospects from post-install customers, and paid-source contacts from organic. Each group needs different messaging cadence and content focus.
- Automate the first 8 touches. Manual follow-up cannot match the consistency of triggered sequences. Invest in a CRM-connected platform that fires messages based on lead stage transitions.
- Personalize with data. Reference the prospect's city, estimated monthly utility bill, roof orientation, and available state incentives. Personalized messages consistently outperform generic templates by 15–25% in open rate.
- A/B test every element. Rotate subject lines, sender names, CTA buttons, and send times. Commit to at least two tests per month and track results over a rolling 90-day window.
- Monitor deliverability weekly. Check SPF/DKIM alignment, bounce rates, and spam-complaint ratios. A spike above 0.10% complaints requires immediate list pruning.
- Leverage referral sequences. Post-install customers are your highest-engagement segment — use referral-incentive campaigns to generate warm prospects at near-zero cost.
- Re-engage dormant contacts quarterly. A dedicated re-activation series (3–4 messages with a fresh incentive) can recover 8–15% of otherwise lost prospects.
Industry Comparison: Solar vs. Other Home-Services Verticals
| Industry | Avg. Open Rate | Avg. CTR | Avg. ROI per $1 |
|---|---|---|---|
| Solar / Clean Energy | 34.34% | 4.78% | $36–$42 |
| HVAC | 28.5% | 3.1% | $32–$38 |
| Roofing | 27.8% | 2.9% | $30–$36 |
| Plumbing | 26.4% | 2.7% | $28–$34 |
| General Home Services | 25.2% | 2.5% | $25–$32 |
The clean-energy vertical's outperformance is not accidental. Subscribers in this space are actively monitoring policy changes, utility rate adjustments, and technology advances — content that creates natural engagement hooks unavailable in more commodity-driven home-service categories. That structural advantage translates into higher open rates, stronger click-through, and ultimately better return on every dollar allocated to this channel (SearchLab).
Measuring and Reporting Campaign Performance
Solar companies that treat their outreach data as a strategic asset consistently outperform those flying blind. Every company should build a monthly performance report tracking these key numbers at both the campaign and the sequence level:
| Metric | Target Benchmark | Diagnostic Action |
|---|---|---|
| Delivery rate | 98%+ | If below 96%, scrub file and verify authentication records |
| Open rate (nurture) | 34–45% | A/B test subject lines; check send time by time zone |
| Click rate | 4–8% | If below 3%, revise CTA placement and landing page alignment |
| Reply rate (cold) | 3–7% | Personalize by state-level incentives and utility company |
| Unsubscribe rate | < 0.5% | Reduce send frequency; improve targeting and list quality |
| Lead-to-appointment rate | 20–30% | If below 15%, add qualification questions and sales follow-up SLA |
The most effective solar businesses build dashboards that connect campaign-level data to real sales outcomes. A single report should map the full funnel: emails sent → opens → clicks → leads generated → appointments booked → installations closed. This end-to-end view reveals where prospects drop off and which sequences, subject lines, and content types contribute most to revenue. Companies running this level of measurement typically identify 15–25% budget savings within the first quarter by reallocating send volume away from underperforming segments and into high-converting flows (CUFinder).
For businesses managing large contact files across multiple states, automation platforms like HubSpot, ActiveCampaign, and Mailchimp provide the segmentation and reporting infrastructure needed to scale. A mid-size solar company processing 500–2,000 leads per month should expect to allocate $200–$800/month on platform fees — a fraction of the cost of a single Google Ads lead and a rounding error against the $36–$42 ROI per dollar the channel delivers.
Related reading
- What Solar Lead Generators Should Budget for Cold Email Outbound
- 2026 Solar Energy Tracking & Analytics Report: Trends, Stats & Performance Data
- Solar Marketing Attribution: The 2026 Numbers That Decide Budget
- Email Marketing services at Web Tonic
FAQ
What is the average open rate for solar energy emails?
The energy and utilities vertical averages a 34.34% open rate based on aggregated 2025 data, nearly 10 points above the cross-industry average of roughly 24%. Post-inquiry nurture sequences aimed at homeowners who recently requested a panel estimate can reach 38–45%, while re-engagement campaigns targeting dormant contacts typically fall in the 18–24% range.
How much ROI does email marketing deliver for solar companies?
Across industries, the channel delivers an average return of $36–$42 for every $1 invested, making it the highest-ROI digital channel available. For operators in the clean-energy space specifically, automated drip sequences amplify this return further because they convert at 30–45% versus just 8–12% for single-send blasts — effectively tripling the value of every prospect already in the pipeline.
How many emails should a solar drip campaign include?
The optimal structure is 5–12 messages spread over 30–90 days. The 8-step framework — immediate response, education, personalized estimate, FAQ, customer story, incentive breakdown, ROI analysis, and re-engagement — is the most widely validated sequence. Send every 3–5 days during the first two weeks, then taper to weekly to avoid fatigue.
What email deliverability rate should solar installers target?
Target a 98%+ delivery rate. Anything below that signals list-hygiene issues (invalid addresses, spam traps) or authentication gaps (missing SPF, DKIM, or DMARC records). Keep bounce rates under 2%, spam complaints under 0.10%, and unsubscribe rates under 0.50% to protect sender reputation.
Is cold email effective for commercial solar sales?
Yes, when executed properly. B2B cold sequences targeting facility managers and property developers achieve 22–30% open rates and 3–7% reply rates on well-segmented lists. Success depends on clean domain authentication, sending volume under 100 per day, and deep personalization referencing the prospect's building characteristics, utility costs, and eligible incentives.
Sources
designmodo.com/email-marketing-benchmarks-by-industry
surgepv.com/blog/solar-email-drip-campaigns
litmus.com/blog/email-marketing-statistics
cufinder.io/blog/benchmarks/energy
baadigi.com/tools/benchmarks/solar
pipelineon.com/blog/solar-digital-marketing
marketingltb.com/blog/statistics/solar-marketing-statistics
searchlab.nl/en/statistics/email-marketing-statistics-2026
mailchimp.com/resources/email-marketing-benchmarks


