



Table of contents
Facebook's organic reach has fallen from roughly 16% of followers in 2012 to about 1.25% today. This page cross-references three independent 2026 studies to show exactly how far reach, impressions and views have dropped on each major platform, and which formats still earn an audience without a media budget behind them. The numbers below are drawn from published post-level datasets, not self-reported platform dashboards, so the figures can be compared across networks without each platform's own definition of "reach" getting in the way.
Key Takeaways
- Facebook organic reach was 16% of followers in 2012.
- It sits at roughly 1.25% today, a SocialInsider study of 872,075 posts finds.
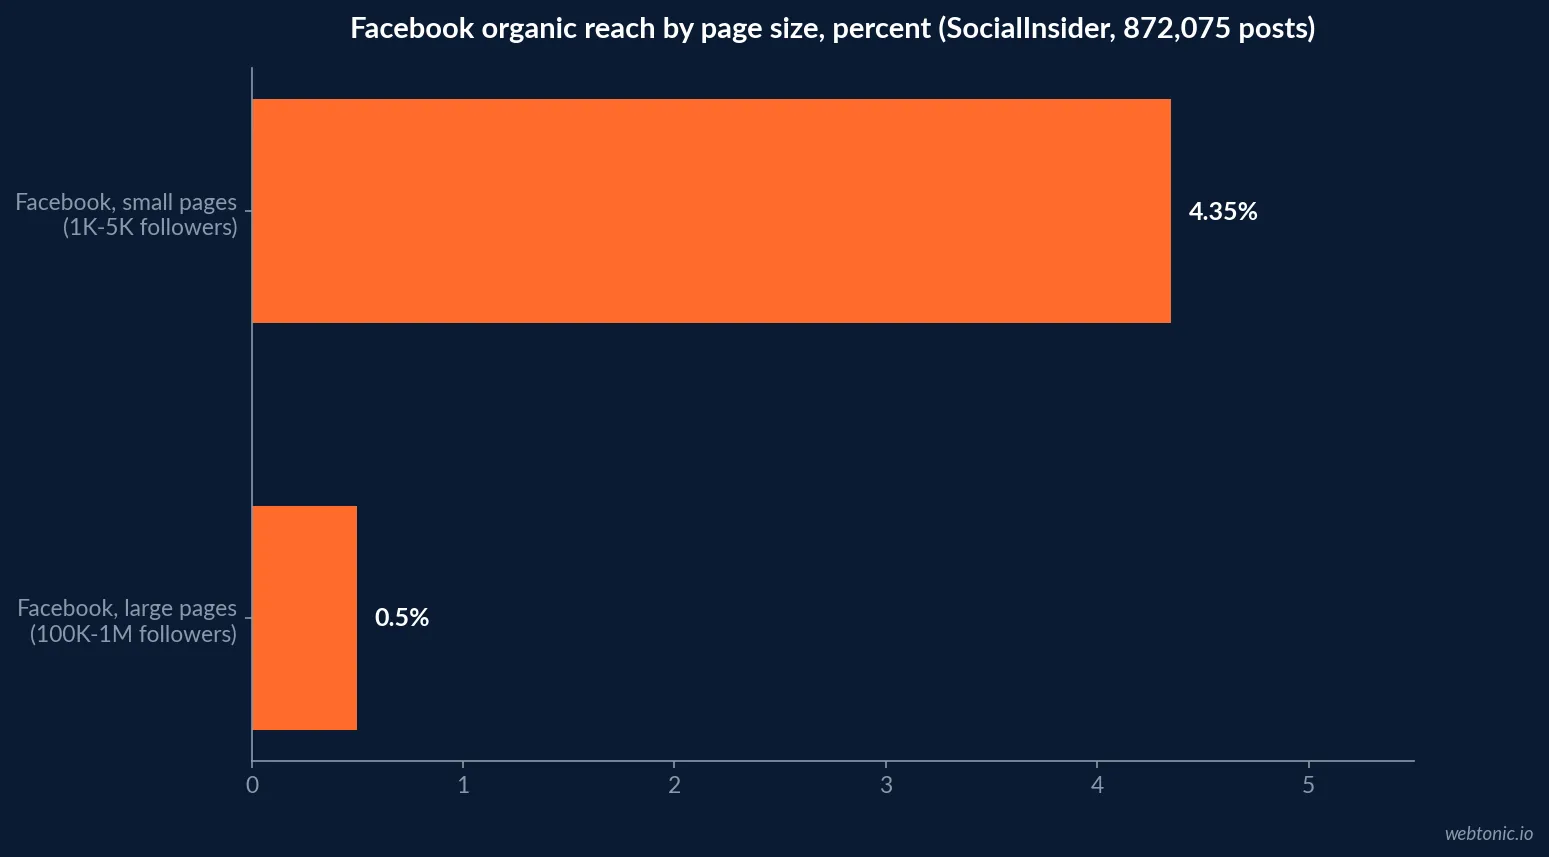
- Small Facebook pages reach 4.35% of their followers per post.
- Large Facebook pages reach just 0.50%, more than 8 times less.
- Instagram's organic reach fell 12% from 2024 to 2025.
- Instagram Reels reach roughly 9% of an account's audience.
- A static Instagram photo reaches about 0.5% by comparison.
- LinkedIn's organic reach fell 34% year over year.
- LinkedIn company pages still average around 4% reach.
- TikTok business accounts reach about 5.7% of followers organically.
- TikTok's median engagement rate is 2.01%, the highest of any platform tracked.
- Instagram's median engagement rate fell 17% to 0.30%.
- Global social media users passed 5.66 billion in October 2025.
- The average user spends 18 hours 36 minutes a week scrolling social feeds.
- That is more than 2.5 hours a day, per GWI data.
The method: three studies, cross-referenced
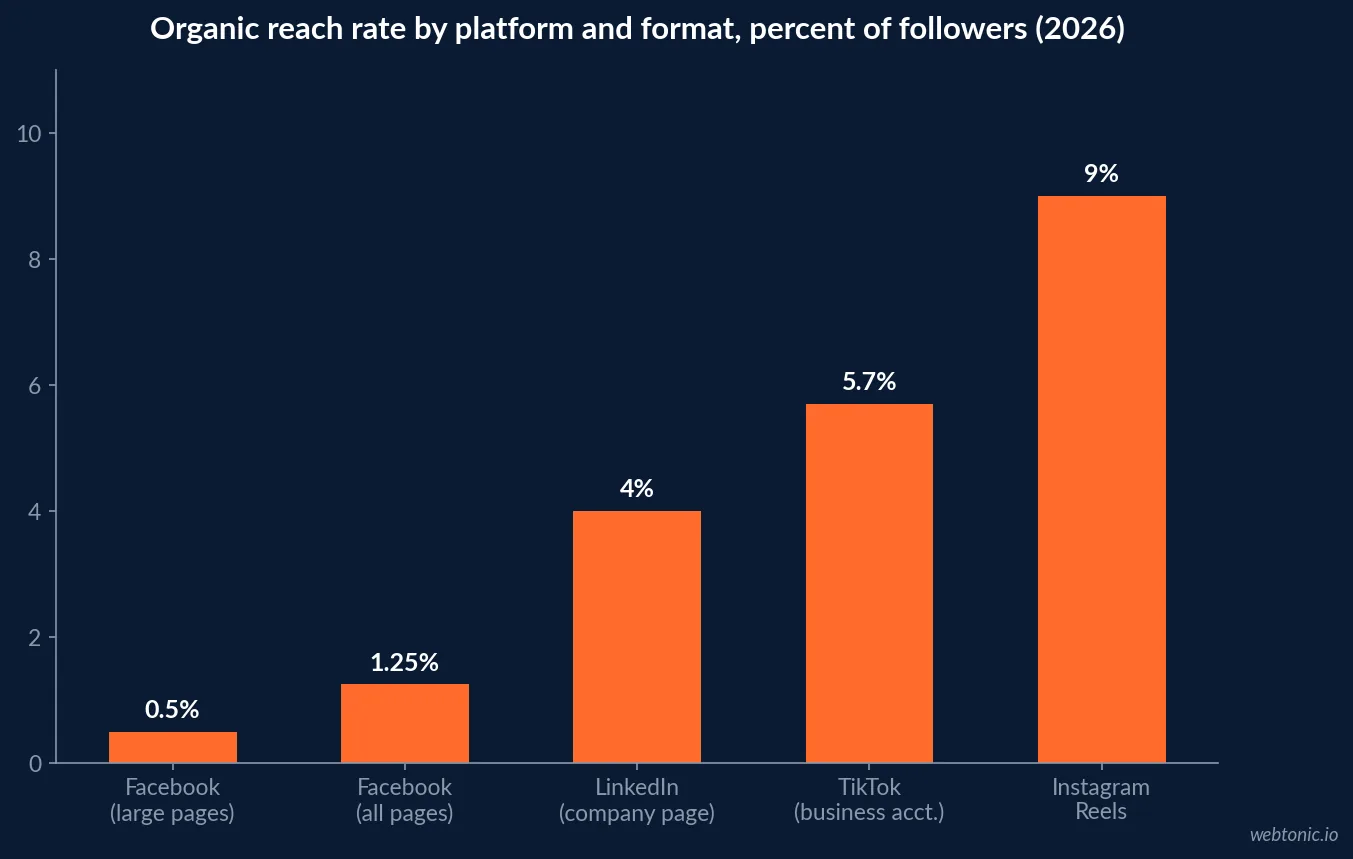
Reach is one of the most inconsistently measured metrics in social media, so this page uses three independent sources rather than one vendor's dashboard: Hootsuite's tracking of organic reach decline, a SocialInsider study of 872,075 brand-page posts cited by independent 2026 benchmark analysis, and Quid's 2026 Social Media Industry Benchmark Report for engagement rate. Where the three agree on direction, the number is treated as solid; where they diverge, both figures are shown.
The three converge on one conclusion: organic reach on the older feed formats has fallen by an order of magnitude over the past decade, and the platforms rewarding short-form video are the exception, not the rule.
| Platform | Organic reach rate (2025-2026) | Trend | Source |
|---|---|---|---|
| Facebook, all pages | 1.25% | Down from 16% in 2012 | SocialInsider study, 872,075 posts |
| Facebook, small pages | 4.35% | Best-performing segment | SocialInsider study |
| Facebook, large pages | 0.50% | Worst-performing segment | SocialInsider study |
| Instagram, static feed | ~0.5% | Down 12% year over year | Socialinsider / Hootsuite |
| Instagram Reels | ~9% | Best format on the platform | Socialinsider / Hootsuite |
| LinkedIn, company page | ~4% | Down 34% year over year | 2026 organic-reach tracking |
| TikTok, business account | ~5.7% | Stable to rising | 2026 organic-reach tracking |
The decade-long decline, in one platform
Facebook's own history is the clearest case study. Hootsuite's tracking shows organic reach at 16% of followers back in 2012, a period before Facebook prioritized paid distribution and friends-and-family content in the feed. By 2025 that figure sat between 1% and 2%, and the SocialInsider study puts the precise current average at 1.25% across 872,075 posts.
That is roughly a 90% reduction in the share of an audience a typical post reaches without paid support, over the same period the platform's total audience kept growing - which is exactly why a page's follower count and its actual reach have become two very different numbers.
| Facebook page size | Organic reach rate | Source |
|---|---|---|
| 1,000 - 5,000 followers | 4.35% | SocialInsider study, 872,075 posts |
| All pages, average | 1.25% | SocialInsider study |
| 100,000 - 1,000,000 followers | 0.50% | SocialInsider study |
Impressions still favor one format: short-form video
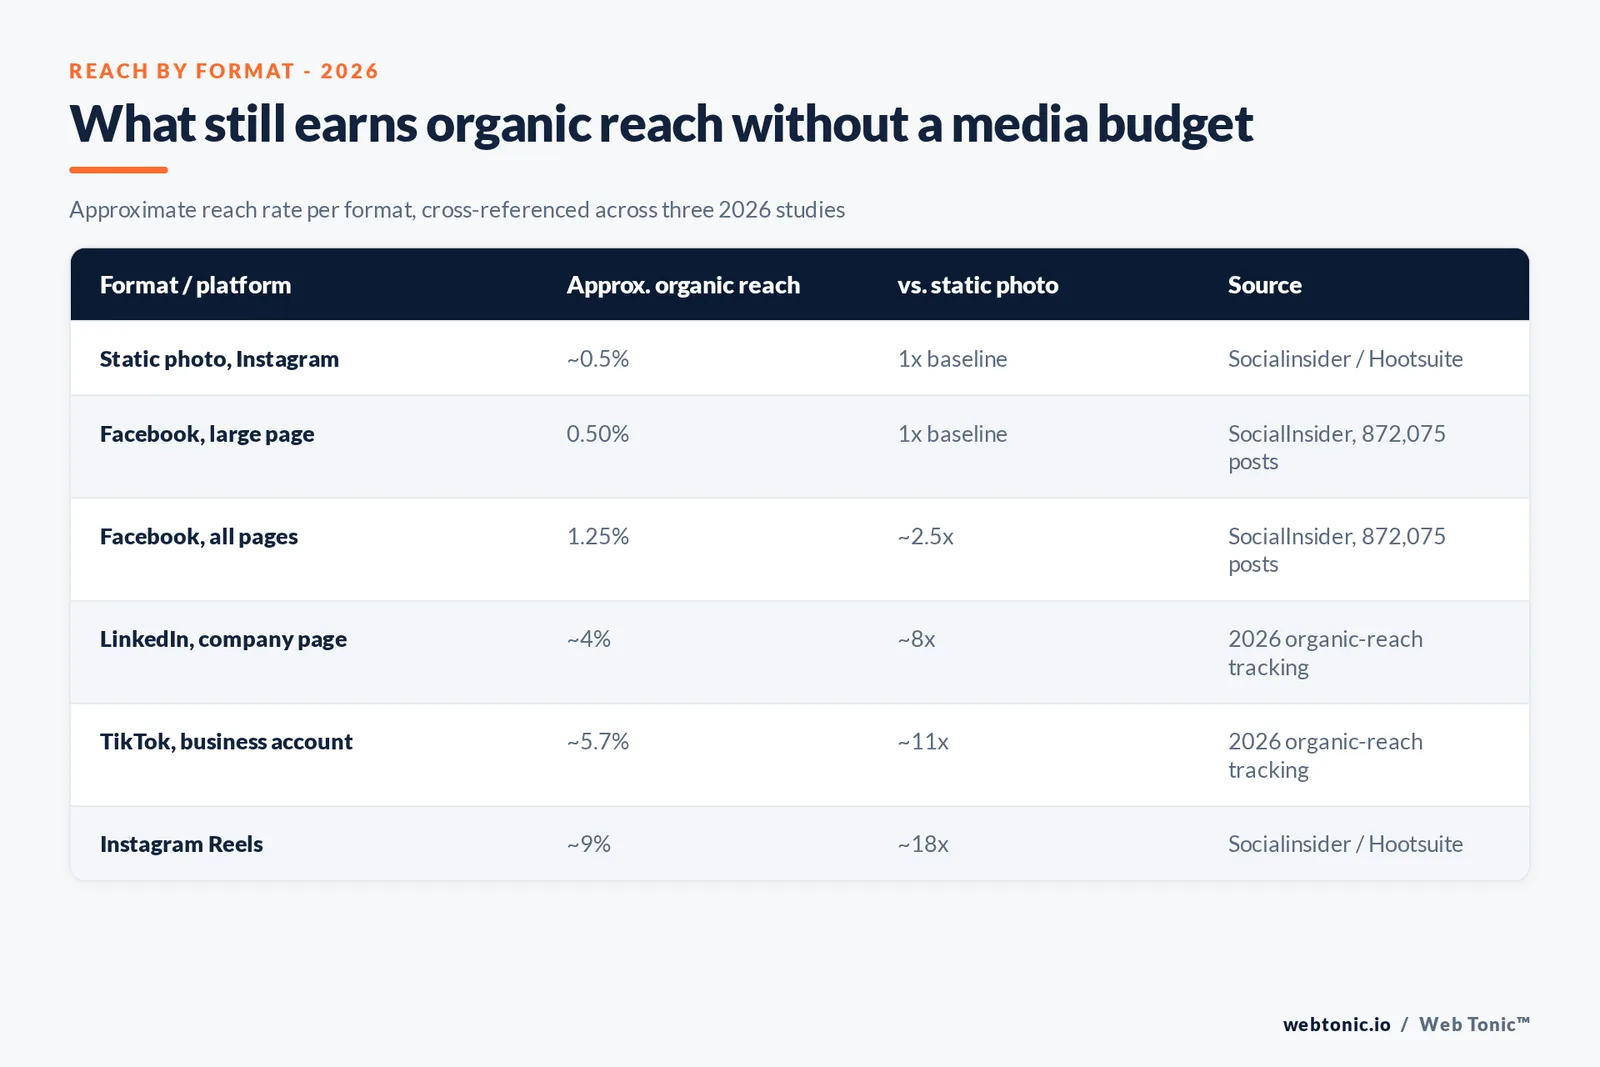
The exception to the decline is short-form video. Socialinsider data referenced across independent 2026 organic-reach analysis puts Instagram Reels reach around 9% of an account's audience against roughly 0.5% for a static photo post - an 18-times difference in the same feed, on the same account, decided purely by format. TikTok's business-account reach of roughly 5.7% reflects the same pattern on a platform built around video from the start.
For a content calendar, this is the single most actionable number here: format choice moves reach further than almost any other lever available without paid spend.
| Format | Approx. organic reach | Platform | Multiple vs. static photo |
|---|---|---|---|
| Static photo post | ~0.5% | 1x (baseline) | |
| Business account video | ~5.7% | TikTok | ~11x |
| Short-form video (Reels) | ~9% | ~18x |
Engagement rate as a second lens on reach
Reach determines how many people see a post; engagement rate determines what share of them act on it. Quid's 2026 Social Media Industry Benchmark Report puts TikTok's median engagement rate at 2.01%, well ahead of every other platform in its benchmark, while Instagram's median fell 17% year over year to 0.30% and X's median doubled from 0.015% to 0.03% after several years of decline.
Read together with the reach numbers above, TikTok is winning on both dimensions at once in 2026: more of an account's audience sees a given post, and a higher share of viewers engage with it.
| Platform | Median engagement rate (2026) | YoY direction | Source |
|---|---|---|---|
| TikTok | 2.01% | Stable to rising | Quid 2026 Benchmark Report |
| 0.30% | Down 17% | Quid 2026 Benchmark Report | |
| Flat | No meaningful change | Quid 2026 Benchmark Report | |
| X (Twitter) | 0.03% | Up from 0.015% | Quid 2026 Benchmark Report |
The attention pool these numbers compete for
The decline in reach per post is happening against a growing audience, not a shrinking one. DataReportal's Digital 2026 Global Overview Report counts 5.66 billion active social media user identities worldwide as of October 2025, 68.7% of the global population, and GWI's survey data inside the same report puts the average user's weekly consumption at 18 hours and 36 minutes - more than 2.5 hours a day.
More total attention exists than ever; less of it is available to any single post without either the right format or a media budget behind it. Our data and analytics practice builds the reach-versus-spend model that shows which posts in a client's own calendar still clear a reasonable organic threshold.
What to measure instead of raw reach
Given how much reach now depends on format and page size rather than content quality alone, reach-per-follower is a weaker planning metric in 2026 than it was a decade ago. Track engagement rate alongside it, and treat any format consistently clearing 5% organic reach - short-form video on the numbers above - as the baseline for anything that has to earn attention without paid support.
For campaigns that need guaranteed reach regardless of format, our paid strategy guide covers the budget side of the equation these organic numbers can no longer cover alone.
How industry benchmarks move the average
Sprout Social's 2025 Content Benchmarks Report found engagements on Facebook and Instagram grew 9% and 28% respectively that year even as per-post reach kept falling, because brands simply posted more to compensate. eMarketer's H2 2026 forecast treats that behavior as structural: social video and automation are cited as the two forces keeping ad spending on social climbing even as organic reach per post declines.
The practical read: rising total engagement at the account level can mask falling reach at the post level, so benchmark both numbers separately before deciding a content strategy is working.
Impressions versus reach: a distinction worth keeping straight
Reach counts unique people; impressions count total views, including repeat exposure to the same person. A post can lose reach while gaining impressions if the algorithm shows it repeatedly to a smaller, more engaged slice of an audience - which is effectively what has happened on Facebook and Instagram as reach-per-follower fell while total engagement, per Sprout Social's 2025 Content Benchmarks Report, still rose on both platforms. Reporting only one of the two numbers to a client or a leadership team can tell a misleadingly optimistic or pessimistic story depending on which one is chosen.
Track both side by side: reach shows how many people a content calendar is still finding, and impressions show how hard the algorithm is working to keep the ones it does find in front of a post multiple times.
| Metric | What it measures | Risk if used alone |
|---|---|---|
| Reach | Unique accounts shown the post | Misses repeat-impression concentration |
| Impressions | Total views, including repeats | Overstates unique audience size |
| Engagement rate | Interactions relative to reach or followers | Denominator choice changes the number |
What a content calendar should do differently
Given an 18-times gap between a static Instagram photo and a Reel in organic reach, a content calendar built primarily around static posts is competing with one hand behind its back before a single dollar of paid support gets added. The lowest-effort fix documented across the sources here is a format shift, not a posting-frequency increase: Sprout Social's benchmark data shows some industries already compensating for falling reach by publishing more often, without a proportional recovery in per-post performance.
Our growth marketing team audits a client's own reach and engagement data against these published benchmarks before recommending whether the fix is format, frequency or paid support.
Regional variation worth accounting for
Reach and engagement benchmarks are usually reported as global or US medians, but regional behavior varies enough to matter for a multi-market brand. Sprout Social's regional breakdown finds North America posting least frequently of three tracked regions while APAC brands post roughly twice as often and see the highest overall inbound engagement, and Instagram leads daily engagement in North America specifically while Facebook and Instagram both drive the most engagement in EMEA. A single global reach target applied uniformly across regions will systematically under-serve whichever market actually rewards more frequent posting.
Where budget allows, benchmark reach and engagement by region separately rather than against one blended global median, and let the regional cadence - not head-office convenience - set the posting schedule.
| Region | Posting frequency | Notable strength | Source |
|---|---|---|---|
| North America | ~9.5 posts/day | Highest daily Instagram engagement | Sprout Social 2025 |
| EMEA | ~12 posts/day | Facebook and Instagram both drive engagement | Sprout Social 2025 |
| APAC | ~20 posts/day | Highest overall inbound engagement | Sprout Social 2025 |
Frequently Asked Questions
How much has Facebook's organic reach actually fallen?
From roughly 16% of followers in 2012 to between 1% and 2% today, according to Hootsuite's tracking of the metric. A SocialInsider study of 872,075 brand-page posts puts the current average even more precisely at 1.25% of followers, with small pages (1,000 to 5,000 followers) averaging 4.35% and large pages (100,000 to 1 million followers) averaging just 0.50%.
Does page size affect reach rate?
Yes, inversely. SocialInsider's data shows small Facebook pages reaching 4.35% of their following per post against 0.50% for pages over 100,000 followers - a gap of more than 8 times. Bigger audiences get a smaller percentage of themselves reached organically, even though the absolute number of people reached is usually still higher.
Which format still gets meaningful organic reach?
Short-form video, consistently. Instagram Reels reach roughly 9% of an account's audience against 0.5% for a static photo post, based on Socialinsider data referenced in independent 2026 organic-reach tracking. TikTok business accounts see a comparable advantage, with organic reach around 5.7% - several times what a comparable static post achieves on an older feed format.
Has LinkedIn's organic reach also declined?
Yes, and by one of the larger margins tracked. The same 2026 organic-reach tracking that documented Facebook and Instagram's declines put LinkedIn's year-over-year drop at 34%, even as company-page reach still averages around 4% of followers - higher than Facebook's but falling faster.
What should a brand do differently given these numbers?
Treat organic posting as a discovery and community tool, not a distribution channel, and budget paid amplification for anything that needs guaranteed reach. Quid's 2026 benchmark data shows TikTok's engagement rate still running several times ahead of the rest of the field, which is the closest thing to a free-reach advantage left in the market.
Sources
Hootsuite - What is organic reach, and how can you improve yours?
Heistbrain - Average Facebook Organic Reach in 2026 (SocialInsider study, 872,075 posts)
Quid (formerly Rival IQ) - 2026 Social Media Industry Benchmark Report
DataReportal - Digital 2026 Global Overview Report (Kepios, We Are Social, Meltwater)
Sprout Social - 2025 Content Benchmarks Report
EMARKETER - US Social Network Ad Spending, H2 2026


