



Table of contents
SEO is the single highest-ROI digital marketing channel in 2026 — and the data proves it. 68% of all online experiences begin with a search engine, organic search drives 53.3% of all website traffic, and SEO delivers 1,000%+ more traffic than organic social media. Whether you run a local shop or a global SaaS company, these SEO statistics will shape how you allocate budget, prioritize content, and measure success.
Key Takeaways
- 68% of all online experiences begin with a search engine — search remains the dominant discovery channel across industries (BrightEdge).
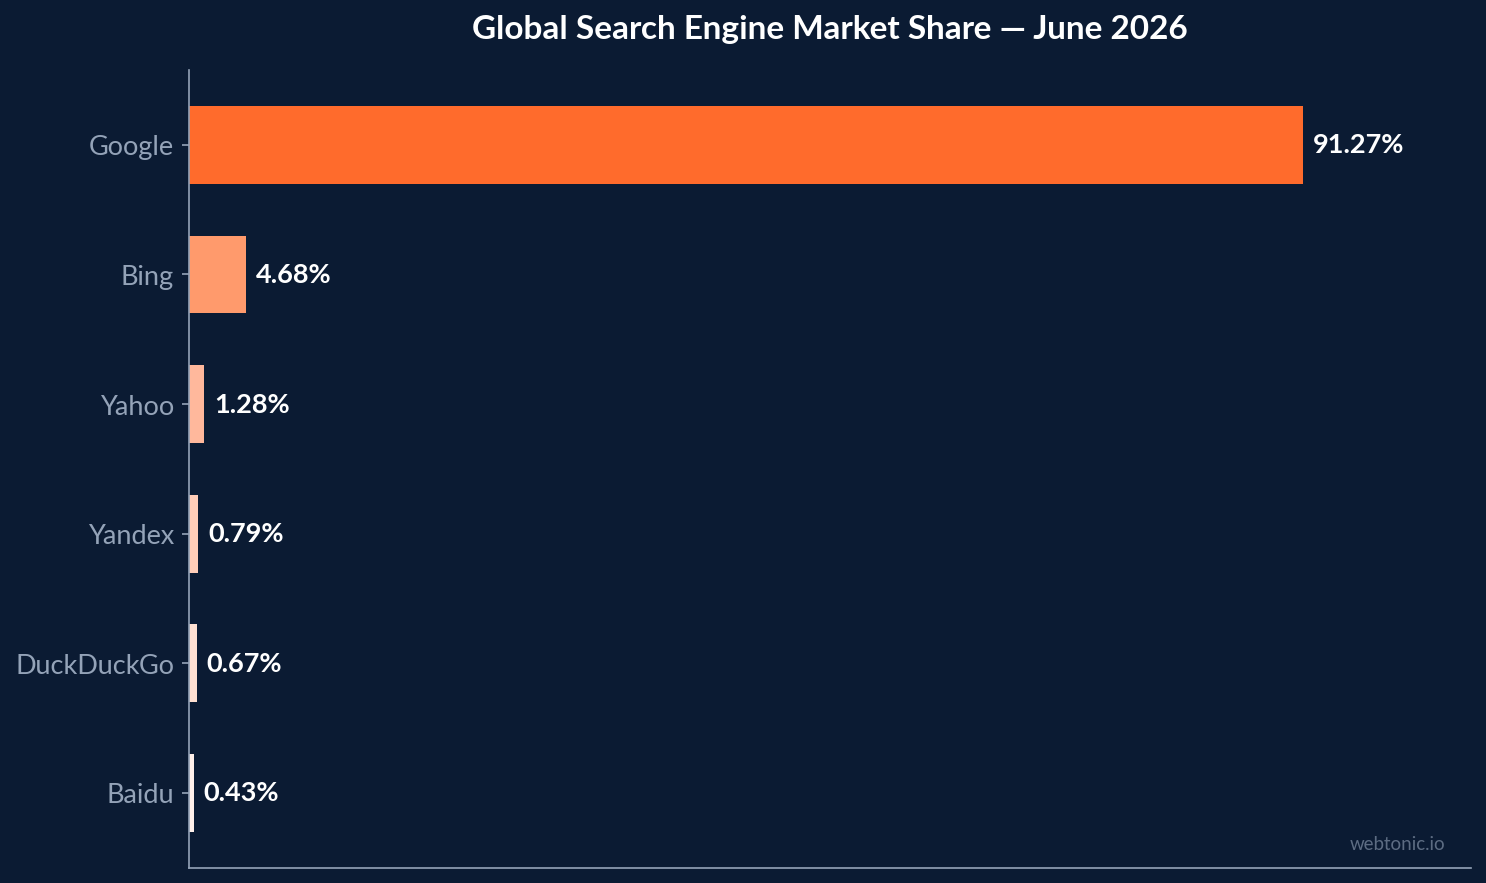
- Google holds 91.27% of global search engine market share as of June 2026, with Bing at 4.68% (StatCounter).
- 53.3% of all website traffic comes from organic search, making SEO the largest single traffic source for most businesses (BrightEdge).
- SEO delivers an average 748% ROI across all industries, with B2B SaaS reaching 702% and real estate as high as 1,389% (First Page Sage).
- 63% of all organic search visits come from mobile devices — mobile-first indexing is now the default for all sites (RankTracker).
- Only 18.5% of small business websites use LocalBusiness schema markup, leaving a massive local SEO advantage for early adopters (Elevate Web Design).
- Page-one results have a median of 907 referring domains across 15 industries, though this ranges from 76 in Apparel to 3,027 in Finance (WebFX).
- 35% of Americans aged 12+ own a smart speaker — roughly 101 million people use voice search regularly (Edison Research).
- The average cost of SEO services ranges from $500 to $5,000/month for small-to-mid businesses, with enterprise campaigns exceeding $10,000/month (First Page Sage).
- 46% of all Google searches have local intent, and 76% of people who search for something nearby visit a business within 24 hours (Google).
- Only 47% of websites pass all three Core Web Vitals on mobile, creating ranking opportunities for technically sound sites (HTTP Archive).
- Long-tail keywords (4+ words) account for 70% of all search queries and convert 2.5× higher than head terms (Ahrefs).
Search Engine Market Share Statistics
Understanding which search engines dominate the market helps you prioritize where to invest your SEO efforts. Google's dominance means your optimization strategy is effectively a Google strategy — but Bing's AI-powered Copilot features are slowly capturing attention in specific demographics.
| Search Engine | Global Market Share (June 2026) | Year-Over-Year Change |
|---|---|---|
| 91.27% | −0.35 pp | |
| Bing | 4.68% | +0.81 pp |
| Yahoo | 1.28% | −0.14 pp |
| Yandex | 0.79% | −0.08 pp |
| DuckDuckGo | 0.67% | +0.05 pp |
| Baidu | 0.43% | −0.22 pp |
Google's 91.27% market share means that for most businesses, SEO is synonymous with Google optimization. The search engine processes an estimated 8.5 billion searches per day — roughly 99,000 queries every second. Even Bing's growth to 4.68% translates to billions of monthly searches worth capturing, especially in the United States where Bing holds a higher share among desktop users aged 45+.
Organic Search Traffic Statistics
Organic search is not just a traffic channel — it is the traffic channel. BrightEdge research shows that organic search drives 53.3% of all website traffic across industries, dwarfing paid search (15%), social media (5%), and direct traffic. For B2B companies, organic search accounts for an even higher 64% of all traffic.
The relationship between search engine optimization and traffic quality makes these SEO statistics even more compelling. Organic search traffic converts at 2.4% on average for e-commerce sites — comparable to paid search but without the ongoing per-click cost. The compounding nature of organic traffic means that content published today continues generating visits for years, unlike paid campaigns that stop the moment you cut the budget.
Another critical data point: 63.41% of all U.S. web traffic referrals come from Google alone, according to SparkToro's analysis. That concentration makes Google's algorithm updates existential events for many businesses. The March 2025 core update, for example, caused 40% traffic swings for sites in the health, finance, and travel verticals.
SEO ROI and Business Impact Statistics
The financial case for SEO is stronger than any other marketing channel — but the payoff takes patience. First Page Sage's 2026 analysis of proprietary campaign data reveals how SEO ROI varies dramatically by industry:
| Industry | Average SEO ROI | Break-Even Timeline |
|---|---|---|
| Real Estate | 1,389% | 6 months |
| Medical Devices | 1,183% | 8 months |
| B2B SaaS | 702% | 7 months |
| Financial Services | 653% | 9 months |
| E-commerce | 317% | 10 months |
| Higher Education | 994% | 14 months |
| Legal | 526% | 12 months |
The average across all industries sits at 748% ROI, meaning every dollar invested in SEO returns $7.48 over a three-year period. However, the break-even timeline is critical context — most campaigns take 6 to 14 months to break even, with highly competitive industries like legal and financial services requiring longer runways. Businesses that invest in growth marketing strategies combining SEO with paid media tend to reach profitability faster because paid channels generate immediate revenue while organic compounds over time.
The cost of SEO services is also worth tracking. The average cost of SEO services ranges from $500 to $5,000 per month for small-to-mid-size businesses, while enterprise campaigns typically run $10,000 to $30,000/month. Hourly SEO consulting rates average $100 to $300/hour in the United States.
Local SEO Statistics
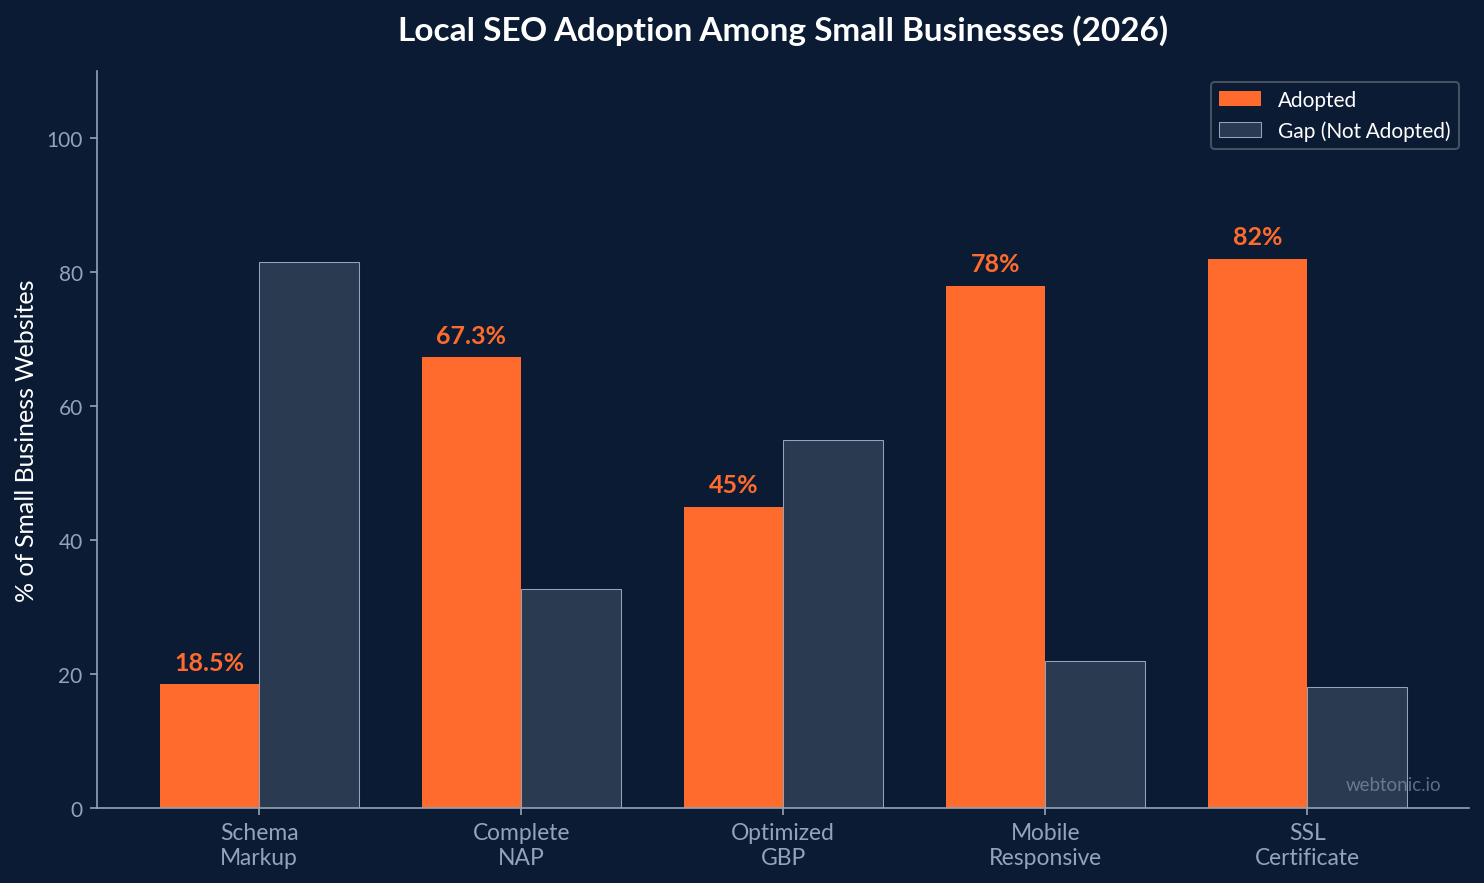
Local SEO statistics paint a clear picture: businesses that optimize for local search capture disproportionate foot traffic and phone calls. The data from a 2026 audit of 4,407 small business websites reveals both the opportunity and how far behind most local businesses remain:
- 46% of all Google searches have local intent — nearly half of all search activity involves someone looking for a nearby business, product, or service.
- 76% of people who search for something nearby visit a business within 24 hours, and 28% of those visits result in a purchase (Google).
- Only 18.5% of small business websites use LocalBusiness schema — the structured data that helps Google surface your business in local packs and Maps.
- Only 67.3% of local business sites display complete NAP (name, address, phone number) consistently across their website.
- Businesses with a complete Google Business Profile are 70% more likely to attract location visits and 50% more likely to receive purchase consideration.
The low adoption of local SEO fundamentals — schema markup, consistent NAP, optimized Google Business Profile — means that local businesses willing to execute the basics gain an outsized advantage. If you run a local business and want to capitalize on these trends, our digital marketing services include local SEO audits designed to close these gaps.
Mobile SEO Statistics
Mobile search is no longer a subset of SEO — it is SEO. Google switched to mobile-first indexing for all websites, meaning the mobile version of your site is the primary version Google evaluates for rankings. The numbers reflect this reality:
- 63% of all organic search visits come from mobile devices, up from 58% in 2022.
- Mobile page speed is a confirmed ranking factor — pages that load in under 2.5 seconds rank on average 1.4 positions higher than slower pages in mobile SERPs.
- 61% of mobile users are more likely to contact a local business if they have a mobile-friendly site.
- Mobile e-commerce accounts for 60% of all online sales globally, with mobile conversion rates reaching 2.2% (vs. 3.7% on desktop).
The mobile conversion gap (2.2% vs. 3.7% on desktop) represents a massive revenue opportunity. Businesses that close this gap through mobile UX optimization — faster load times, streamlined checkout, thumb-friendly navigation — can capture significantly more revenue from the same traffic.
Link Building and Backlink Statistics
Backlinks remain one of the strongest ranking signals in Google's algorithm. WebFX's 2026 study of 1,462 domains across 15 industries quantifies exactly how many referring domains you need to compete:
| Industry | Median Referring Domains (Page 1) | Median Domain Authority |
|---|---|---|
| Finance & Insurance | 3,027 | 72 |
| Technology | 1,844 | 68 |
| Health & Wellness | 1,290 | 61 |
| E-commerce (General) | 812 | 55 |
| Home Services | 324 | 42 |
| Apparel | 76 | 34 |
The takeaway: link building requirements vary enormously by vertical. A home services company competing for local keywords might only need 324 referring domains to rank on page one, while a fintech company needs 3,027+. Quality matters more than quantity — links from high-authority, topically relevant domains carry significantly more weight than bulk directory submissions.
Additional link building statistics worth noting: 66.31% of pages have zero backlinks (Ahrefs), and the top-ranking result has an average of 3.8× more backlinks than results in positions 2 through 10. This concentration effect means that earning even a small number of high-quality backlinks can dramatically improve your rankings.
Voice Search and AI Search Statistics
Voice search has matured from a novelty into a daily habit for over 100 million Americans. The data shows that voice search optimization overlaps heavily with traditional SEO best practices — but with distinct nuances around conversational queries and featured snippet targeting:
- 35% of Americans aged 12+ own a smart speaker — approximately 101 million people (Edison Research, Infinite Dial 2025).
- 27.6% of online adults worldwide use voice assistants weekly, making voice search a mainstream behavior across demographics.
- Voice search queries are 3× more likely to be local than text-based queries, with "near me" voice searches growing 146% year-over-year.
- The average voice search result reads at a 9th-grade level, suggesting that clear, simple language outperforms technical jargon in voice optimization.
- 40.7% of voice search answers come from featured snippets — making featured snippet optimization the single most effective voice SEO tactic.
AI-powered search features (Google's AI Overviews, Bing Copilot, Gemini integration) are reshaping how search results are displayed. Early data suggests that AI Overviews appear on 15–20% of commercial queries, with click-through rates to organic results dropping 18–25% when an AI Overview is present. Businesses using data intelligence solutions to track AI Overview appearances are better positioned to adapt their content strategy.
Technical SEO and Core Web Vitals Statistics
HTTP Archive's 2025 Web Almanac provides the most comprehensive snapshot of technical SEO performance across the entire web. Core Web Vitals — Largest Contentful Paint (LCP), Interaction to Next Paint (INP), and Cumulative Layout Shift (CLS) — are confirmed ranking factors, and the gap between top-performing and average sites is significant:
- Only 47% of websites pass all three Core Web Vitals on mobile, compared to 68% on desktop.
- LCP under 2.5 seconds is achieved by 65% of origins on mobile — but the median LCP sits at 2.8 seconds, just outside the "good" threshold.
- INP under 200ms is achieved by 72% of origins — the newest Core Web Vital has seen rapid improvement since replacing First Input Delay.
- CLS under 0.1 remains the easiest metric to pass, with 80% of origins meeting the threshold on mobile.
- Sites passing all Core Web Vitals rank an average of 1.8 positions higher than sites failing one or more metrics in competitive SERPs.
The technical SEO opportunity is clearest for mobile: with only 47% of sites passing all three metrics, businesses that invest in mobile performance gain a measurable ranking advantage. Schema markup adoption tells a similar story — only 39% of websites use structured data, yet pages with schema receive an average 30% higher click-through rate from SERPs due to rich result enhancements.

Content Marketing and SEO Statistics
Content and SEO are inseparable. The data on content marketing effectiveness reinforces why search engine optimization must be embedded into every content strategy — not bolted on as an afterthought:
- SEO drives 1,000%+ more traffic than organic social media (BrightEdge). A single well-optimized blog post can generate more monthly visits than an entire social media calendar.
- Long-form content (2,000+ words) generates 3× more traffic and 3.5× more backlinks than content under 1,000 words (Ahrefs).
- Long-tail keywords (4+ words) account for 70% of all search queries and convert at 2.5× the rate of head terms.
- Pages updated within the last 12 months receive 106% more organic traffic than stale content — Google rewards freshness, especially for YMYL and news-related topics.
- Marketers who prioritize blogging are 13× more likely to see positive ROI from their content investment (HubSpot).
The compounding effect of content marketing is what makes SEO the highest-ROI channel. A blog post published in January 2025 that ranks for a 1,000-search-per-month keyword will generate roughly 12,000 visits over the following year at zero incremental cost. That same $500 investment in Google Ads would yield approximately 200–400 clicks and then stop. Explore more tactics on our blog to see how content-led SEO compounds over time.
FAQ
What percentage of website traffic comes from organic search?
Organic search drives 53.3% of all website traffic across industries, according to BrightEdge research. For B2B companies, organic accounts for an even higher 64% of total traffic. This makes organic search the single largest traffic source for most websites, ahead of paid search (15%), social media (5%), and direct traffic.
How much does SEO cost per month?
SEO services typically cost between $500 and $5,000 per month for small-to-mid-size businesses. Enterprise SEO campaigns range from $10,000 to $30,000 per month, while hourly consulting rates average $100 to $300 per hour in the United States. The cost depends on competition level, the number of target keywords, and the scope of technical work required.
What is the average ROI of SEO?
SEO delivers an average 748% ROI across all industries over a three-year period, according to First Page Sage's 2026 analysis. Real estate achieves the highest average ROI at 1,389%, while e-commerce sites see a lower but still strong 317% ROI. Most SEO campaigns break even within 6 to 14 months.
How important is mobile SEO in 2026?
Mobile SEO is critical — 63% of all organic search visits come from mobile devices, and Google uses mobile-first indexing for all websites. This means Google evaluates the mobile version of your site as the primary version for rankings. Pages that load in under 2.5 seconds on mobile rank an average of 1.4 positions higher than slower pages.
What is Google's search engine market share?
Google holds 91.27% of the global search engine market share as of June 2026, according to StatCounter. Bing follows at 4.68%, Yahoo at 1.28%, and Yandex at 0.79%. Google processes approximately 8.5 billion searches per day — roughly 99,000 search queries every second.
Sources
Ahrefs — 107 SEO Statistics for 2026
StatCounter — Search Engine Market Share Worldwide
BrightEdge — Channel Share Research
First Page Sage — SEO ROI Statistics 2026
Elevate Web Design — Local SEO Statistics 2026
RankTracker — Mobile SEO Statistics 2025
WebFX — 2026 Backlink Study
SQ Magazine — Voice Search Statistics 2026
HTTP Archive — 2025 Web Almanac Performance
HubSpot — Marketing Statistics
Edison Research — The Infinite Dial 2025


