Table of contents
Restaurant marketing is the work of getting found by hungry people nearby, converting that attention into a booking or an order, and then earning the second visit. The channels are cheap by industry standards — the discipline is not.
Key Takeaways
- The US restaurant industry is projected at $1.55 trillion in sales for 2026 with real growth of only 1.3%, so most growth has to be taken from competitors rather than from an expanding market.
- Search ads are unusually cheap here: $2.05 average CPC versus $5.42 across all industries, and a $30.57 average cost per lead versus $66.69.
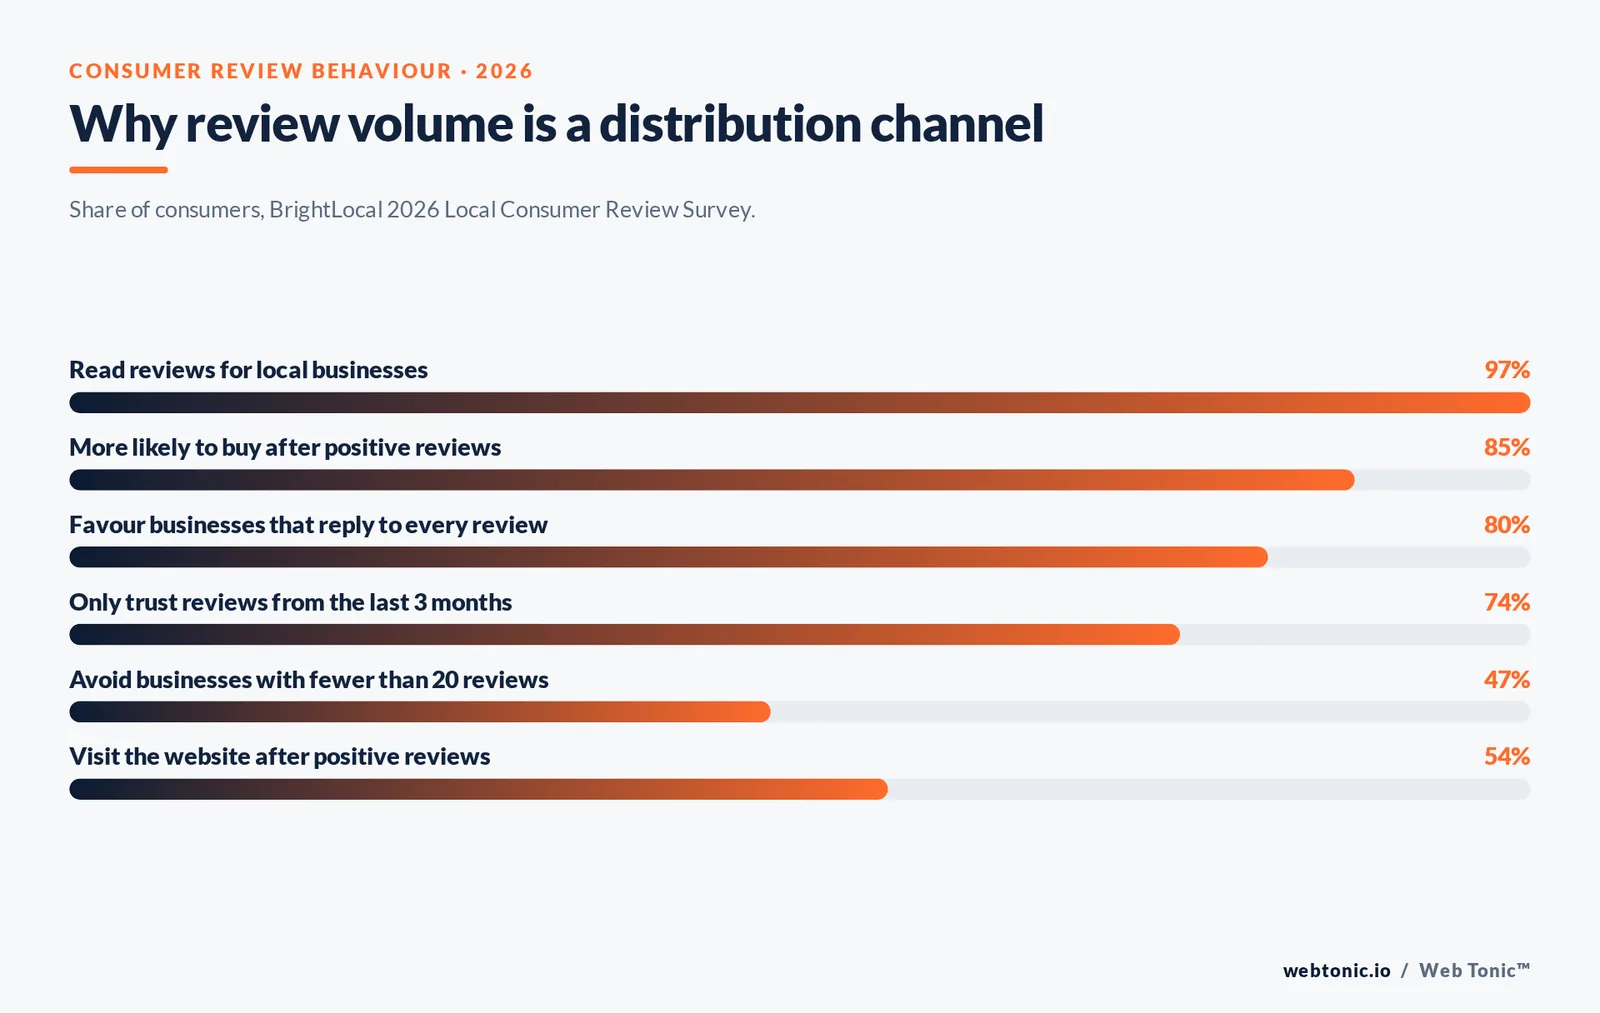
- 97% of consumers read reviews for local businesses and 47% will not use a business with fewer than 20 reviews — review volume is a distribution channel, not vanity.
- 74% of consumers only trust reviews from the last three months, which makes a continuous review flow worth more than a one-time review push.
- Google Business Profile signals drive roughly 32% of local pack visibility, yet only 35% of small businesses have claimed a profile at all.
- Generative AI tools jumped to 45% as a local recommendation source (from 6%), so structured, consistent restaurant data now feeds answer engines too.
- Restaurant search ads convert at 8.05% with a 6.83% click-through rate — close to all-industry averages, so the advantage comes from cost, not conversion.
- Owned channels beat rented ones: a first-party email and SMS list plus direct online ordering is the only part of the stack where margin is not shared with a marketplace.
Why restaurant marketing follows different rules
Most marketing playbooks assume a considered purchase with a long sales cycle and a large ticket. Restaurants invert all three variables: the decision window is often under 30 minutes, the average ticket is small, and frequency is the profit lever. A guest worth $28 on a single visit is worth several hundred dollars a year if they return monthly, which is why acquisition-only marketing quietly loses money in this category.
Three structural constraints shape every decision below.
| Constraint | What it means in practice | Marketing consequence |
|---|---|---|
| Geography caps demand | Nearly all revenue comes from a 3–15 minute travel radius | Local search, maps and geo-fenced paid beat broad reach every time |
| Thin margins | Food, labour and rent absorb most of the ticket before marketing spend | Discounting is the most expensive growth tactic available; use it last |
| Perishable capacity | An empty Tuesday table cannot be sold on Friday | Marketing should be scheduled against slow dayparts, not spread evenly |
| Impulse timing | The decision is made minutes before the visit | Speed of information — hours, menu, photos, directions — decides the sale |
| Third-party dependence | Marketplaces own the customer relationship and the data | Every channel plan needs a direct-ordering counterweight |
Operators are not imagining the pressure. The National Restaurant Association's 2026 State of the Industry report projects industry sales of $1.55 trillion and around 100,000 new jobs against inflation-squeezed household budgets, and broader US restaurant market data shows the same flat-traffic, rising-cost pattern. Marketing has to earn incremental covers, not just impressions.
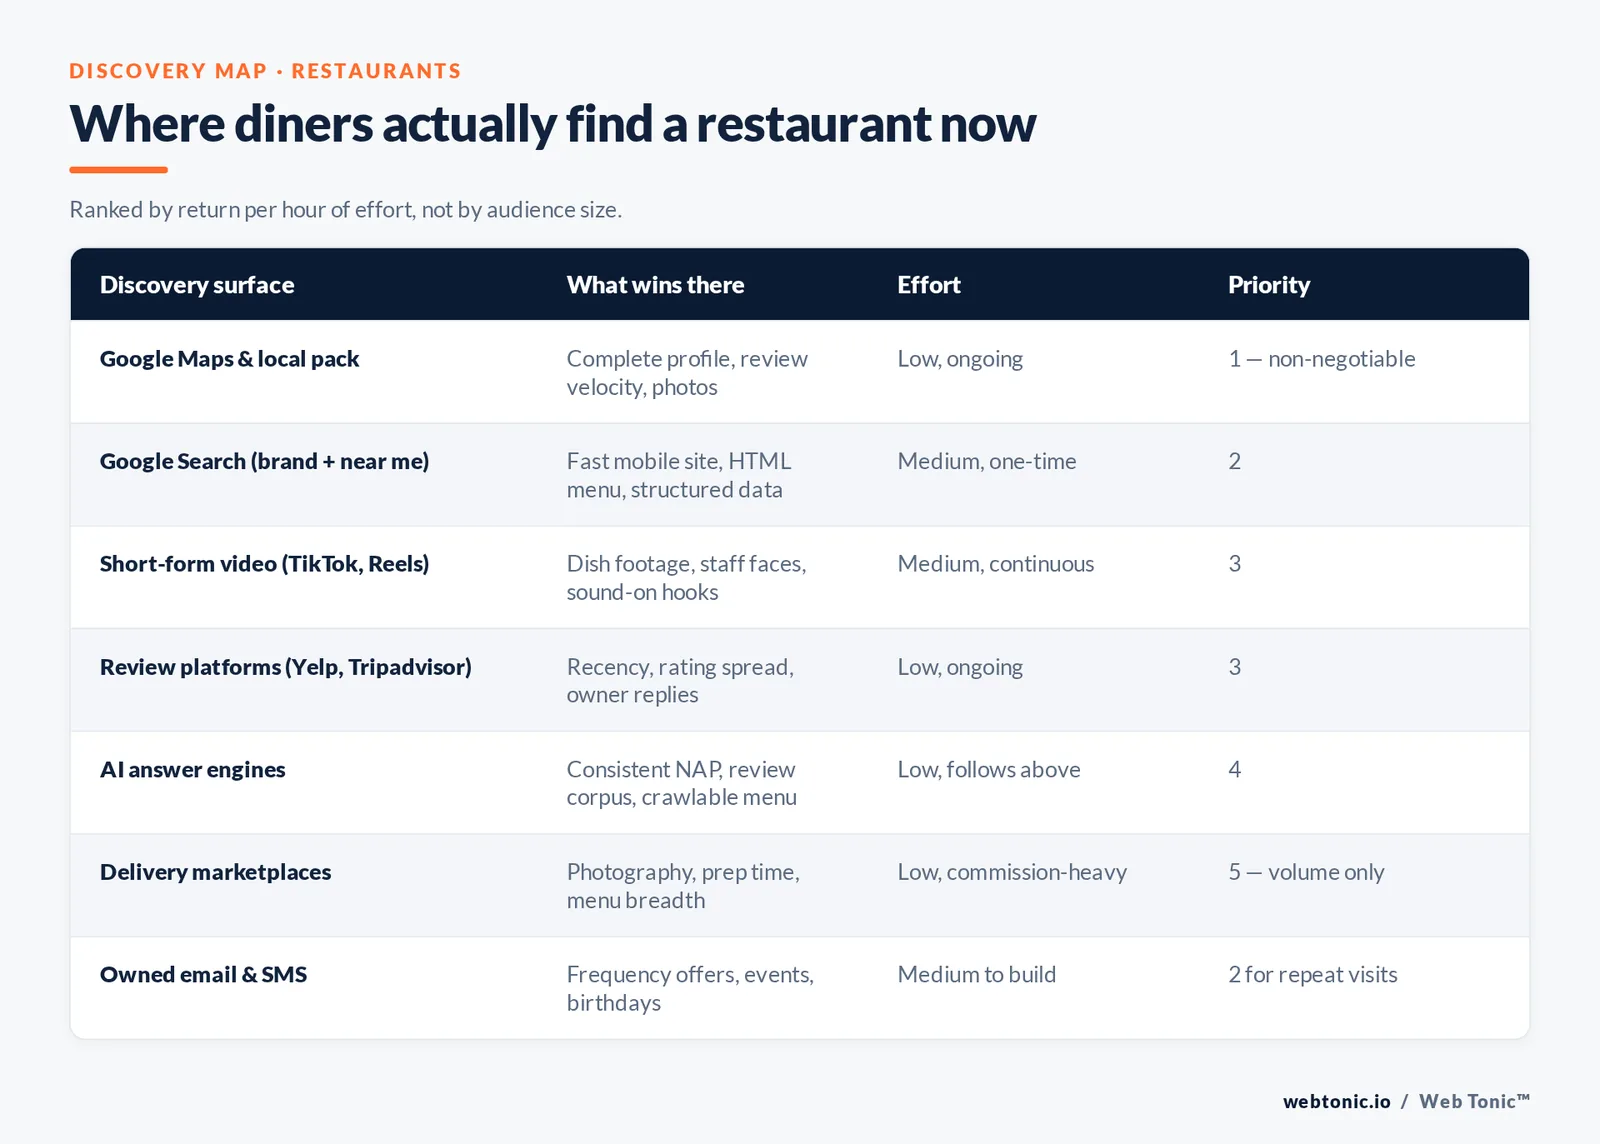
Where diners actually find a restaurant now
Discovery has consolidated around maps, reviews, social video and — increasingly — AI assistants. BrightLocal's 2026 Local Consumer Review Survey is the cleanest read on the shift: Google's share as a review source fell from 83% to 71%, Apple Maps climbed from 14% to 27%, and generative AI tools rocketed from 6% to 45%.
| Discovery surface | What wins there | Effort to compete | Priority |
|---|---|---|---|
| Google Maps & local pack | Complete profile, review velocity, categories, photos | Low, ongoing | 1 — non-negotiable |
| Google Search (brand + "near me") | Fast mobile site, menu in HTML, structured data | Medium, one-time build | 2 |
| Short-form video (TikTok, Reels) | Dish-level footage, staff faces, sound-on hooks | Medium, continuous | 3 |
| Review platforms (Yelp, Tripadvisor) | Recency, rating distribution, owner replies | Low, ongoing | 3 |
| AI answer engines | Consistent NAP data, review corpus, crawlable menu | Low, follows from the above | 4 |
| Delivery marketplaces | Photography, prep time, menu breadth | Low, commission-heavy | 5 — volume, not margin |
| Owned email & SMS | Frequency offers, event invites, birthdays | Medium to build, cheap to run | 2 for repeat visits |
Scale matters on the review side: Yelp reports 330 million cumulative reviews and 485,000 paying advertising locations, with restaurants among its largest categories. Ignoring a platform of that size is a decision, not an oversight.
Google Business Profile: the highest-return hour in restaurant marketing
Local ranking research from Whitespark's local search ranking factors attributes about 32% of local pack influence to profile signals — more than links or on-page factors. Google's own Business Profile documentation spells out the fields that matter, and most restaurants leave half of them blank.
| Profile element | Standard most restaurants meet | What actually converts |
|---|---|---|
| Primary category | "Restaurant" | The most specific match — "Neapolitan pizza restaurant" — plus 2–4 secondary categories |
| Hours | Regular hours only | Holiday hours set 12 months ahead; kitchen-close time noted in the description |
| Photos | 6–10 images, mostly interiors | 30+ images weighted to dishes, plus 3 exterior shots for wayfinding |
| Menu | A PDF link | Structured menu items with prices, mirrored as HTML on the site |
| Attributes | Blank | Outdoor seating, accessibility, dietary options, reservations, parking |
| Ordering links | Marketplace default | Direct ordering link set as primary, marketplace as secondary |
| Q&A | Unmonitored | 8–12 owner-seeded questions covering parking, groups, allergens, wait times |
Only 35% of small businesses have a Google Business Profile at all, per BrightLocal, and only 40% of local businesses run a dedicated website — which means basic completeness still separates you from a large share of the field.
The website and ordering layer
Diners arrive on a restaurant site with three questions: are you open, what do you serve, and how do I get a table or an order. Anything that delays those answers costs covers. Google's guidance on search behaviour and intent is blunt about mobile speed being a conversion factor, not a technical nicety.
| Route | Typical cost to the restaurant | You own the data | Best used for |
|---|---|---|---|
| Direct ordering on your site | Flat monthly fee or low per-order rate | Yes | Repeat guests, loyalty, margin protection |
| Third-party delivery marketplace | Double-digit commission per order | No | New-customer discovery and off-peak volume |
| Reservation platform | Cover fee or subscription | Partly | Full-service demand shaping and no-show control |
| Phone only | Staff time during service | Yes | Large groups and catering enquiries |
| Social DM ordering | Staff time, no fees | Partly | Very small operations and pop-ups |
Rule 1 — treat marketplaces as paid acquisition with a known commission, not as your ordering system. Rule 2 — every marketplace bag should carry something that pulls the next order direct. Rule 3 — the menu must exist as crawlable HTML with prices, because that is what search engines and AI assistants can read. If your site cannot do those three things, that is a web development problem before it is a marketing one.
Social media that fills tables instead of collecting likes
Food is the rare category where the product photographs itself. The mistake is treating every platform the same. Cross-platform engagement data from Socialinsider's benchmarks shows short-form video pulling far more reach per post than static formats, while feed posts still carry the informational load.
| Platform | Job it does best | Content that works | Realistic cadence |
|---|---|---|---|
| Consideration and menu proof | Dish close-ups, Reels of prep, Stories for daily specials | 3–5 posts + daily Stories | |
| TikTok | New-audience discovery | Sound-on kitchen clips, staff personalities, "how it's made" | 3–7 clips per week |
| Local events, older demographics, groups | Event pages, live music, community partnerships | 2–3 posts per week | |
| Google Business Profile posts | Capturing existing intent | Weekly specials, seasonal menu, holiday hours | 1–2 per week |
| User-generated content | Credibility at zero production cost | Reposted guest photos, table-tent prompts, hashtag walls | Continuous, curated weekly |
| Local creators | Trial from a warm audience | Hosted tastings with disclosed partnerships | 1–2 per month |
One legal note that catches restaurants constantly: a free meal is material compensation. The FTC endorsement guides require creators to disclose it clearly, and the liability sits with the advertiser as well as the creator. Build disclosure language into the brief.
Limit 4 — no more than one in four posts should be a hard promotion. Limit 5 — never let a platform inbox go unanswered longer than a service period; social DMs are now a reservation channel.
Reviews: the compounding asset
Reviews are the closest thing restaurant marketing has to a flywheel, and the BrightLocal numbers explain why: 85% of consumers are more likely to use a business after positive reviews, 77% are less likely after negative ones, and 54% now visit the website after reading positive reviews — up from 32% in 2019.
| Review habit | Why it matters | Operational owner |
|---|---|---|
| Ask every satisfied table | 47% avoid businesses with under 20 reviews | Floor manager, end of service |
| Keep a weekly flow | 74% only value reviews from the last 3 months | Automated post-visit message |
| Reply to all reviews | 80% of consumers favour businesses that reply to every review | Owner or GM, twice weekly |
| Fix the operational cause | Repeat complaints are a kitchen problem, not a PR one | Weekly management meeting |
| Never incentivise ratings | Platform policies prohibit paid or gated reviews | Marketing lead |
| Monitor beyond Google | Apple Maps rose from 14% to 27% as a source | Monthly listings audit |
Email and SMS: where repeat visits are actually bought
Acquisition gets the attention; frequency pays the rent. A guest list is the only marketing asset that appreciates, and it costs almost nothing per send compared with paid reach. The SBA's marketing guidance makes the same point for small businesses generally: owned channels carry the lowest marginal cost per sale.
| Program | Trigger | Offer shape (no blanket discounts) | Goal metric |
|---|---|---|---|
| Welcome series | List signup | Chef's story, best-sellers, a free side on first visit | First visit within 14 days |
| Slow-daypart push | Tuesday/Wednesday inventory | Limited-time menu, not a percentage off | Covers on the two slowest days |
| Winback | No visit in 60–90 days | "What you missed" new-menu announcement | Reactivation rate |
| Birthday and anniversary | Date field on signup | Dessert or glass on the house, party of 2+ | Average party size and ticket |
| Loyalty tier | Visit count threshold | Early access to bookings and new dishes | Visits per guest per quarter |
| SMS for time-critical only | Same-day capacity gap | "12 tables left tonight" with a booking link | Same-day fill rate |
Step 6 — collect the list at every physical touchpoint: receipt, Wi-Fi login, table tent QR, online order checkout. Step 7 — separate email from SMS consent, and keep SMS to fewer than four sends a month. Getting the measurement behind this right is what our data intelligence work exists for.
Paid ads: the cheapest search inventory in local marketing
Restaurants sit at the low-cost end of every paid search benchmark. LocaliQ's 2026 search advertising benchmarks, drawn from thousands of accounts across Google and Microsoft Ads, put the category well under the cross-industry average on both cost metrics.
| Metric | Restaurants & Food | All industries | Read |
|---|---|---|---|
| Average CPC | $2.05 | $5.42 | Clicks cost roughly 62% less than the cross-industry average |
| Average CTR | 6.83% | 6.64% | Slightly above average — intent is high, copy matters less |
| Average conversion rate | 8.05% | 8.18% | In line; landing experience is the swing factor |
| Average cost per lead | $30.57 | $66.69 | Under half the average cost to generate an enquiry |
Those numbers make small, tightly geo-fenced campaigns viable for independents, not just chains. Three campaign types earn their place: brand defence (people searching your name plus "menu" or "reservation"), category capture ("thai food near me", "brunch downtown"), and catering or private-events lead generation, which carries a far higher ticket than a single cover. Paid social works best as a reach layer for events and openings rather than a direct-response channel — which is how we structure it inside growth marketing engagements.
Restaurant marketing on a limited budget
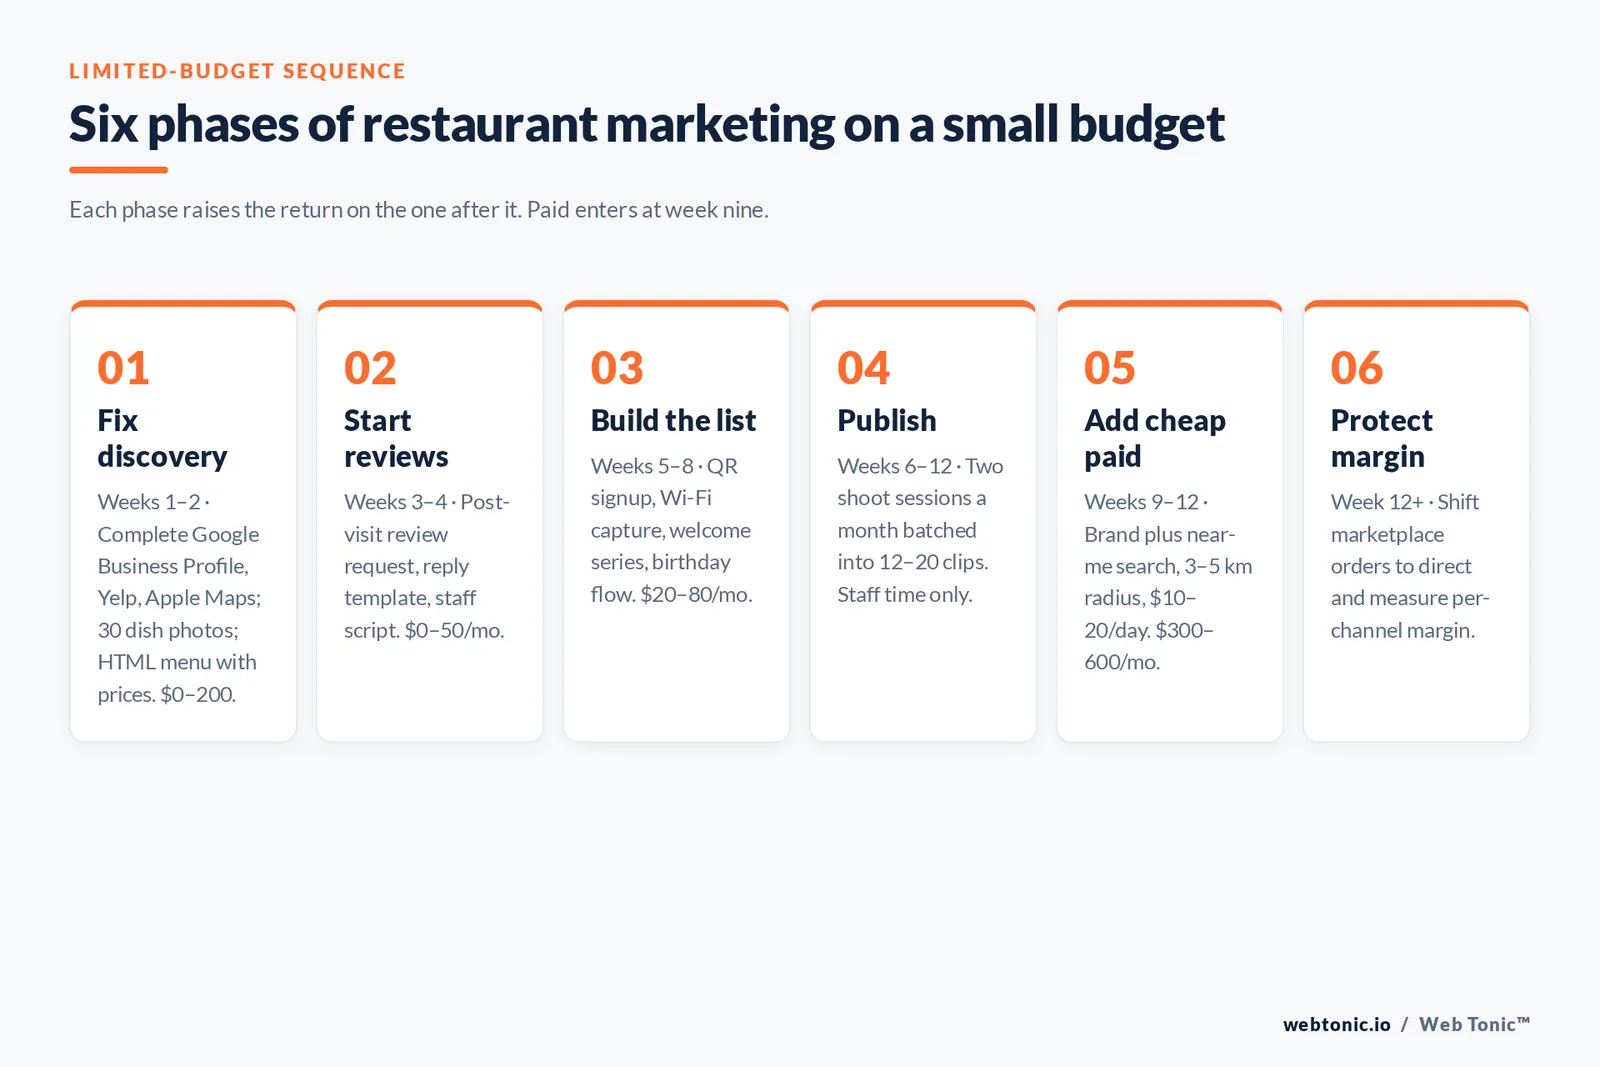
Assume no agency, no photographer and a few hours a week. The order below is deliberate: each step raises the return on the one after it.
| Phase | Weeks | Actions | Cash cost |
|---|---|---|---|
| Phase 1 — fix discovery | 1–2 | Complete Google Business Profile, Yelp, Apple Maps; 30 dish photos; HTML menu with prices | $0–200 |
| Phase 2 — start the review flow | 3–4 | Post-visit review request, reply template, staff script | $0–50/mo |
| Phase 3 — build the list | 5–8 | QR signup, Wi-Fi capture, welcome series, birthday flow | $20–80/mo |
| Phase 4 — publish consistently | 6–12 | Two shoot sessions per month batched into 12–20 clips | Staff time |
| Phase 5 — add cheap paid | 9–12 | Brand + "near me" search at a 3–5 km radius, $10–20/day | $300–600/mo |
| Phase 6 — protect margin | 12+ | Shift marketplace orders to direct, measure per-channel margin | Net positive |
At a $30.57 cost per lead, a $450 monthly search budget should produce roughly 14 tracked enquiries — enough to judge the channel within one month rather than one quarter.
What changes by restaurant type
The same channel list gets weighted very differently depending on the format. Independent operators and multi-site groups are effectively running two different businesses.
| Format | Primary marketing job | Highest-leverage channel | Metric that matters most |
|---|---|---|---|
| Quick service | Frequency and speed | App/loyalty plus maps visibility | Visits per guest per month |
| Fast casual | Weekday lunch occupancy | Local search plus workplace catering | Lunch daypart covers |
| Casual dining | Occasion capture | Reviews plus social video | Reservation volume and party size |
| Fine dining | Reputation and scarcity | Press, guides, creator hosting | Booking lead time |
| Multi-site group | Consistency at scale | Listings management plus centralised CRM | Like-for-like traffic by site |
| Delivery-only / ghost kitchen | Marketplace ranking | Photography, prep time, menu breadth | Contribution margin per order |
| Cafés and bakeries | Morning habit formation | Loyalty punch card plus Instagram Stories | Weekday morning transactions |
Multi-site marketing without discounting
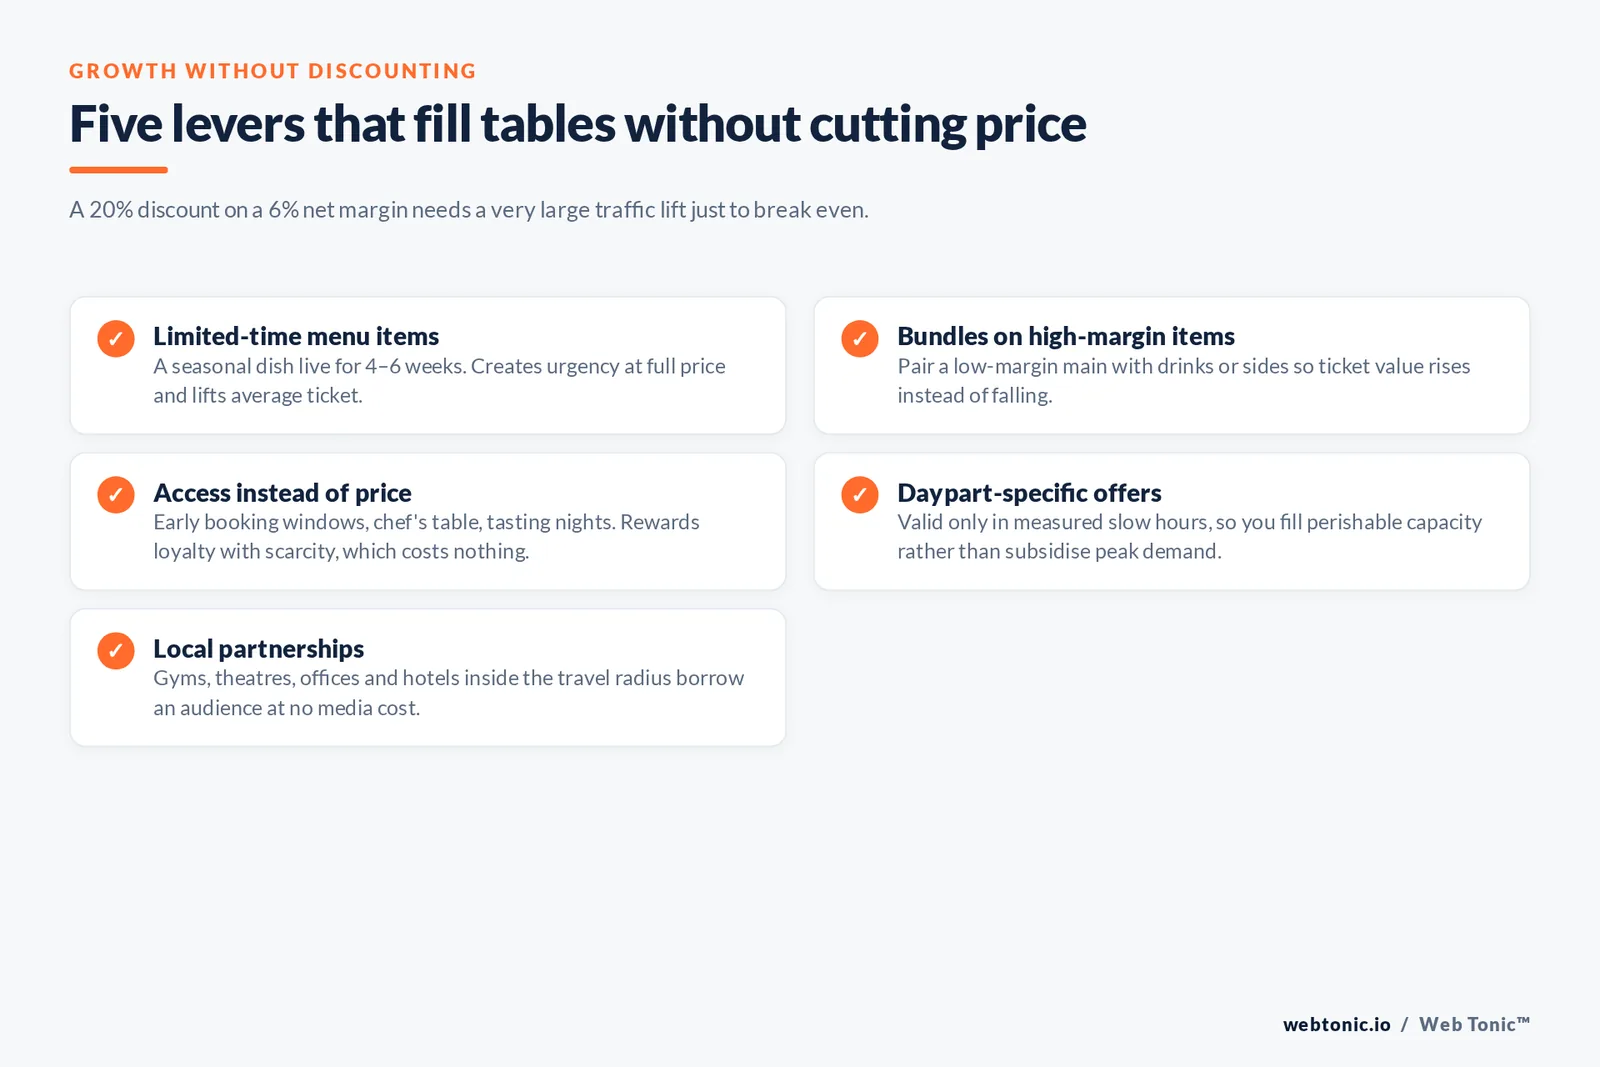
Groups reach for percentage-off promotions because they scale easily. The problem is that a 20% discount on a 6% net margin requires a very large traffic lift just to break even. Four alternatives move covers without touching base price.
| Lever | How it works | Why it protects margin |
|---|---|---|
| Limited-time menu items | A seasonal dish available for 4–6 weeks | Creates urgency at full price and lifts average ticket |
| Bundles built on high-margin items | Pair a low-margin main with drinks or sides | Raises ticket value rather than cutting it |
| Access instead of price | Early booking windows, chef's table, tasting nights | Rewards loyalty with scarcity, which costs nothing |
| Daypart-specific offers | Promotions valid only in measured slow hours | Fills perishable capacity instead of subsidising peak demand |
| Local partnerships | Gyms, theatres, offices, hotels within the radius | Borrows an audience at no media cost |
Site-level consistency is the other half of the job: one owner per location profile, one photo standard, one review-response tone, and hours accuracy audited monthly. National-scale food service sales data and industry trade coverage are useful for setting expectations, but like-for-like traffic per site is the only number that tells you whether marketing worked.
How to measure restaurant marketing
Most restaurants measure reach when they should be measuring covers and repeat rate. A workable scorecard fits on one page.
| Metric | Definition | Review cadence | Healthy direction |
|---|---|---|---|
| Covers by daypart | Guests served per service period | Weekly | Slow dayparts closing the gap on peak |
| Repeat visit rate | Share of guests with 2+ visits in 90 days | Monthly | Rising |
| Direct vs marketplace mix | Orders by channel, net of commission | Monthly | Direct share rising |
| Profile actions | Calls, direction requests, website clicks from maps | Monthly | Rising with review count |
| Review velocity and rating | New reviews per month, rolling average rating | Monthly | 8+ new reviews per month, rating stable |
| List growth | Net new email and SMS subscribers | Monthly | Growing faster than churn |
| Cost per tracked enquiry | Paid spend divided by calls, bookings, orders | Monthly | At or below the $30.57 category benchmark |
If you want a second opinion on which of these is actually broken in your operation, get in touch — the diagnosis usually takes an afternoon, not a retainer.
FAQ
What is the most effective restaurant marketing strategy?
For almost every independent restaurant it is the combination of a complete Google Business Profile and a continuous review flow, because profile signals carry around 32% of local pack influence and 97% of consumers read reviews before choosing. Both are close to free, and they raise the return on every other channel you add afterwards.
How much should a restaurant spend on marketing?
Independents typically budget 3–6% of revenue, weighted toward owned channels rather than paid media. Because restaurant search advertising averages $2.05 per click and $30.57 per lead, a $300–600 monthly paid budget is enough to test search properly in a single trading area.
Which social media platform works best for restaurants?
Instagram and TikTok do different jobs: TikTok is the discovery engine for new audiences with sound-on kitchen and dish footage, while Instagram carries menu proof and daily specials for people already considering a visit. Facebook still outperforms both for local events and community groups.
How do restaurants market themselves on a limited budget?
Work in the order of listings, reviews, list building, content, then paid. Phase one costs under $200 and fixes discovery; paid media only enters at week nine, once the profile, reviews and booking path can convert the traffic it buys.
Do third-party delivery apps help or hurt restaurant marketing?
They help discovery and hurt margin. Treat marketplaces as a paid acquisition channel with a known double-digit commission, then use packaging inserts, loyalty offers and a direct ordering link on your profile to convert those customers into direct orders on the second purchase.
Does restaurant marketing affect how AI assistants recommend you?
Yes. Generative AI tools rose from 6% to 45% as a local recommendation source in 2026, and they draw on the same inputs as search: consistent name, address and hours data, a crawlable menu with prices, and a large, recent review corpus.
Sources: National Restaurant Association, 2026 State of the Restaurant Industry · BrightLocal, Local Consumer Review Survey 2026 · LocaliQ / WordStream, 2026 Search Advertising Benchmarks · Whitespark, Local Search Ranking Factors · Google Business Profile Help · Yelp Fast Facts (Q1 2026) · Socialinsider Social Media Benchmarks · FTC Endorsement Guides · US Small Business Administration · US Census Bureau, Retail and Food Services Sales · Statista, US Restaurants. All figures verified 2 August 2026.