



Table of contents
74.9% of new behavioral healthcare leads come through phone calls, yet most treatment centers cannot attribute those calls to a specific campaign or channel. This gap between lead volume and lead intelligence defines the analytics challenge in addiction treatment marketing.
Key Takeaways
- 74.9% of behavioral health leads arrive by phone, making call attribution the single most important tracking capability (Liine, 2024).
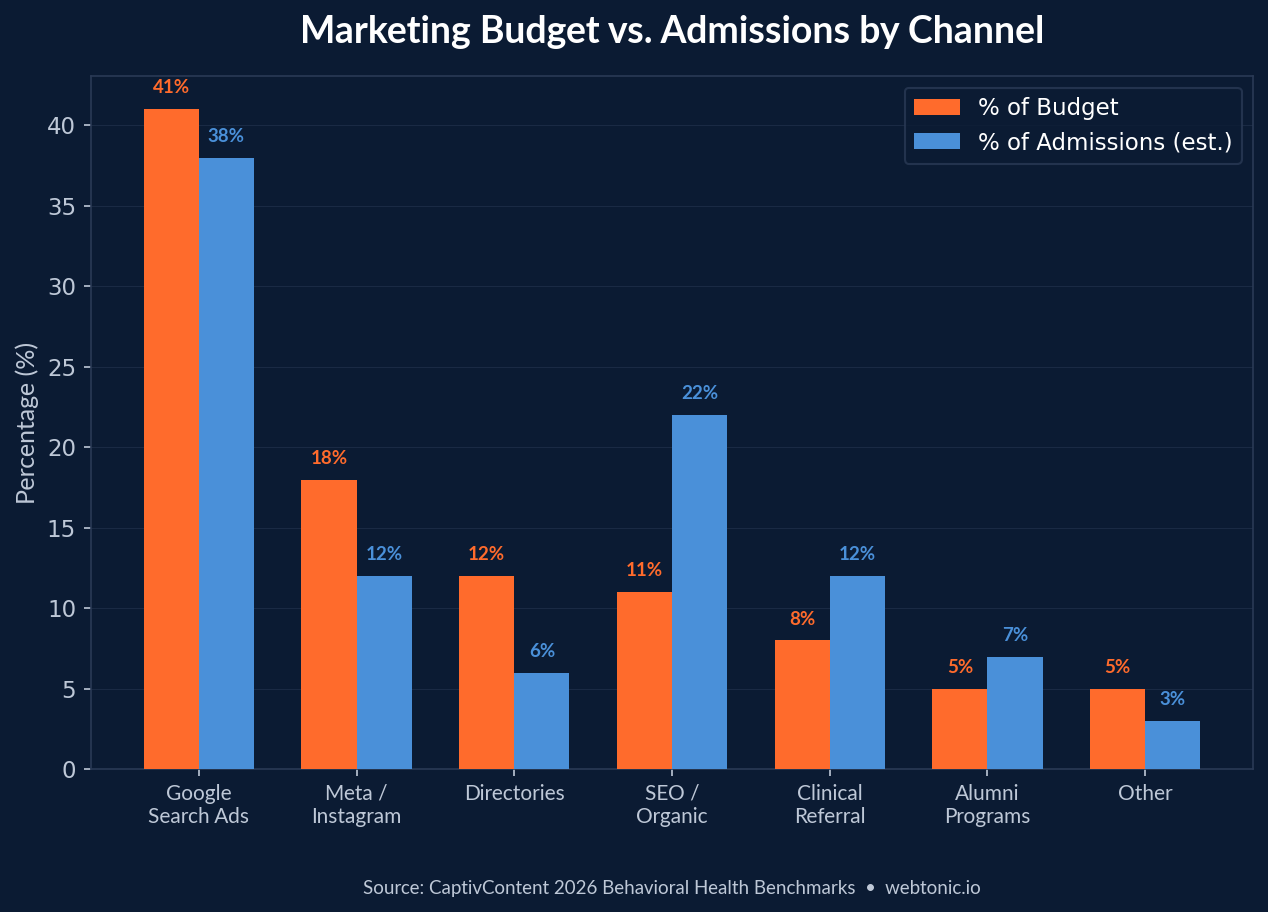
- 71% of marketing budget goes to channels producing only 38% of admissions — a gap that a Google Ads agency would flag immediately when attribution is absent (CaptivContent, 2026).
- 73% of US healthcare websites run non-HIPAA-compliant trackers, risking $100M+ in cumulative industry settlements (Piwik PRO, 2026).
- Treatment centers with proper call attribution see 20–40% cost-per-admit reduction within the first quarter (Webserv, 2026).
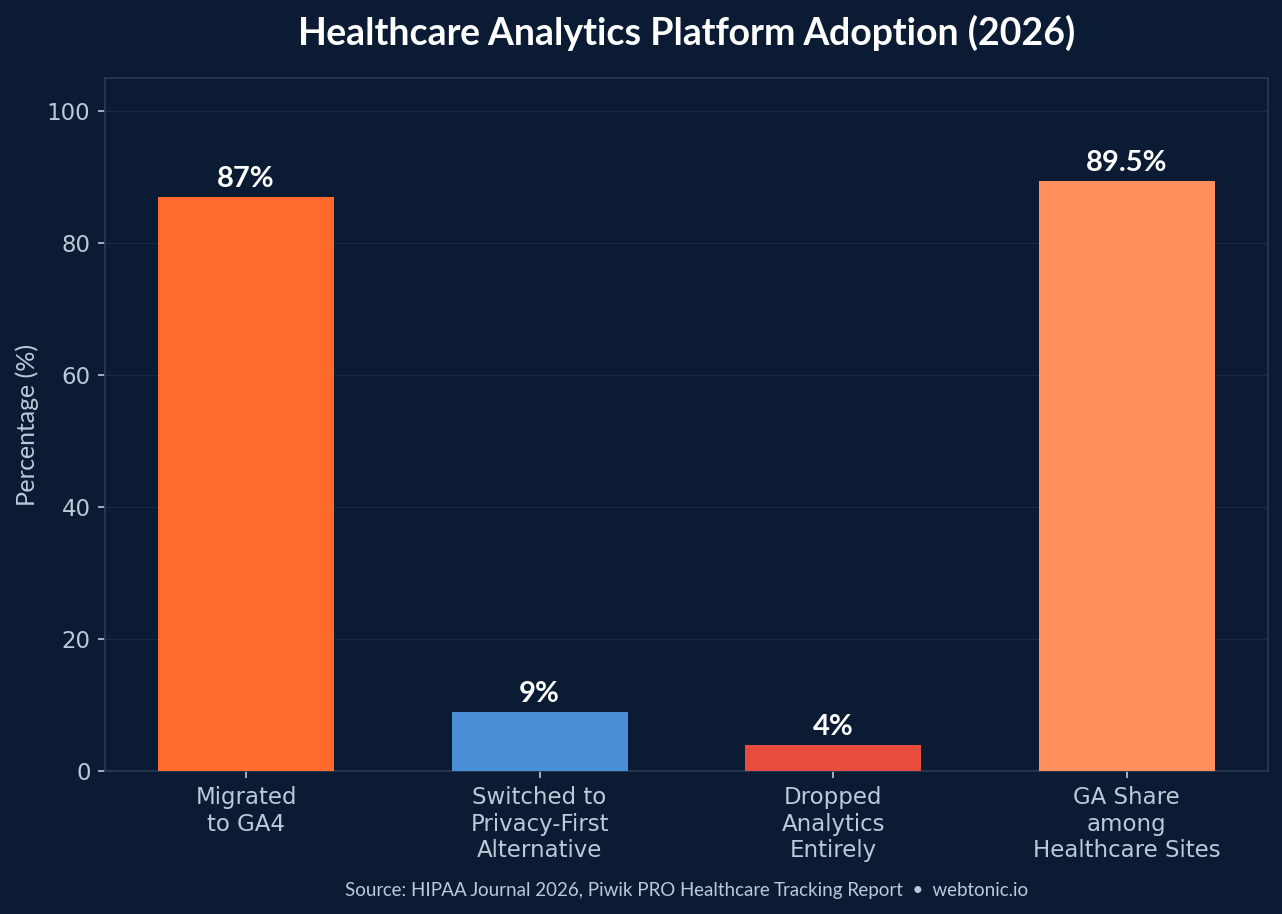
- 87% of former Universal Analytics users completed GA4 migration, but 4% dropped analytics entirely (HIPAA Journal, 2026).
- Lead-to-VOB conversion rate and closing rate are the two metrics that diagnose a broken admissions funnel (Webserv, 2026).
Rehab Tracking & Analytics Benchmarks at a Glance
| Metric | Benchmark | Source |
|---|---|---|
| Phone leads (% of total) | 74.9% | Liine BH Report 2024 |
| Budget-to-admission mismatch | 71% spend → 38% admits | CaptivContent 2026 |
| Non-compliant tracker rate (US hospitals) | 73% | Piwik PRO 2026 |
| Cost-per-admit reduction with attribution | 20–40% in Q1 | Webserv 2026 |
| GA4 migration completion | 87% of UA users | HIPAA Journal 2026 |
| GA4 active properties (Q1 2026) | 14.7M | HIPAA Journal 2026 |
| Switched to non-Google analytics | 9% of UA users | HIPAA Journal 2026 |
| Dropped analytics entirely | 4% of UA users | HIPAA Journal 2026 |
| Google Ads CPC (addiction treatment) | $94.50 | CuFinder 2026 |
| Google Ads CVR | 4.10% | CuFinder 2026 |
| Google Ads CPL | $285 | CuFinder 2026 |
| Avg. cost per admission | $3,500–$5,000 | CuFinder 2026 |
Call Attribution and Phone Tracking Statistics
Phone calls remain the dominant conversion channel in addiction treatment marketing. Unlike e-commerce or SaaS, where form fills drive most leads, the urgency and sensitivity of substance use disorder (SUD) queries push prospects toward immediate voice contact.
- 74.9% of new behavioral healthcare leads come through phone calls rather than web forms, chat, or email (Liine Behavioral Health Benchmark Report, 2024).
- 60–75% of all admission inquiries arrive by phone, making call tracking the single most revenue-critical measurement layer (Webserv, 2026).
- Phone-primary landing pages convert at 2–3× the rate of form-primary pages on Meta paid social traffic for treatment centers (Webserv, 2026).
- Missed calls at $200–$400 cost per click represent pure waste when no automated follow-up captures the lead (Webserv, 2026).
- Accounts with proper CallRail-to-GA4 integration see a 20–40% reduction in cost per admit within the first 12 weeks (Webserv, 2026).
- Call tagging — the layer most treatment centers skip — reveals which campaigns produce admits, not just which campaigns produce rings (Webserv, 2026).
HIPAA-Compliant Analytics Statistics
The regulatory landscape for healthcare website tracking has tightened significantly since December 2022, when federal guidance explicitly classified commonly used marketing trackers as non-compliant for healthcare contexts.
- 73% of 59 major US hospital and clinic websites run advertising or marketing trackers that would be difficult to defend under current HIPAA guidance (Piwik PRO, 2026).
- Over $100 million in cumulative settlements have been disclosed for tracking-related HIPAA violations through 2026 (MatchNode, 2026).
- Any combination of a user identifier and a clinical signal is considered PHI, regardless of whether HIPAA technically applies to the entity (MatchNode, 2026).
- 89.5% of healthcare providers with detectable analytics use Google Analytics (3,735 of 4,173 sites), with alternatives at 12.2% and 5.9% (HIPAA Journal, 2026).
- LegitScript certification and HIPAA-compliant site infrastructure are increasingly tied to both ad eligibility and organic trust signals (Authority Specialist, 2026).
- 9% of former Universal Analytics users switched to a privacy-first alternative like Piwik PRO, Matomo, or Plausible after the GA4 migration (HIPAA Journal, 2026).
Marketing Attribution and ROI Measurement
Attribution — connecting a marketing dollar to an admission — is the measurement problem that separates data-driven treatment centers from those flying blind. The challenge is amplified by multi-touch patient journeys and strict data privacy requirements.
| Attribution Metric | Benchmark | Context |
|---|---|---|
| Budget-to-admission mismatch | 71% spend → 38% admits | Without channel-level attribution |
| Google Search Ads share of budget | 41% | Largest single channel |
| Meta / Instagram share of budget | 18% | Second-largest paid channel |
| Directory listings share of budget | 12% | Declining efficacy |
| SEO / organic content share | 11% | Highest LTV channel |
| Clinical referral programs | 8% | High conversion, low volume |
| Alumni programs | 5% | 28% engagement rate |
| LTA rate (private-pay / commercial) | 5–12% | SEO leads convert highest |
- 71% of behavioral health marketing budgets fund channels producing only 38% of admissions — a structural mismatch that proper attribution immediately exposes (CaptivContent, 2026).
- Google Search Ads absorb 41% of the average behavioral health marketing budget, followed by Meta/Instagram at 18% and directories at 12% (CaptivContent, 2026).
- The lead-to-VOB conversion rate and the closing rate (viable-to-admit) are the two rates that diagnose a broken funnel — tracking vanity metrics like impressions or CTR misses the point entirely (Webserv, 2026).
- In a linear attribution model, every touchpoint gets equal credit — if a prospect found you through SEO, clicked a retargeting ad, then opened a newsletter, each channel receives 33.3% credit (CTM, 2026).
- Source-attributed close rate by campaign and admits by paid channel are the numbers that let marketing spend get calibrated against actual admissions through growth marketing (Netvisits, 2026).
CRM and Admissions Data Statistics
The admissions CRM is the connective tissue between marketing spend and patient intake. When configured correctly, it transforms scattered call logs and form submissions into actionable funnel data.
- The KPI spine for treatment center CRMs tracks four core metrics: leads, VOB completions, viable leads, and admits — plus two rates (lead-to-VOB and viable-to-admit) (Webserv, 2026).
- Coordinator call score averages on a rolling four-week window per rep are the leading indicator of intake team performance (Webserv, 2026).
- Most treatment center CRMs are missing fields for source attribution, call disposition, and VOB status, making funnel diagnostics impossible (Webserv, 2026).
- Admissions teams should review CRM data weekly — monthly reviews miss seasonal spikes (January, post-holiday) that require real-time budget adjustments (Webserv, 2026).
- The reconciliation test — matching CRM admits to billing admits — reveals data hygiene gaps that inflate or deflate reported marketing ROI (Webserv, 2026).
- Average customer lifetime value for addiction treatment patients ranges from $18,000 to $35,000, depending on the level of care and insurance coverage (CuFinder, 2026).
Patient Journey and Treatment Outcome Tracking
Beyond marketing attribution, clinical outcome tracking provides the data foundation for quality improvement and accreditation — and increasingly influences search visibility through E-E-A-T signals.
- 46.3 million Americans are affected by substance use disorder, but only 10–12% receive formal treatment in a given year (NIDA, 2026).
- 43% average reduction in depression symptoms within the first four weeks of treatment among 325 individuals who completed both intake and follow-up assessments at St. Joseph Institute (NAATP FoRSE, 2026).
- Reported drug use dropped from 15.7% at intake to 94.3% abstinence at follow-up across NAATP FoRSE program participants (NAATP, 2026).
- Alumni engagement rate stands at 28%, with a 14% referral rate from alumni back into the treatment pipeline (CuFinder, 2026).
- 78% of patients with service contracts in ongoing care remain engaged beyond the initial treatment episode (CuFinder, 2026).
- FoRSE benchmarking data now covers review rates and symptom improvement across N = 34,128 complete residential cases, with review rate positively correlated to GRSx improvement (coefficient = 3.36) (NAATP, 2026).
Analytics Technology Adoption in Healthcare
| Platform / Trend | Adoption Rate | Source |
|---|---|---|
| GA4 migration (from UA) | 87% | HIPAA Journal 2026 |
| Switched to non-Google tool | 9% | HIPAA Journal 2026 |
| Dropped analytics entirely | 4% | HIPAA Journal 2026 |
| GA4 active properties (Q1 2026) | 14.7M | HIPAA Journal 2026 |
| GA share among healthcare sites | 89.5% | HIPAA Journal 2026 |
| Non-compliant tracker presence | 73% | Piwik PRO 2026 |
| Mobile traffic share (addiction) | 72.4% | CuFinder 2026 |
| Organic search traffic share | 48.2% | CuFinder 2026 |
Best Practices for Rehab Analytics Setup
- Deploy HIPAA-compliant call tracking (CallRail, CallTrackingMetrics) with GA4 integration as the first measurement priority — phone calls represent 60–75% of admission inquiries.
- Build the KPI spine: leads → VOB → viable → admit, with conversion rates between each stage, segmented by channel and campaign.
- Run the reconciliation test monthly — match CRM-reported admits to billing-system admits to catch data gaps that distort ROI calculations.
- Replace standard Google Analytics with a HIPAA-compliant configuration (server-side tagging, IP anonymization, no advertising features) or a privacy-first alternative.
- Tag every inbound call by disposition (inquiry, insurance question, family member, clinical referral, spam) so admissions directors see campaign quality, not just volume.
- Track response time to initial inquiry — below 10 minutes for phone callbacks and under 5 minutes for form follow-ups correlates with significantly higher conversion rates.
- Use multi-touch attribution (linear or position-based) rather than last-click to accurately credit awareness-stage channels like SEO and social media.
- Implement event-based tracking in GA4 for micro-conversions: insurance verification widget interactions, click-to-call taps, video testimonial views, and FAQ accordion opens.
Rehab Analytics vs. Other Healthcare Verticals
| Metric | Addiction Treatment | General Healthcare | Dental |
|---|---|---|---|
| Google Ads CPC | $94.50 | $6.40 | $7.85 |
| Google Ads CVR | 4.10% | 3.36% | 5.2% |
| Cost per lead | $285 | $120–$200 | $45–$85 |
| Cost per acquisition | $3,500–$5,000 | $155–$2,500 | $150–$350 |
| Phone lead share | 74.9% | ~60% | ~55% |
| Mobile traffic | 72.4% | ~65% | ~68% |
| Bounce rate | 64.5% | ~55% | ~50% |
Frequently Asked Questions
What is the most important analytics metric for addiction treatment centers?
The lead-to-admit conversion rate segmented by channel is the most actionable metric. It connects marketing spend directly to admissions outcomes rather than tracking vanity metrics like impressions or clicks. Treatment centers that track this metric can identify which channels produce actual admits — not just inquiries — and reallocate budget accordingly. Phone call attribution is the prerequisite, since 74.9% of behavioral health leads arrive by phone.
How can treatment centers track marketing ROI while staying HIPAA-compliant?
Use a HIPAA-compliant call tracking platform (CallRail or CallTrackingMetrics with BAA signed), configure GA4 with server-side tagging and advertising features disabled, and implement a CRM that tracks the full funnel from lead to VOB to admission. Avoid sending any combination of user identifiers and clinical signals to third-party advertising platforms. 73% of healthcare websites currently run non-compliant trackers, so compliance itself becomes a competitive advantage.
What percentage of behavioral health marketing budget is typically wasted?
Without proper attribution, 71% of the marketing budget funds channels producing only 38% of admissions. This structural mismatch means roughly a third of marketing spend is effectively wasted on underperforming channels. Treatment centers that implement source-level call tracking and CRM integration typically see a 20–40% reduction in cost per admit within the first quarter.
How long does it take to see ROI from implementing proper analytics?
Treatment centers that deploy call attribution, CRM integration, and channel-level tracking typically see measurable cost-per-admit improvements within 12 weeks. The improvement compounds because each additional week of data sharpens bid optimization, channel allocation, and intake team coaching. By day 90, most centers have enough data to make confident budget reallocation decisions.
Should addiction treatment centers use Google Analytics 4 or a privacy-first alternative?
It depends on the compliance posture. 87% of former UA users migrated to GA4, but GA4 requires careful HIPAA configuration (no advertising features, IP anonymization, server-side tagging). Centers handling PHI on their websites should consider a privacy-first alternative — 9% of former UA users have already switched to platforms like Piwik PRO that offer HIPAA-compliant configurations with signed BAAs out of the box.
Sources
cufinder.io/blog/benchmarks/addiction-treatment
webserv.io — Admissions CRM Metrics
webserv.io — CallRail Setup for Treatment Centers
piwik.pro — Healthcare Website Tracking Report 2026
matchnode.com — HIPAA-Compliant Attribution
ctm.com — Mental Health Call Attribution Strategy
naatp.org — FoRSE Outcomes Benchmarking
nida.nih.gov — Trends & Statistics
hipaajournal.com — Healthcare Analytics Tools Study 2026
foundrycro.com — Healthcare Marketing Benchmarks 2026


