



Table of contents
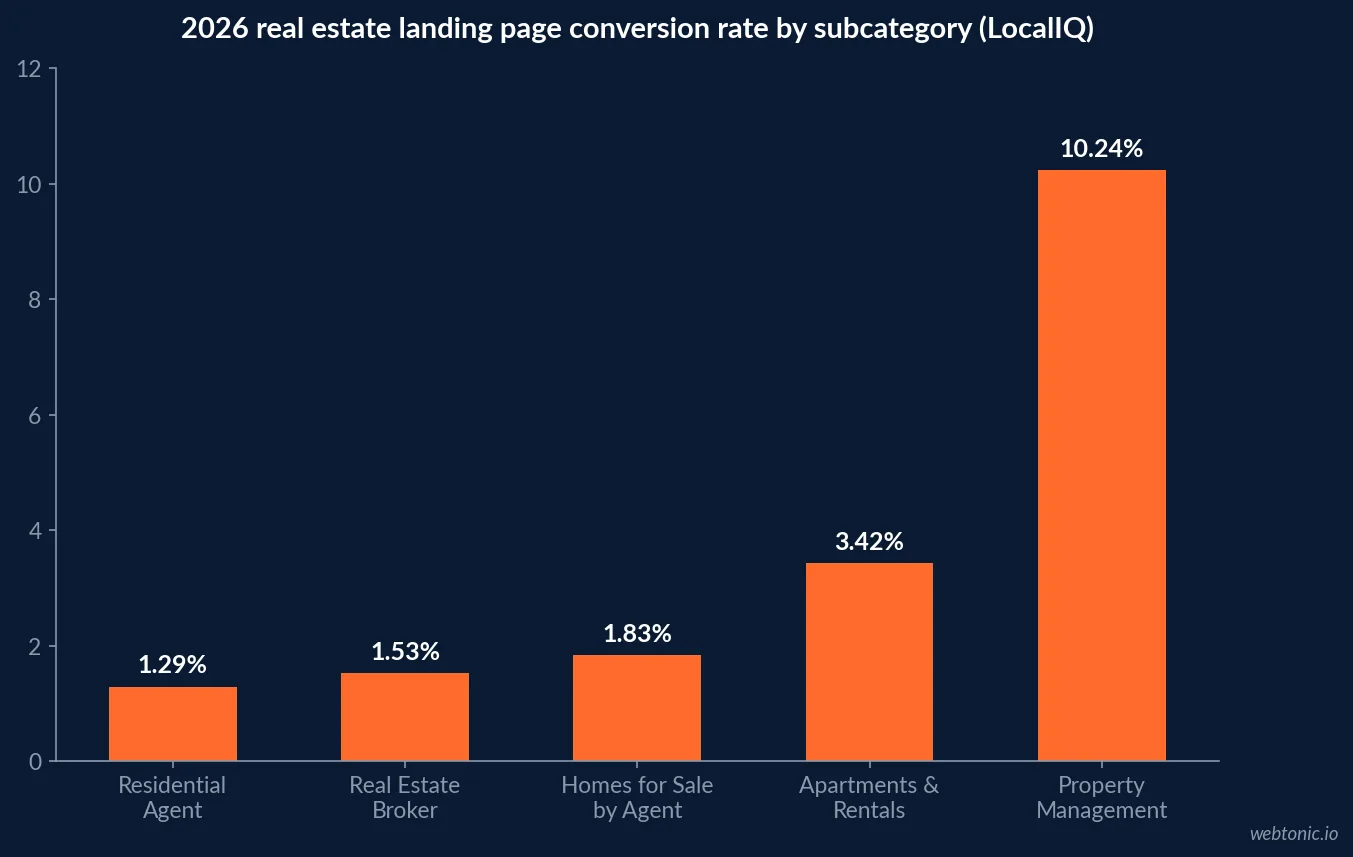
A CRO analyst reading "real estate converts at 3.70%" is reading an average that hides a 9x spread. Property Management pages convert at 10.24% in 2026 benchmark data; Residential Real Estate Agent pages convert at 1.29%. The unit of analysis has to be the subcategory the page is actually selling, not "real estate" as a single vertical.
Key Takeaways
- The overall 2026 real estate search ads conversion rate is 3.70%.
- That masks a spread from 1.29% to 10.24% across subcategories.
- Property Management pages convert at 10.24%, the highest of the five tracked.
- Residential Real Estate Agent pages convert at just 1.29%, the lowest.
- Homes for Sale by Agent sits at 1.83% and Real Estate Broker at 1.53%.
- Apartments and Rentals converts at 3.42%, close to the overall average.
- Real estate CVR rose 12.8% year over year even as click-through rate fell.
- Click-through rate fell 9.73% across the same period.
- The average real estate cost per click is $3.22, up 27.27% YoY.
- Property Management costs $3.94 per click, the highest subcategory.
- Homes for Sale by Agent costs $3.90 per click, up 78.9% YoY.
- Longer real estate lead-capture pages convert 33% lower than short ones.
- A 6th-grade reading level nearly doubles predicted conversion versus university-level copy.
- 41.6% of real estate marketers have at least one page converting below 1.3%.
- High-intent keyword clicks can convert at 8-12%, well above the category average.
- The median landing page conversion rate across all industries is 6.6%.
Why "real estate converts at 3.70%" is the wrong headline
LocalIQ's 2026 real estate search advertising benchmarks, drawn from nearly 900 real estate search campaigns running April 2025 through March 2026, report an overall conversion rate of 3.70%. That single number is the one most teams anchor a target to, and it is close to useless for a CRO analyst - it blends a category converting above 10% with categories converting below 2%.
A CRO analyst's first job on any real estate landing page brief is identifying which of the five subcategories the page actually belongs to before setting a conversion target.
| Real estate subcategory | 2026 conversion rate | YoY change | CRO read |
|---|---|---|---|
| Property Management | 10.24% | +16.22% pts of category range | High-intent, recurring-revenue searchers |
| Apartments & Rentals | 3.42% | Largest CVR jump YoY | Broad, high-volume, moderate intent |
| Homes for Sale by Agent | 1.83% | Increased | High consideration, long buying cycle |
| Real Estate Broker | 1.53% | Increased | Brand and trust-dependent |
| Residential Real Estate Agent | 1.29% | Only category to decline, -1.23% | Most competitive, most generic search intent |
The cost side moves independently of the conversion side
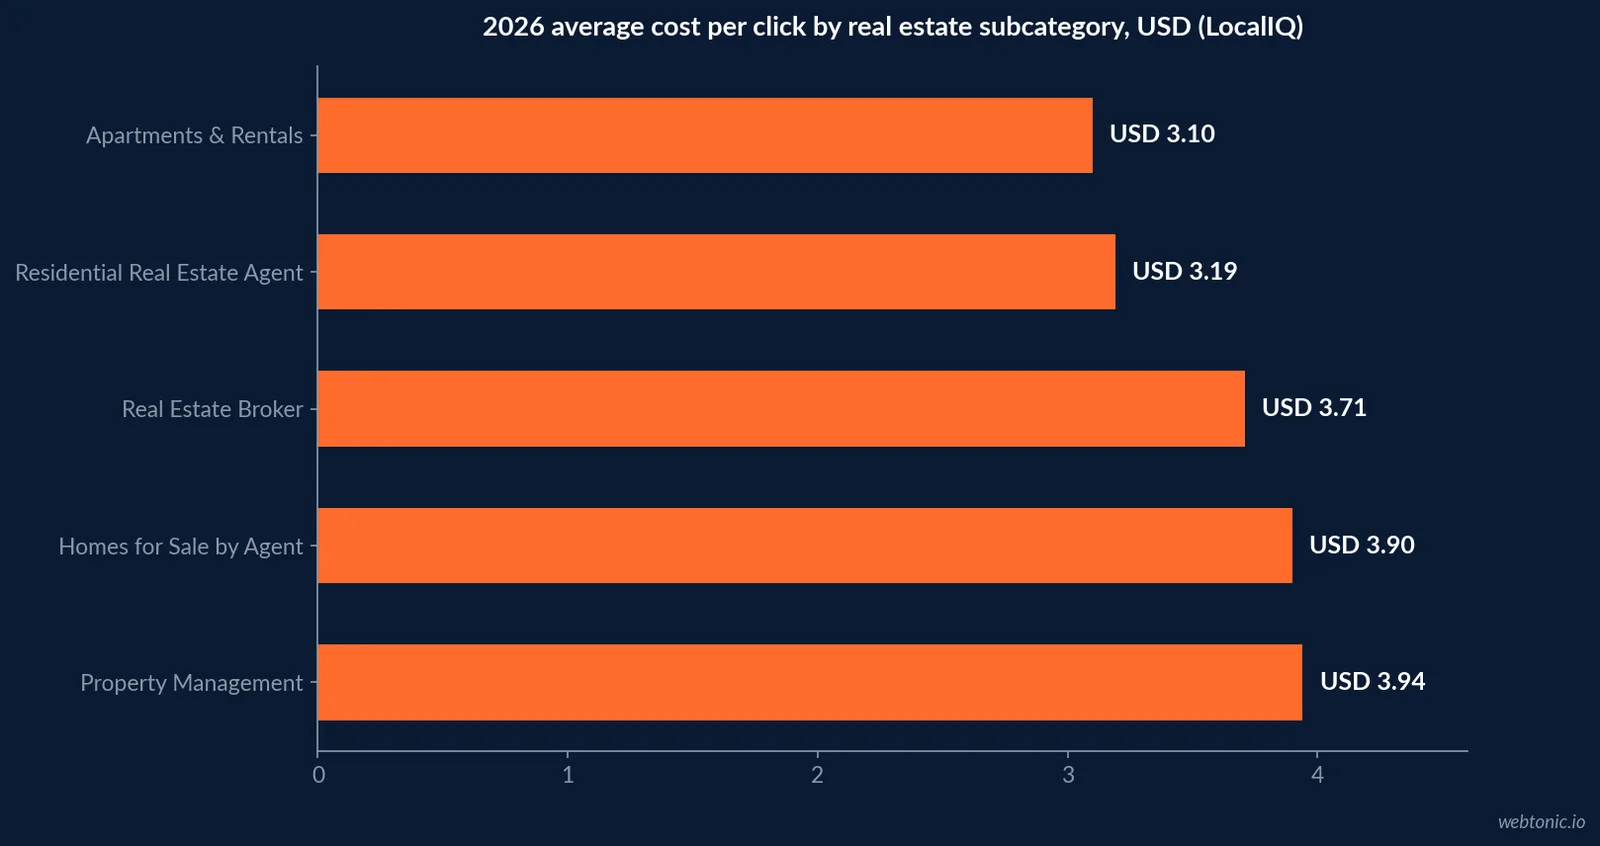
The subcategory that converts best is not the cheapest to acquire a click for, which is the second thing a CRO brief needs to state plainly. Property Management has both the highest conversion rate and the highest cost per click in LocalIQ's dataset, at $3.94. Homes for Sale by Agent saw the sharpest cost increase of any subcategory, up 78.9% year over year to $3.90 per click, while converting at under 2%. That combination - rising cost, low conversion - is exactly the pattern a CRO analyst should flag first in a quarterly review.
| Subcategory | Avg. cost per click (2026) | Avg. CVR (2026) | Cost per click, YoY |
|---|---|---|---|
| Property Management | $3.94 | 10.24% | Decreased 18.09% |
| Homes for Sale by Agent | $3.90 | 1.83% | Increased 78.9% |
| Real Estate Broker | $3.71 | 1.53% | Increased |
| Residential Real Estate Agent | $3.19 | 1.29% | Near flat |
| Apartments & Rentals | $3.10 | 3.42% | Lowest of the five |
What actually moves the number on the page itself
Cost and category explain the traffic; page design explains the rest. The Unbounce Conversion Benchmark Report and its earlier real estate landing page deep-dive found two levers specific to this vertical: page length and reading level. Real estate lead-capture pages that ran long converted 33% lower than short ones, and a page written at a 6th-grade reading level had a predicted conversion rate nearly double one written at a university level. Neither finding is unique to real estate in principle, but the size of the effect in this vertical is larger than in most others Unbounce measured.
The distribution of outcomes also matters for prioritization: 41.6% of real estate marketers have at least one page converting below 1.3%, which the report places in the bottom quartile for the industry. A CRO backlog built from this data should assume roughly two in five pages in a portfolio have a fixable problem, not that traffic quality is uniformly to blame.
| Page design factor | Effect on conversion rate | Source |
|---|---|---|
| Long page length (lead-capture) | 33% lower conversion | Unbounce Conversion Benchmark Report |
| 6th-grade reading level vs. university level | Nearly 2x predicted conversion | Unbounce |
| Bottom-quartile pages (below 1.3% CVR) | 41.6% of marketers have at least one | Unbounce |
| High-intent keyword traffic (e.g. "sell my house fast") | 8-12% conversion, vs. 3.70% average | LocalIQ 2026 |
The search-duration gap explains the subcategory spread
Zillow's Consumer Housing Trends Report data on how long buyers actually search adds the missing context for why Property Management converts at 10.24% while Homes for Sale by Agent sits at 1.83%. Only 11% of buyers finish their search in under a month, and 22% take six months or more. A rental search, by contrast, is typically resolved in weeks - a lease has to be signed against a move-in date - which compresses the funnel and pushes more of the traffic that lands on a rental landing page toward an immediate conversion. A purchase landing page competes against a multi-month research process that a single visit is unlikely to end.
For a CRO analyst, this means a low CVR on a Homes for Sale by Agent page is not automatically a page defect - it may be an accurate reflection of a visitor who is three months into a six-month search and not ready to submit a form on this visit, however well designed the page is. The design fixes above (page length, reading level) still apply, but the ceiling on achievable conversion rate differs by subcategory for reasons the page itself cannot fully solve.
| Home search duration | Share of buyers | Implication for the landing page |
|---|---|---|
| Less than 1 month | 11% | High-intent, ready-to-convert visit |
| 1 to less than 2 months | 18% | Still comparing, needs a lower-commitment CTA |
| 2 to less than 3 months | 19% | Mid-funnel, save/favorite features matter |
| 3 to less than 4 months | 15% | Nurture sequence more valuable than a form |
| 4 to less than 6 months | 15% | Repeat visits likely, retargeting fits |
| 6 months or more | 22% | Long researcher; content and email capture over hard CTA |
What a subcategory-aware test plan looks like
Putting the cost, conversion and search-duration data together, a defensible A/B test roadmap treats the five subcategories as five different products rather than one page template. A rental landing page should be tested against a hard, single-step lead form given its short search window and already-strong 10.24% baseline. A Homes for Sale by Agent or Broker page, sitting against a search that runs months, should be tested against a lower-commitment offer - a saved-search signup or a market report download - before a full contact form, since the visitor's actual position in a multi-month journey makes an immediate hard ask a mismatch the page cannot fix through copy alone.
| Test priority | Subcategory | Baseline CVR | Recommended primary CTA |
|---|---|---|---|
| 1 | Property Management | 10.24% | Hard lead form, single step |
| 2 | Apartments & Rentals | 3.42% | Hard lead form, single step |
| 3 | Homes for Sale by Agent | 1.83% | Saved-search signup, then form |
| 4 | Real Estate Broker | 1.53% | Market report download, then form |
| 5 | Residential Real Estate Agent | 1.29% | Content offer before any form |
Reading the CTR-versus-CVR split correctly
LocalIQ's 2026 data shows real estate click-through rate fell 9.73% year over year while conversion rate rose 12.8% in the same window. Read together, that is not a contradiction - it is a filtering effect. A more AI-heavy and ad-crowded search results page likely suppresses casual clicks, leaving a smaller pool of visitors who click with more intent, and that smaller pool converts at a higher rate once it lands. A CRO analyst should treat a falling CTR alongside a rising CVR as a sign the traffic mix has changed, not that the ad copy failed.
Building the CRO backlog from this data
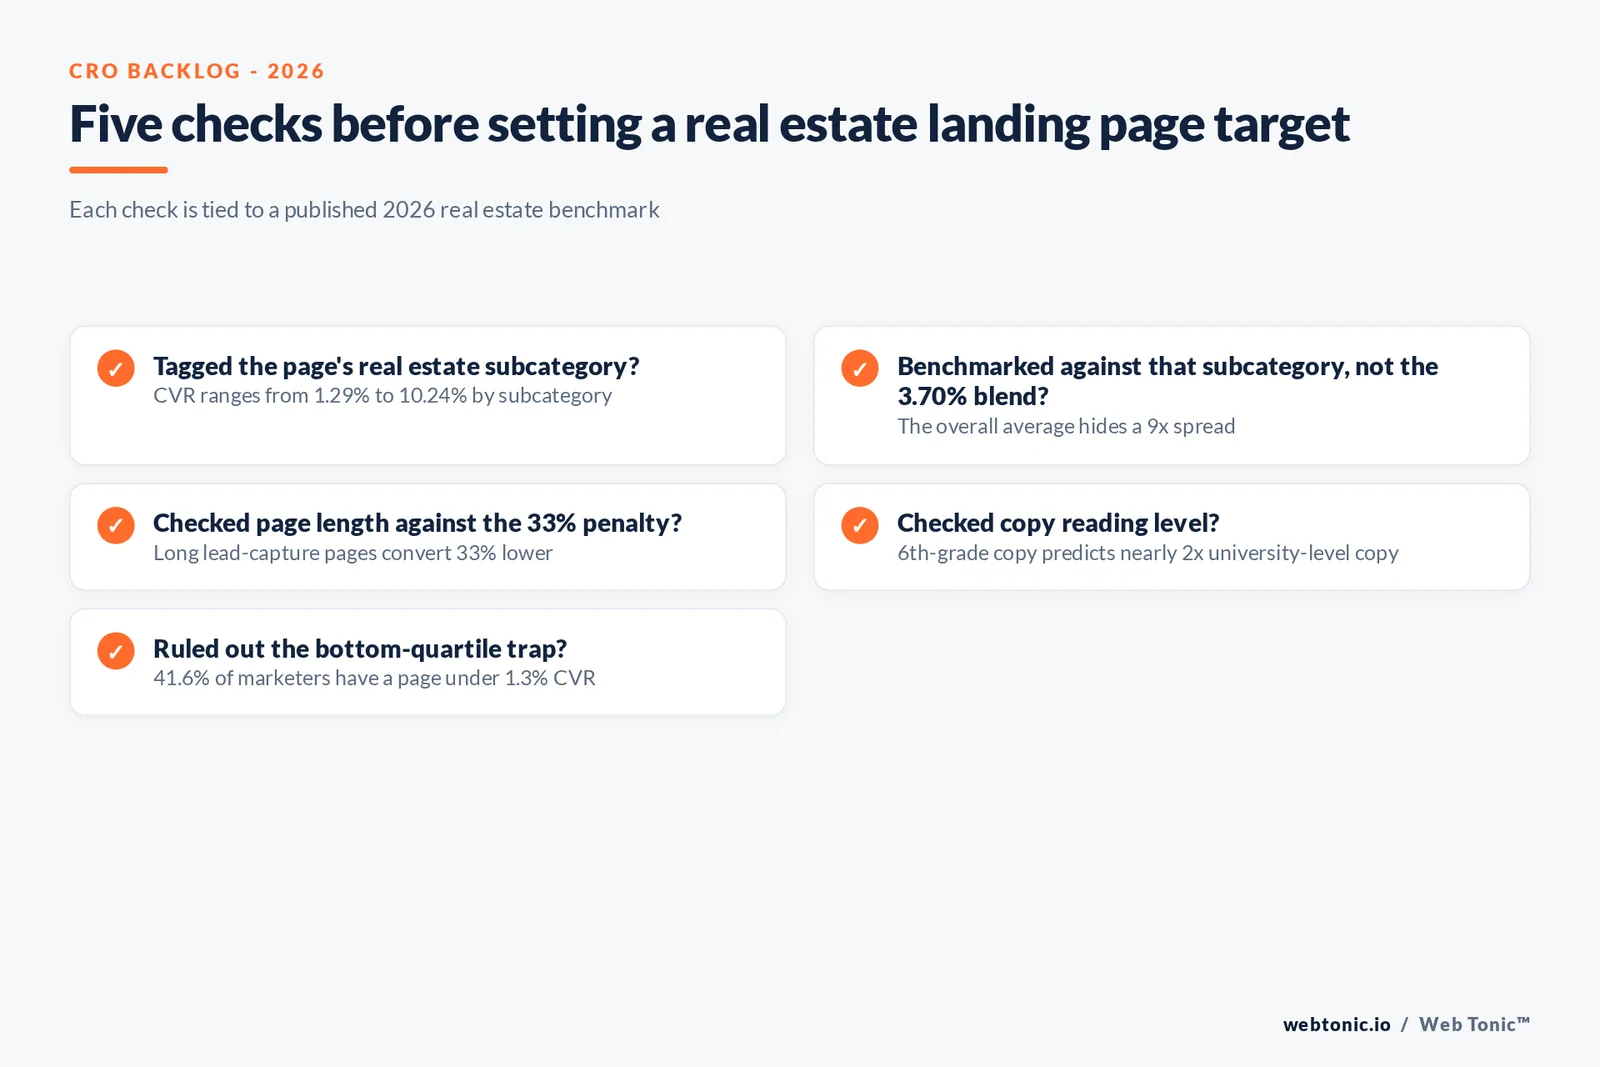
A defensible backlog starts by tagging every page with its real estate subcategory and its current cost per click, then benchmarking against the matching row above rather than the 3.70% blended average. Page length and reading level are the two highest-leverage, lowest-cost fixes the data supports, and they can be tested against the current page without touching media spend. Only after those are addressed does a traffic-quality or landing-page-relevance review make sense.
For the traffic side feeding these pages, our Google Ads cost guide covers what is driving the cost-per-click increases documented above, and our data and analytics practice can build the subcategory-level dashboard this backlog needs. Talk to us if a page audit is the next step.
Frequently Asked Questions
What is a good landing page conversion rate for real estate?
It depends entirely on which real estate subcategory you are in, which is the point most roundups miss. LocalIQ's 2026 benchmarks, built from nearly 900 real estate search campaigns, put Property Management at 10.24% conversion rate, Apartments and Rentals at 3.42%, and the lead-generation-heavy categories - Homes for Sale by Agent, Real Estate Broker, Residential Real Estate Agent - between 1.29% and 1.83%. Benchmarking your page against the wrong subcategory will make a healthy page look broken or a weak one look fine.
Does a shorter real estate landing page really convert better?
Unbounce's Conversion Benchmark Report found real estate lead-capture pages converted 33% lower when they ran long, and a page written at a 6th-grade reading level had a predicted conversion rate nearly double a page written at a university reading level. Both point the same direction: cut the copy and simplify the language before adding another section.
How many real estate landing pages are underperforming right now?
Unbounce reported that 41.6% of marketers in the real estate industry have at least one page converting below 1.3%, which the report places in the bottom quartile for the industry. That is a large enough share that a CRO analyst should assume roughly two in five client pages have a correctable problem before assuming the traffic itself is the issue.
Why did real estate conversion rates go up even as click-through rates fell?
LocalIQ's 2026 data shows real estate click-through rate fell 9.73% year over year while overall conversion rate rose 12.8%. The likely mechanism is that AI-heavy search results and a more ad-crowded results page filter out casual clicks, leaving a smaller but more intent-driven group of visitors landing on the page - which is exactly the audience a well-built landing page should convert at a higher rate.
Which real estate landing page category costs the most per click?
Property Management, at $3.94 average cost per click in LocalIQ's 2026 data, narrowly ahead of Homes for Sale by Agent at $3.90. Both sit above the $3.22 overall real estate average, which matters for CRO prioritization: the two most expensive categories to acquire a click for are also the two where a conversion rate improvement pays back fastest in absolute dollars.
Sources
LocalIQ - 2026 Real Estate Search Advertising Benchmarks
WordStream - Search Advertising Benchmarks by Industry, 2026
Unbounce - Conversion Benchmark Report
Unbounce - Data-Backed Real Estate Landing Page Design
Zillow - Consumer Housing Trends Report for Agents
NAR - The Feature Sheet: 2026 Member Profile


