



Table of contents
Key Takeaways
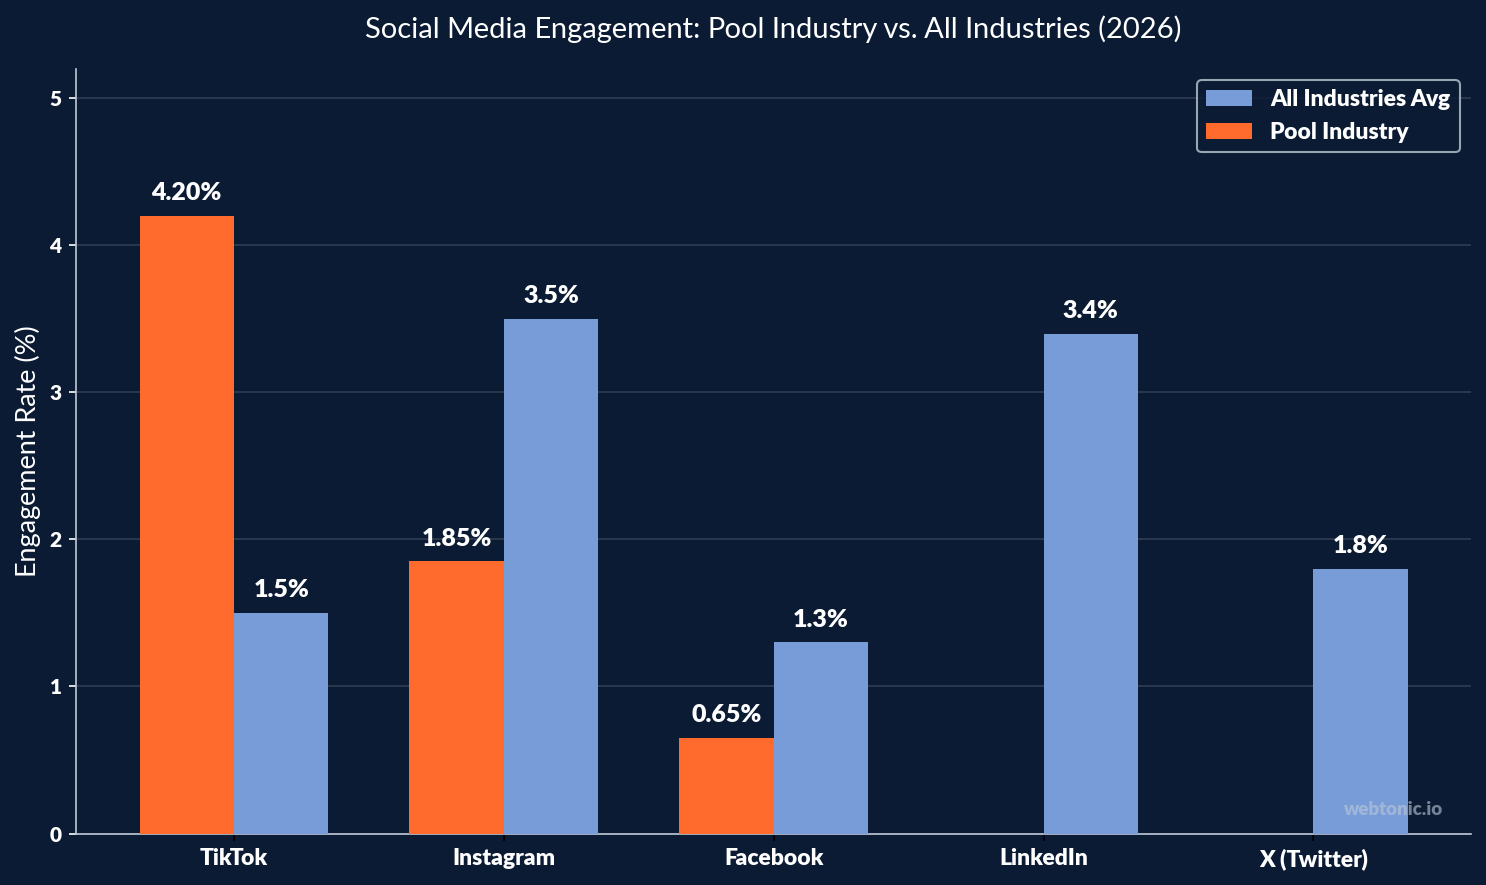
- Pool industry Instagram engagement rate averages 1.85%, nearly 3× the Facebook engagement rate of 0.65%, while TikTok leads all platforms at 4.2% (CuFinder).
- Social media advertising produces leads at $18–$45 per lead for most contractor trades, with pool builders at the higher end due to longer sales cycles (M. Wolf Media).
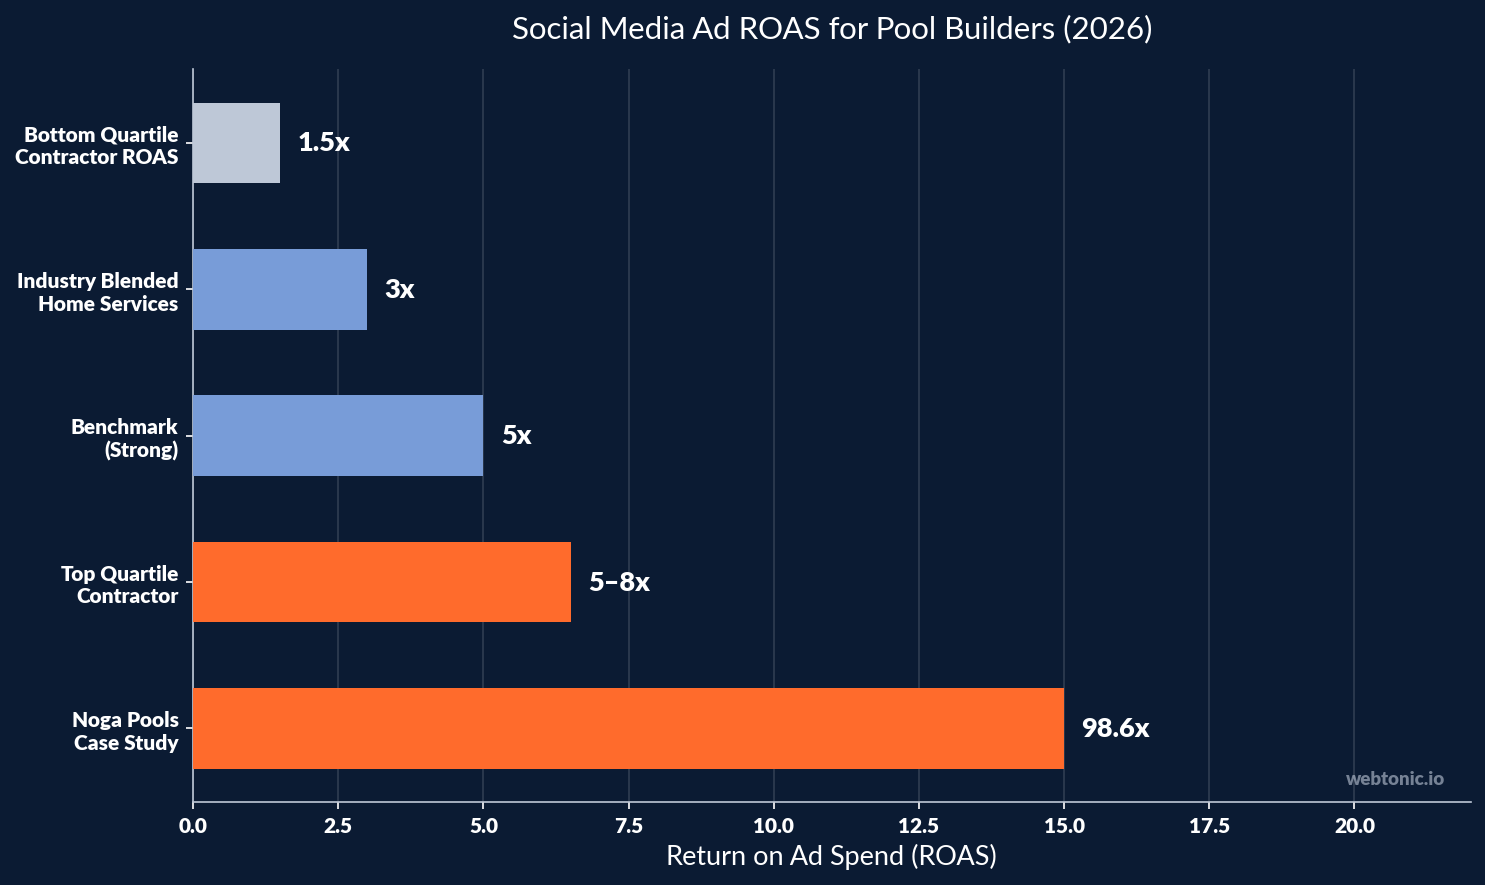
- Top-quartile contractor Meta ROAS reaches 5–8×, while the industry blended average sits at 3× and bottom-quartile performers lose money below 1.5× (PipelineOn).
- Noga Pools achieved a 9,860% ROAS in four months running a strategic Meta ad campaign, with 65% of written estimates coming through Facebook and Instagram (Bold Pro Digital).
- Facebook home-service CPLs spiked 80%+ in 2025, while organic engagement on home-related brands dropped nearly 30% — making paid social strategy more critical than ever (PipelineOn).
- A local pool company generated $390,000 in sales from just $600 in ad spend using targeted social media campaigns (Thrive Digital Partners).
- Social media contributes 12% of all swimming pool website traffic globally, ranking fourth behind organic search, direct visits, and paid search (CuFinder).
Social media marketing has become a critical lead generation and brand-building channel for swimming pool construction and service companies. With Instagram engagement rates of 1.85% outpacing most home-service verticals and TikTok delivering 4.2% engagement for pool content, the platforms offer distinct advantages for visual-first businesses. Below, we examine the latest social media advertising benchmarks, organic engagement data, and campaign performance statistics specific to the pool building industry.
Pool Industry Social Media Benchmarks at a Glance
| Metric | Pool Industry | Home-Service Average |
|---|---|---|
| Instagram engagement rate | 1.85% | 0.43% |
| Facebook engagement rate | 0.65% | 0.21% |
| TikTok engagement rate | 4.2% | 1.5% |
| Meta CPC (pool builders) | $2.15–$3.50 | $1.50–$4.00 |
| Meta CPM (pool builders) | $14.50 | $12–$18 |
| Social media CPL (contractors) | $18–$45 | $45 (Meta avg) |
| Meta conversion rate (home services) | ~10% | ~10% |
| Social traffic share (pool sites) | 12% | 8–15% |
Organic Social Media Engagement for Pool Companies
Pool building is an inherently visual industry — before-and-after transformations, aerial drone footage of completed pools, and time-lapse construction videos generate strong organic engagement across platforms. According to CuFinder's 2026 Swimming Pool Industry Benchmarks:
- Instagram engagement: 1.85% — significantly higher than the general home-services average of 0.43%, driven by high-quality pool photography and Reels content
- Facebook engagement: 0.65% — above the 0.21% home-services average, with community groups and local business pages performing best
- TikTok engagement: 4.2% — the highest of any platform, reflecting the short-form video format's alignment with pool transformation content
Cross-industry benchmarks from Hootsuite's 2026 report provide context: the all-industry Instagram average sits at 3.5% (including Instagram Reels at 2.8%), LinkedIn at 3.4%, and the Facebook average at 1.3%. Pool builders outperform the home-services vertical on Instagram and Facebook but trail the all-industry Instagram average, suggesting room for content optimization — particularly through Reels and carousel formats that earn higher algorithmic distribution.
Posting consistently — at least three to four times per week on Instagram and daily on TikTok — is critical for maintaining algorithmic visibility and building an audience that recognizes your brand. Small pool company accounts (under 5,000 followers) tend to see higher engagement rates than larger accounts (PoolFounder), making social media an accessible growth channel even for local operators with modest followings. About 70–80% of pool builder competitors are not active on any platform beyond Facebook (Patrick Herbert), creating a meaningful competitive gap for firms willing to invest in Instagram, TikTok, or YouTube Shorts content production.
Paid Social Media Advertising Performance
Paid social campaigns — particularly on Meta platforms (Facebook and Instagram) — are the primary driver of social media lead generation for pool builders. Key advertising benchmarks for 2026:
| Meta Ads Metric | Pool Builder Benchmark |
|---|---|
| Average CPC | $2.15–$3.50 |
| Average CPM | $14.50 |
| Average CPL (home services Meta) | $45 (up from $41 in 2025) |
| Meta conversion rate (home services) | ~10% (slight decline from 10.53%) |
| Home-service social ad CTR | 0.96–1.79% |
| Industry blended ROAS | 3× |
| Top-quartile contractor ROAS | 5–8× |
| Bottom-quartile contractor ROAS | Below 1.5× (losing money) |
A critical trend: Facebook home-service CPLs spiked 80%+ in 2025 (PipelineOn), while organic engagement dropped approximately 30%. This cost increase reflects greater competition for limited inventory and makes campaign optimization more important than ever. The cost per booked job — not just cost per lead — is the metric that matters most, as pool project sales cycles span weeks to months from initial inquiry to signed contract.
Pool Builder Social Media Case Studies
Documented case studies from pool companies demonstrate the outsized returns possible with targeted social media campaigns:
| Company | Ad Spend | Results | ROAS |
|---|---|---|---|
| Noga Pools | 4-month Meta campaign | 65% of estimates through Meta; 9,860% ROAS | 98.6× |
| Local Pool Co. (Thrive DP) | $600 | 75,348 views; 1,155 clicks; $390K in sales | 650× |
| Blue Tree Pools (ROI.LIVE) | Not disclosed | $4.38M revenue; $988 per sale | 36× |
Noga Pools ran a strategic Meta advertising campaign over four months and saw 65% of all written estimates come directly through Facebook and Instagram, achieving a 9,860% return on ad spend (Bold Pro Digital). In another case, Thrive Digital Partners helped a local pool company generate $390,000 in sales from just $600 in ad spend, with 75,348 video views and an average CPC of just $0.52 (Thrive Digital Partners).
These results illustrate that pool builders benefit from a key advantage on social media: pool projects are highly visual, and before/after content naturally stops the scroll. The high average project value ($65,909 for inground construction) means that even a small number of conversions from a social campaign can generate massive returns relative to ad spend.
Platform-by-Platform Comparison for Pool Builders
Each social media platform serves a distinct role in the pool builder marketing funnel. Understanding where to allocate organic and paid effort maximizes overall campaign efficiency:
| Platform | Engagement Rate | Best Content Type | Primary Role |
|---|---|---|---|
| TikTok | 4.2% | Time-lapse builds, transformations | Awareness & virality |
| 1.85% | Reels, carousel portfolios, Stories | Portfolio & lead generation | |
| 0.65% | Lead Ads, community groups, reviews | Lead gen & retargeting | |
| YouTube | Varies | Long-form builds, educational content | SEO & trust building |
| Varies | Pool design inspiration boards | Design-phase discovery |
Facebook remains the dominant paid social channel for pool builders due to its sophisticated Lead Ads format and detailed local targeting capabilities. However, Instagram Reels and TikTok are rapidly growing organic reach channels — the 2026 Outdoor Living social trends report notes that pool builders using short-form video content see 2–3× the engagement compared to static image posts (Bennington Brookstone). YouTube also serves as a long-term SEO asset, with pool-related search queries appearing in both Google and YouTube results.
Social Media Best Practices for Pool Builders
- Prioritize short-form video content — TikTok (4.2% engagement) and Instagram Reels drive the strongest organic reach. Before-and-after pool transformations, drone flyovers, and construction time-lapses perform best in the pool industry.
- Run Facebook Lead Ads for direct lead capture — Lead Ads keep users on-platform and reduce friction, generating leads at $18–$45 for contractor trades. Use pre-filled forms with qualifying questions about pool type, budget range, and timeline.
- Target local audiences within your service radius — pool construction is a hyperlocal business. Geo-target ads to homeowners within your service area using radius targeting and income-level filters to reach qualified prospects.
- Invest in video creative over static images — video content captures attention at significantly higher rates. The Thrive Digital Partners case study achieved 75,348 views and $390K in sales from $600 using targeted video campaigns.
- Track cost per booked job, not just CPL — pool sales cycles are long. Integrate your CRM with Meta conversion tracking to measure true ROAS from lead to signed contract, which is the metric that separates top-quartile (5–8×) from bottom-quartile (below 1.5×) performers.
- Leverage seasonal timing — launch awareness campaigns in late winter (January–February) to build pipeline ahead of the spring-summer buying peak. Increase retargeting budgets in March–May when purchase intent peaks.
- Expand beyond Facebook — only 20–30% of pool builders are active on Instagram, TikTok, or YouTube. Establishing a presence on these platforms creates a competitive advantage, especially on TikTok where pool content earns 4.2% engagement compared to 0.65% on Facebook.
Social Media Advertising Cost Trends (2025–2026)
Pool builders should plan social media budgets against a backdrop of rising costs and shifting platform dynamics:
- Average Meta CPL for home services: $45 in 2026, up from $41 in 2025 — a 9.8% increase (PipelineOn)
- Facebook home-service CPLs rose 80%+ in the prior year, the steepest increase among digital channels
- Organic engagement on home/retail brands dropped ~30%, making organic reach alone insufficient for consistent lead generation
- Meta Reels CTR for home services: approximately 4%, significantly higher than static ad formats
- Meta replacement-funnel ROAS for HVAC/roofing (comparable trades): 4–6×, a useful benchmark for pool builders in similar markets
- 80% of homeowners research contractors online before reaching out, making social proof and visual portfolio content essential (Click-Vision)
The rising cost environment rewards advertisers who invest in creative testing, audience segmentation, and full-funnel tracking. Pool builders who rely on boosted posts alone will see diminishing returns compared to those running structured campaigns with dedicated creative assets and conversion-optimized landing pages.
Swimming Pool Industry Context for Social Marketers
Social media strategy for pool builders must account for the industry's unique characteristics:
- $23.37 billion global pool and spa market in 2026, growing at 6.3% CAGR — a large addressable market for digital lead generation
- 60,000 new inground pools installed annually across the United States, each representing a $65,909 average project value
- 14 million+ existing pools requiring ongoing maintenance, creating opportunities for service-oriented social campaigns
- 125,000 pool-related businesses competing for local homeowner attention across digital channels
- 78% service-contract retention rate with a 3-year customer lifetime value of $2,400, making initial acquisition cost more defensible
- Strongly seasonal demand — search and social interest peaks March through May, requiring pre-season campaign ramp-up
The combination of high project values, strong visual appeal, and seasonal demand patterns makes social media one of the most effective digital marketing channels for pool building companies — provided campaigns are strategically timed and budgets are concentrated in peak-demand periods.
FAQ: Frequently Asked Questions
What social media platform has the highest engagement for pool builders?
TikTok leads with a 4.2% engagement rate for pool industry content, followed by Instagram at 1.85% and Facebook at 0.65%. The visual nature of pool construction — dramatic before-and-after transformations, drone footage, and time-lapse builds — aligns perfectly with short-form video platforms that prioritize visual storytelling.
How much do Facebook ads cost for pool builders?
Pool builder Meta ad costs average $2.15–$3.50 per click and $14.50 CPM. The average cost per lead for home services on Meta is $45 in 2026, up from $41 the prior year. However, well-optimized campaigns can generate leads at $18–$45 depending on targeting, creative quality, and the local competitive landscape.
What ROAS should pool builders expect from social media advertising?
The industry blended Meta ROAS for home services sits at 3×. Top-quartile contractors achieve 5–8× ROAS, while bottom-quartile performers fall below 1.5× and lose money. Exceptional campaigns — like Noga Pools' 9,860% ROAS or the $600-to-$390K case study — are possible but require strong creative, precise targeting, and robust conversion tracking infrastructure.
Is organic social media still effective for pool companies?
Organic reach has declined significantly — home-related brand engagement dropped roughly 30% on Facebook in the past year. However, organic content remains essential for social proof, brand credibility, and retargeting audiences. The most effective strategy combines consistent organic posting with targeted paid campaigns to drive measurable lead generation. Small accounts under 5,000 followers often see higher engagement rates than larger pages.
How does social media compare to Google Ads for pool lead generation?
Google Ads captures high-intent searchers at $7.50–$11.00 per click with a 4.8% conversion rate, while social media builds awareness and captures interest at $2.15–$3.50 per click but with lower immediate conversion intent. The strongest pool builder marketing strategies use both channels: social media for top-of-funnel visibility and lead generation, Google Ads for bottom-of-funnel high-intent capture.
Sources
CuFinder — Swimming Pool Industry Marketing Benchmarks 2026
M. Wolf Media — Social Media Marketing for Contractors 2026
PipelineOn — Social Media Campaign Effectiveness for Contractors
Bold Pro Digital — Noga Pools 9,860% ROAS Case Study
Thrive Digital Partners — Pool Company $390K Social Campaign
Hootsuite — Average Engagement Rates by Industry 2026
PoolFounder — Instagram for Pool Service Companies 2026
Click-Vision — Home Services Marketing Statistics 2026
LocaliQ — Home Services Advertising Benchmarks
Bennington Brookstone — 2026 Social Media Trends for Outdoor Living


