Table of contents
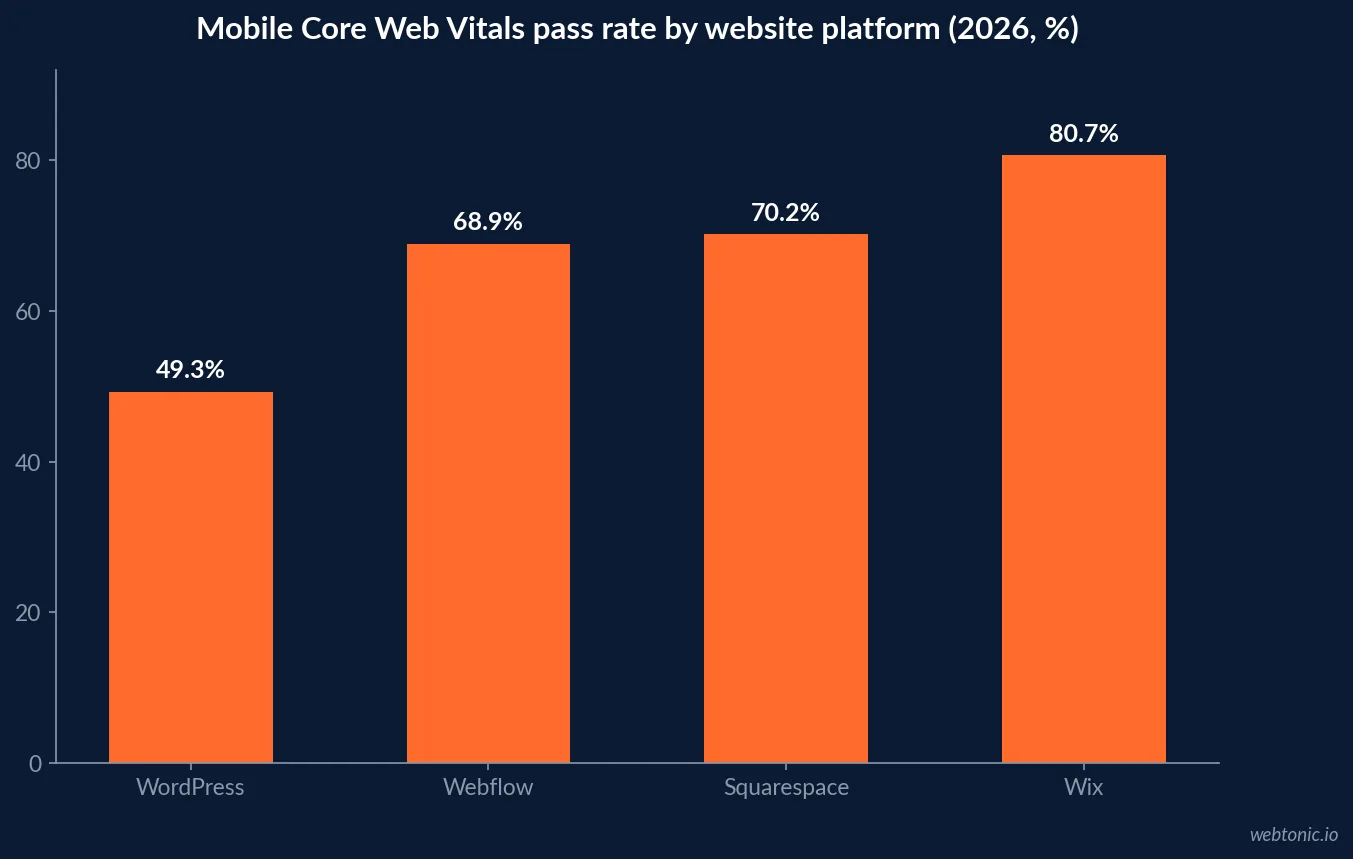
Plumbers do not choose a CMS for fun. They choose it because a homeowner standing in water will call whoever loads first. In a 47-site plumber audit WordPress held 58-60% of plumber websites and Webflow just 4% — yet Webflow posted the second-cleanest code output in the study and passes mobile Core Web Vitals on 68.9% of origins against 49.3% for WordPress.
Key Takeaways
- Webflow powers roughly 822,550 sites (0.8% of the web), but its share rises to 4.2% among the world's top 1,000 highest-traffic sites.
- Only 4% of audited plumber websites run on Webflow versus 58-60% on WordPress, 13% on enterprise CMS, 11% custom/static, 9% Duda and 4% Wix.
- Mobile Core Web Vitals pass rates: Wix 80.7%, Squarespace 70.2%, Webflow 68.9%, WordPress 49.3% on platform defaults.
- Good-TTFB share is 55.5% on Webflow against 24.8% on WordPress — a hosting-quality story more than a software story.
- Webflow ships the lightest combined payload of the four builders at 918 KB median JS and 855 KB median images.
- Webflow hosting runs $18-$49 per month with SSL and CDN included, while WordPress hosting spans $3 to $200+ and hidden Year 1 costs add $3,000-$20,000.
- Business-plan CMS limits are 10,000 items, 40 collections and 100 items per list — irrelevant for one plumber, decisive for a franchise.
- Platform choice explains only about 30% of site speed; the other 70% is template, integrations, imagery and third-party scripts.
Where Webflow actually sits in the plumbing market
Webflow is a small platform with a disproportionately professional user base. It powers about 822,550 websites, or 0.8% of the internet — roughly 1 in 125 sites — with 160,696 in the United States, and its user base grew 67% year over year. Revenue reached $213 million in 2024, up 66%, on a $4 billion valuation.
Among plumbers the picture is inverted. Plumbing is a WordPress market by inertia, and the audit numbers show what that inertia costs.
| Platform | Share of 47 plumber sites | Content-to-code ratio | What it means for a plumber |
|---|---|---|---|
| WordPress | 58-60% | 4.3% | Everything is possible, nothing is default; the study's slowest site (4,981 ms) was WordPress |
| Enterprise / franchise CMS | 13% | 2.8% | Heavy centralised markup; worst ratio outside consumer builders |
| Custom / static HTML | 11% | 11.8% | Cleanest output by roughly 3x, but every edit needs a developer |
| Duda | 9% | — | Produced the fastest site in the study at 255 ms |
| Webflow | 4% | 5.0% | Second-best ratio; editable without a developer for routine changes |
| Consumer builders (Wix) | 4% | 0.1% | Worst ratio in the study; consistent SEO underperformers |
Field performance: Webflow versus WordPress on defaults
The cleanest available comparison uses CrUX field data rather than lab scores. On mobile, Core Web Vitals pass rates land at 80.7% for Wix, 70.2% for Squarespace, 68.9% for Webflow and 49.3% for WordPress. A second 2026 dataset puts Webflow at a 58% pass rate against WordPress at 42% and Squarespace at 34%, with Webflow averaging 190 ms INP — inside the 200 ms good threshold.
| Mobile metric | WordPress | Webflow | Squarespace | Wix |
|---|---|---|---|---|
| Core Web Vitals pass (all three) | 49.3% | 68.9% | 70.2% | 80.7% |
| Good TTFB share | 24.8% | 55.5% | 80.8% | 66.9% |
| Median JavaScript weight | 692 KB | 918 KB | 1,571 KB | 1,707 KB |
| Median image weight | 1,029 KB | 855 KB | 1,111 KB | 185 KB |
| Lightest combined payload | No | Yes | No | No |
Two honest caveats. First, WordPress ships the lightest median JavaScript of the four (692 KB) — most of its problem is images and hosting, not code. Second, the TTFB gap exists because WordPress runs on everything from $3 shared hosting to enterprise clusters, while Webflow gives every customer the same managed stack. That is why platform selection accounts for roughly 30% of a site's speed and implementation for the other 70%.
The plumbing speed floor nobody clears
Speed matters more in plumbing than in almost any other trade because the demand is unplanned. Across the 47 audited plumber sites the average Time to Interactive was 1,660 ms with a median of 1,243 ms; the fastest loaded in 255 ms, the slowest in 4,981 ms, and only 13% came in under 500 ms.
Bounce behaviour is the other half of the equation: 0-2 s load produces a 28% bounce rate, 2-3 s gives 35% and 3-4 s gives 44% — a 57% increase from baseline. Most plumbing sites in 2026 load between 4.5 and 8 seconds on mobile, which is exactly why a platform with a good default matters for owners who will never hire a performance engineer.
| Mobile load band | Average bounce rate | Practical effect on emergency demand |
|---|---|---|
| 0-2 seconds | 28% | Tap-to-call visible before the caller reconsiders |
| 2-3 seconds | 35% | Acceptable; still inside Google's good LCP band |
| 3-4 seconds | 44% | Roughly a 57% bounce increase over baseline |
| 4.5-8 seconds | Higher still | Where most plumbing sites actually sit in 2026 |
| 6 seconds | Severe | Converting at about 65-80% of the 3-second rate |
Total cost of ownership, not sticker price
Webflow looks more expensive monthly and is frequently cheaper annually, because the hosting line is the only hosting line. Webflow plans run $18 (Basic, no CMS), $29 (CMS, 2,000 items) and $49 (Business, 10,000 items), each including SSL, CDN and managed infrastructure. WordPress hosting spans $3-$15 shared, $25-$200 managed, and the real cost buckets sit outside hosting entirely — plugins, developer time and maintenance.
Then there is the build. Plumbing website pricing in 2026 runs from a $16-per-month DIY builder to $10,000-$15,000+ for a full lead-generation build, with the sweet spot at $3,000-$8,000 for operators under $1M in revenue and $15,000-$30,000 for multi-location shops with 15+ trucks.
| Cost line | Typical range | Webflow note |
|---|---|---|
| Hosting | $18-$49/mo (Webflow) vs $3-$200/mo (WordPress) | SSL, CDN and infrastructure included |
| Build (freelancer / small agency) | $1,500-$5,000 | Fits 1-3 truck operators under $500K revenue |
| Build (lead-gen, 15+ pages) | $5,000-$15,000+ | Payback commonly reported at 3-6 months |
| Maintenance and security | $600-$2,400/yr | Largely absorbed by the hosted platform |
| Ongoing SEO | $6,000-$30,000/yr | Platform-independent |
| CRM and call tracking | $1,524-$7,764/yr | Integration work, not plugins |
| Total hidden Year 1 extras | $3,000-$20,000+ | Always ask for a full Year 1 estimate |
A single repipe ($4,000-$15,000) or water-heater replacement ($1,500-$4,000) can cover 50-80% of an entire website build, which is why we scope plumbing builds against booked-job value rather than page count in our growth marketing engagements.

Where Webflow genuinely constrains a plumbing site
Two honest limits, both structural rather than fixable.
- CMS ceilings. The Business plan caps at 10,000 CMS items, 5,000 items per collection, 40 collections, 5 reference fields per collection and 100 items per collection list. Fine for 20 services and 40 cities; fatal for a franchise generating thousands of city-by-service permutations.
- No plugin ecosystem. Field service management, dispatch and booking tools get integrated via API or embed rather than installed. That is cleaner code and more upfront work.
The mirror-image risk on WordPress is security debt: 91% of reported WordPress vulnerabilities live in plugins rather than core, and Elementor is used by roughly 43% of WordPress sites while adding meaningful JavaScript overhead. Neither platform is safe by default; they fail differently.
What a plumbing Webflow build should contain
Platform is the easy decision. Structure is the one that produces leads.
- Service-specific pages, not one homepage. Homepage-driven plumbing sites cap out around 2-3% conversion while service pages convert at 8-15%. Twelve to twenty pages is the working range.
- Sticky tap-to-call across every breakpoint. 76% of near-me plumbing searches are mobile and 60% of mobile plumbing searches end in a call.
- Three-field forms. Each field past three costs roughly 10-15% of conversions; a seven-field form converts at 40-60% of a three-field form.
- 1,000+ words on the primary page. 60% of audited plumber sites clear 1,000 words (1,462 average); the thinnest carried 52.
- Analytics on day one. 38% of plumber sites have no analytics at all, and 24% do not prominently display a phone number.
- After-hours capture. 35-40% of plumbing searches happen outside business hours, so the form and the call path must both work at 2am.
Migration: what actually changes and what does not
Replatforming is sold as a ranking fix and rarely is one. What migrations reliably change is speed, maintenance cost and publishing velocity. Reported Webflow migrations include a 12.7% pageview increase with a 27.9% bounce-rate decrease at one enterprise brand and a 25% session lift with organic traffic doubling at another — outcomes driven by the rebuild and content work as much as the platform.
Sequence a plumbing migration like this: freeze URL structure and map every redirect before design; port schema and Google Business Profile consistency; keep tracking live in parallel for 30 days; and only then expand service and city pages. Skipping the tracking overlap is how operators lose the before-picture — the exact failure our data intelligence team is usually called in to reconstruct after the fact.
What a plumbing website must never do
- Never pick a platform on monthly hosting price. The $3,000-$20,000 of Year 1 extras dwarfs a $30 hosting delta.
- Never ship a rebuild without analytics, call tracking and tap-to-call live on launch day.
- Never migrate without a redirect map. Lost city and service URLs cost more than the build.
- Never spawn thousands of thin location permutations to fill a CMS quota; thin pages dilute the ones that could rank and burn crawl budget.
- Never assume a hosted platform makes you fast. 70% of speed is implementation — imagery, embeds and third-party scripts.
- Never judge the rebuild on a Lighthouse score. Judge it on booked jobs, as covered in our plumbing SEO statistics breakdown.
Metrics to report every month
- Mobile LCP, INP and CLS from field data, plus Time to Interactive against a 1,000 ms target.
- Mobile conversion rate split by template: home, emergency, service, city.
- Tap-to-call events and form submissions per 1,000 mobile sessions.
- CMS item count against plan ceiling, so a limit never arrives as a surprise.
- Total cost of ownership per booked job: hosting plus maintenance plus content divided by jobs.
- Share of bookings arriving outside business hours, against the 35-40% search benchmark.
- Page-weight trend, because bloat returns quietly through embeds and review widgets.
If you want the platform decision made against lead economics rather than aesthetics, talk to us.
Frequently Asked Questions
Is Webflow a good platform for a plumbing website in 2026?
It is a strong default for a single-location or small multi-location plumber. Webflow passes mobile Core Web Vitals on 68.9% of origins against 49.3% for WordPress, ships the lightest combined JavaScript plus image payload of the four mainstream builders, and posted the second-best content-to-code ratio (5.0%) in a 47-site plumber audit. The trade-off is a hosted CMS with hard item limits and no plugin ecosystem, so a plumber who wants a booking engine bolted on with a plugin will need an integration instead.
How much does a Webflow plumbing website cost per year?
Hosting is $18 per month for a static Basic site, $29 for CMS (2,000 items) and $49 for Business (10,000 items), with SSL and CDN included on every plan. Add the build: plumbers pay roughly $1,500-$5,000 for a freelancer or small-agency site and $5,000-$15,000 for a lead-generation build with 15-plus service and city pages. The number most operators miss is Year 1 extras - hosting, maintenance, SEO, CRM, call tracking and content can add $3,000 to $20,000 or more on top of the quoted price.
Does Webflow rank better than WordPress for plumbers?
Neither platform ranks; implementation does. What the field data shows is that Webflow starts closer to the finish line: 58% Core Web Vitals pass rate versus 42% for WordPress in one 2026 comparison, and a 55.5% good-TTFB share against 24.8% on WordPress, largely because WordPress runs on every tier of hosting from $3 shared plans upward. WordPress has the higher ceiling and the lower floor.
What are Webflow's CMS limits and do they matter for a plumbing site?
The Business plan caps at 10,000 CMS items, 5,000 items per collection, 40 collections, 5 reference fields per collection and 100 items per collection list. A plumber with 20 service pages, 40 city pages, a blog and a review collection will not come close. A franchise or roll-up generating thousands of city-by-service permutations will, and that is the point at which an enterprise plan or a different stack becomes the honest answer.
What is the single biggest website win for a plumber, regardless of platform?
A sticky tap-to-call button plus compressed hero imagery. Mobile conversion typically moves from 1-1.5% to 3-4% within a week of shipping the call button, and image work removes 1.5-3 seconds of mobile load. One documented rebuild took a plumbing site from 1.4% to 6.2% conversion in 90 days - 45 leads a month to 198 - with cost per lead falling from $267 to $61 on an unchanged budget.
Sources
Claremont Software — 47 Plumber Websites Analyzed (2026)
PageSpeed Matters — WordPress vs Webflow vs Squarespace Speed (2026)
Stacc — WordPress vs Webflow for SEO (2026)
Popupsmart — Webflow Statistics 2026
The Alien Design — Webflow Usage Statistics
PlumbingSEO.agency — Plumber Website Costs 2026
Dalton Craighead — Webflow vs WordPress Total Cost (2026)
Astra Results — Plumbing Website Conversion (2026)
PipelineOn — Plumbing Website Elements