



Table of contents
Plumbing lifecycle value runs on the same two levers as any residential trade - repeat calls and referrals - but the trigger data looks different from HVAC's. ServiceTitan's contractor survey and Housecall Pro's homeowner and repair-share data are the named sources behind the benchmarks on this page.
Key Takeaways
- Repeat customers make up 58% of completed work and 39% of revenue across residential contractors including plumbing, per ServiceTitan's 2023 survey (2022 data) of 1,000-plus firms.
- Word-of-mouth referrals contribute 71% of business volume in the same survey.
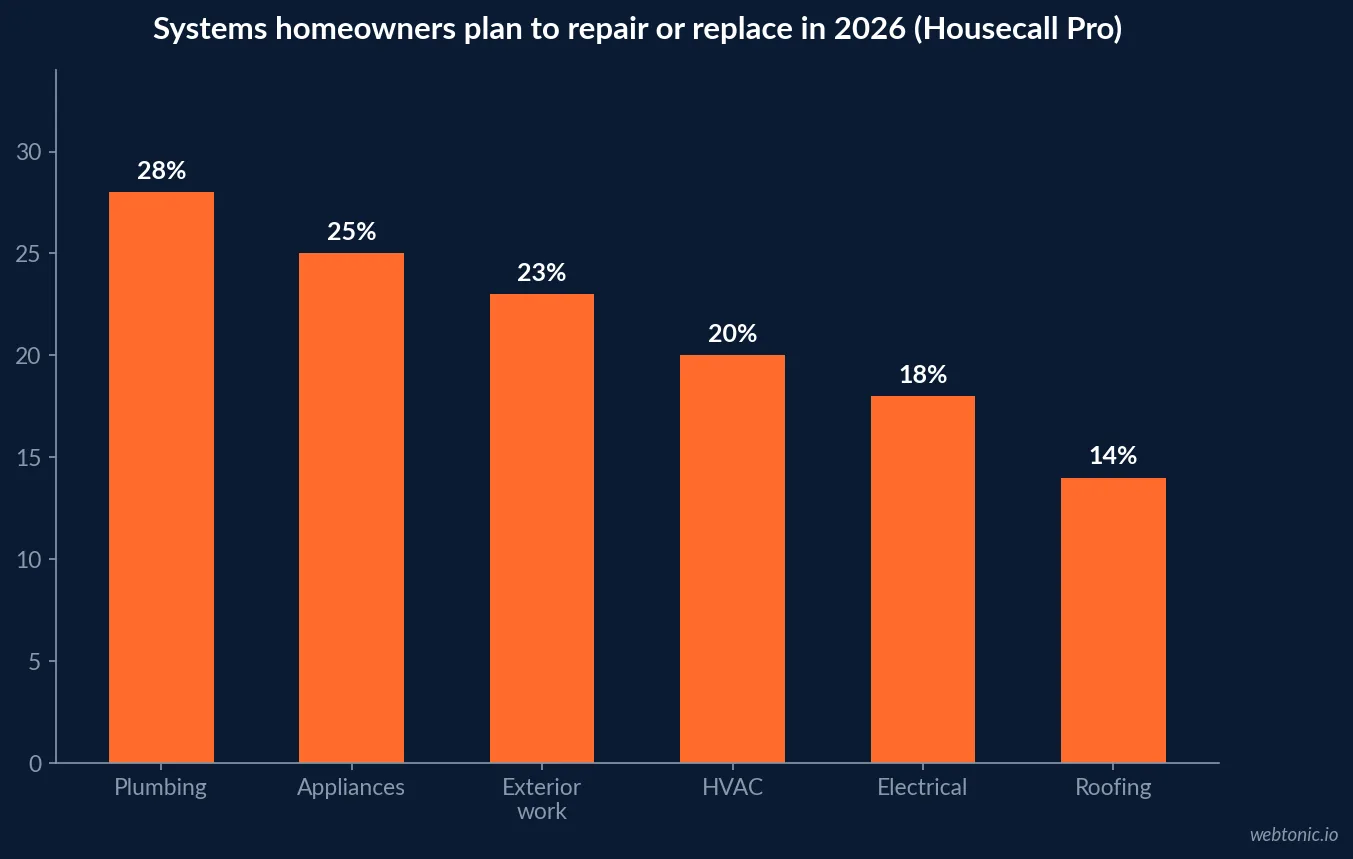
- Plumbing was the most-cited system homeowners plan to repair or replace in 2026, named by 28% of respondents - ahead of appliances, exterior work, HVAC, electrical and roofing.
- Repairs made up about 87% of plumbing jobs on Housecall Pro's platform in the period measured, nearly matching HVAC's 88%.
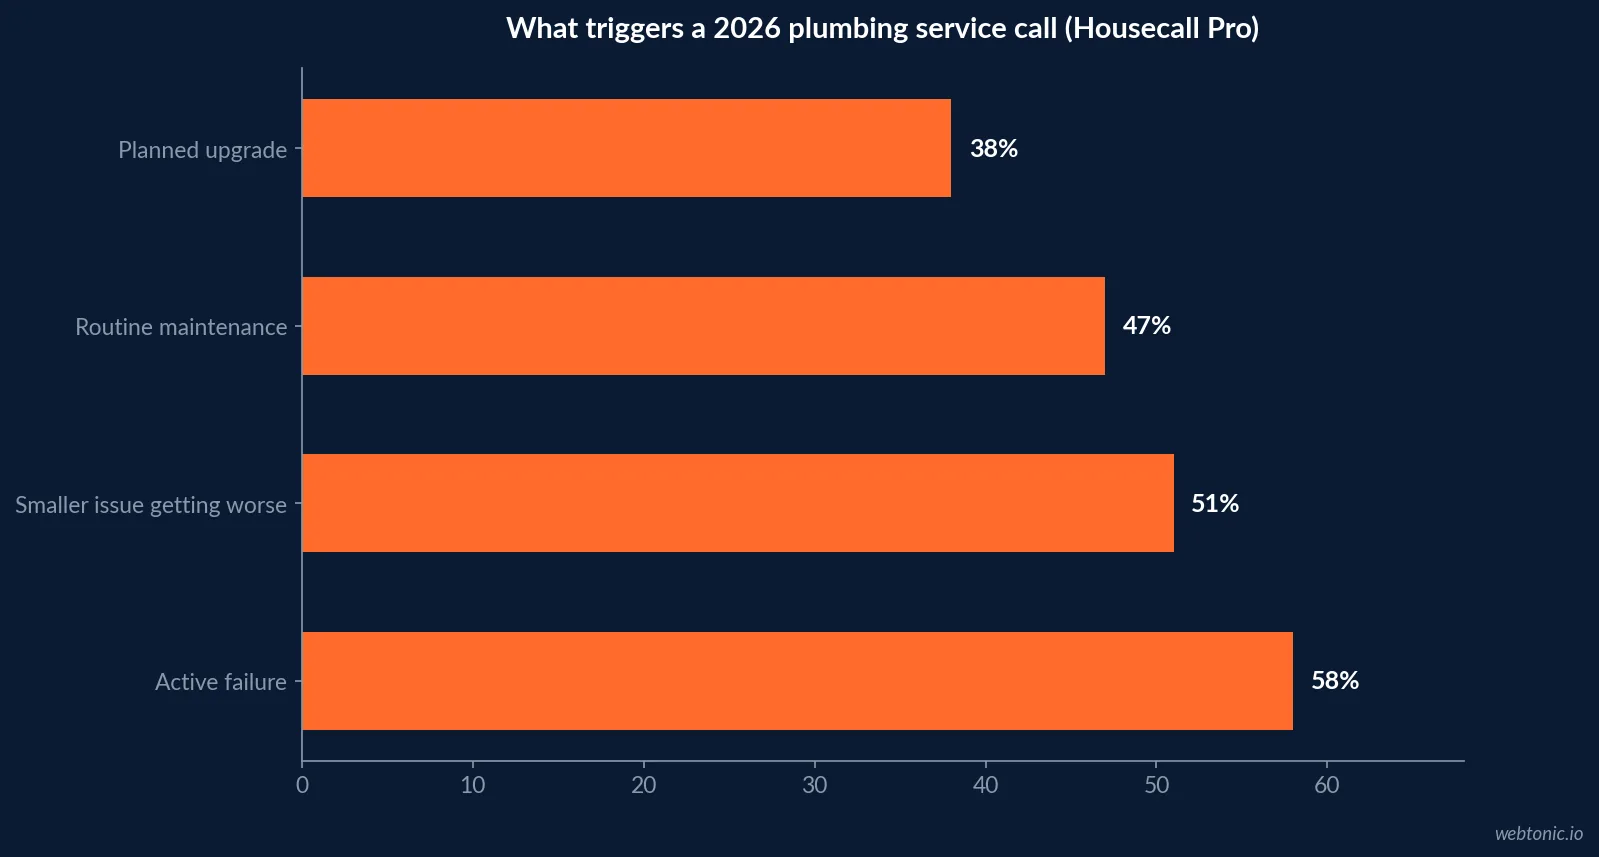
- The leading service trigger is an active failure at 58%, not a planned project at 38% - most plumbing calls are still reactive.
- 51% of homeowners cite a "smaller issue getting worse" as a trigger, the exact window a proactive maintenance touch can intercept before it becomes an emergency call.
- Only 47% of service calls originate from routine maintenance - below both the failure and escalation triggers combined.
- 79% of homeowners plan to repair or replace at least one home system in 2026, and 72% plan to stay in their current home.
- A 5-percentage-point retention gain lifts profit by 25% to 95%, per Bain & Company's Reichheld research - not plumbing-specific, but directly applicable to repeat-visit economics.
- 59% of homeowners spent more than USD 3,000 on home projects in 2025, a spending floor a membership-plan pitch can reference.
- Plumbing, appliances and exterior work together account for 76% of the systems homeowners name as their top 2026 repair priority.
- No plumbing-specific membership-renewal census exists the way ACCA's does for HVAC - the gap itself is evidence the category is underbenchmarked.
- The 71% referral share and 39% repeat-revenue share come from the same survey population, meaning they compound rather than compete for budget.
- 44% of homeowners plan "optional improvements" in 2026, a lower-urgency category where a plumbing referral program can generate work outside emergency calls.
- A plumbing shop with no membership plan is competing purely on the 58% failure-driven call volume, missing the 51% escalating-issue window entirely.
- None of the figures above require a subscription-billing platform - they come from job history and homeowner-survey data most field-service platforms and vendor reports already track.
Benchmarks at a glance
| Lifecycle metric | Reported figure | Source |
|---|---|---|
| Repeat-customer share of work (residential contractors) | 58% | ServiceTitan Residential Service Contractor Market Report (2022 data) |
| Repeat-customer share of revenue | 39% | ServiceTitan (2022 data) |
| Referral share of business volume | 71% | ServiceTitan (2022 data) |
| Plumbing repair share of jobs | ~87% | Housecall Pro 2026 State of Home Service Spending |
| Plumbing as top-named system for 2026 repair/replace | 28% of homeowners | Housecall Pro homeowner survey |
The same repeat-and-referral economics, a plumbing-specific trigger
ServiceTitan's Residential Service Contractor Market Report, surveying more than 1,000 residential contractors across trades, found repeat customers made up 58% of completed work and 39% of annual revenue, with referrals contributing 71% of business volume. Plumbing sits inside that sample rather than as a standalone line item, but the mechanism holds regardless of trade: a returning customer costs nothing to re-acquire, and a satisfied one refers.
What differs by trade is the trigger. Housecall Pro's homeowner survey of 1,100-plus U.S. respondents found plumbing was the single most-cited system homeowners plan to repair or replace in 2026, at 28% - ahead of appliances (25%), exterior work (23%), HVAC (20%), electrical (18%) and roofing (14%).
Most plumbing calls are still reactive, not scheduled
The same Housecall Pro report found repairs made up roughly 87% of plumbing jobs on its platform in the quarter measured - almost identical to HVAC's 88%, suggesting the repair-over-replacement pattern is structural across residential trades rather than specific to one system. On the demand side, the leading service trigger was an active failure at 58%, followed by a smaller issue getting worse at 51% and routine maintenance at just 47%. Only 38% of respondents cite a planned upgrade.
That 51% "getting worse" figure is the addressable window for lifecycle marketing: a plumber who reaches a customer during the escalation phase - before it becomes an emergency call - both protects the relationship and avoids the higher-cost emergency dispatch.
| Homeowner service trigger (2026) | Share citing it | Source |
|---|---|---|
| Active failure - something broke | 58% | Housecall Pro State of Home Service Spending |
| Smaller issue getting worse | 51% | Housecall Pro State of Home Service Spending |
| Routine maintenance, scheduled or seasonal | 47% | Housecall Pro State of Home Service Spending |
| Planned project or upgrade | 38% | Housecall Pro State of Home Service Spending |
Why the retention math still applies without a plumbing-specific study
No association publishes a plumbing-specific membership-renewal census the way ACCA does for HVAC maintenance agreements - the gap is itself worth naming, since it means most plumbing shops are benchmarking against nothing at all. The underlying research, Bain & Company's Reichheld retention-profit work, found a 5-percentage-point increase in retention lifts profit by 25% to 95%, a mechanism that applies to any trade where acquisition cost is front-loaded and margin arrives on the second or third visit. ServiceTitan's own 2026 Residential State of the Trades Report states the same shift in its own words: retention is now more important than acquisition for the 1,000-plus contractors it surveyed.
Equipment age gives plumbing a lifecycle signal HVAC's agreement model does not need: a U.S. Department of Energy-funded appliance-lifetime study found a median lifetime of 12.0 years for gas storage water heaters and 9.6 years for electric storage water heaters. A plumbing CRM that flags customers whose water heater is approaching that median age is running a lifecycle program off installation-date data alone, no membership platform required.
| Homeowner spending and housing signal (2026) | Figure | Source |
|---|---|---|
| Plan to repair/replace at least one home system | 79% | Housecall Pro State of Home Service Spending |
| Plan to stay in current home | 72% | Housecall Pro State of Home Service Spending |
| Spent more than USD 3,000 on home projects in 2025 | 59% | Housecall Pro State of Home Service Spending |
| Plan optional improvements in 2026 | 44% | Housecall Pro State of Home Service Spending |
| Water heater type | Median lifetime | Mean lifetime | Source |
|---|---|---|---|
| Gas storage water heater | 12.0 years | 13.9 years | DOE-funded appliance-lifetime study (OSTI) |
| Electric storage water heater | 9.6 years | 12.5 years | DOE-funded appliance-lifetime study (OSTI) |
Turning the escalation window into a membership pitch
The 51%-of-calls "getting worse" trigger is the practical target for a plumbing membership or priority-service program: proactive contact before a slow drain becomes a backed-up sewer line, or before a water heater's declining performance becomes a flood call. A retention-focused CRM cadence built around the age of the last service call captures that window without waiting for the customer to call first.
The same team building that CRM cadence typically also owns the reporting layer that flags equipment age against the 12.0-year and 9.6-year water-heater medians above, and a marketing partner can help set the segmentation rules once the data exists.
Building the plumbing lifecycle scorecard
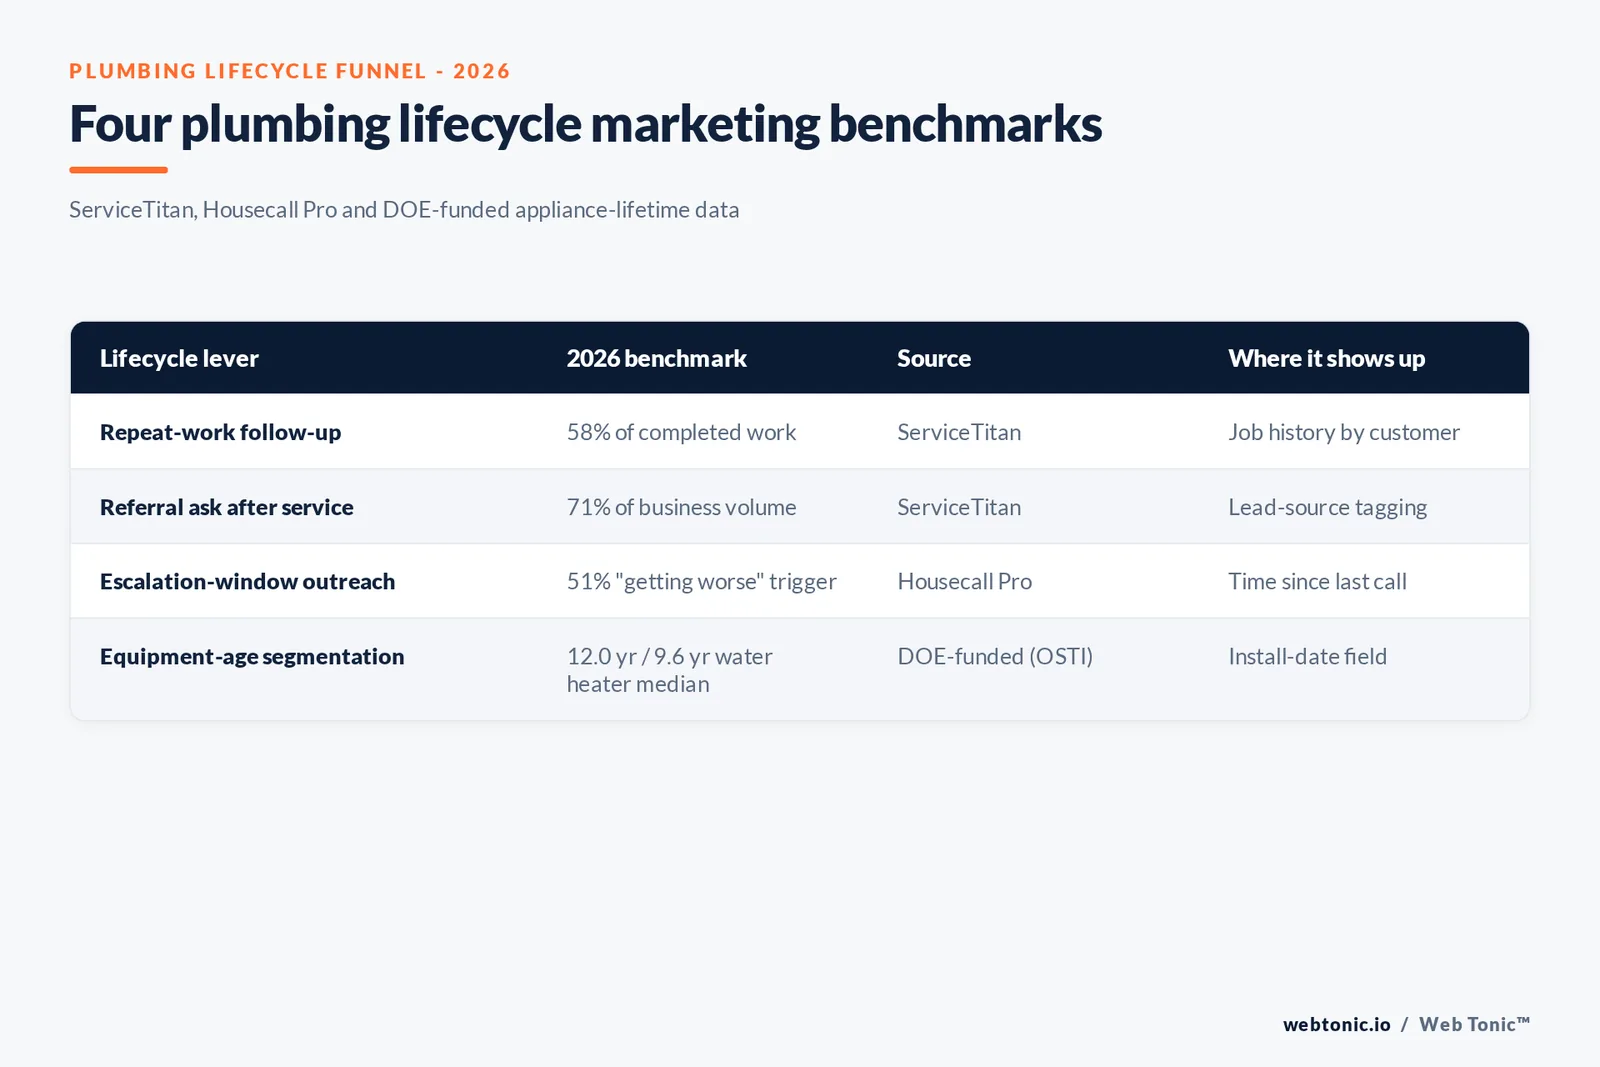
Absent a plumbing-specific ACCA-style census, the scorecard borrows from the cross-trade ServiceTitan and Housecall Pro data: repeat-work share against the 58% benchmark, referral share against 71%, repair-job share against 87%, and escalation-trigger contact rate against the 51% figure. A plumbing shop tracking none of these is managing the business on emergency-call volume alone, the least profitable and least predictable segment of the four.
| Lifecycle lever | Benchmark it moves | Primary source |
|---|---|---|
| Post-job review and referral ask | 71% referral share | ServiceTitan |
| Repeat-visit follow-up cadence | 58% repeat-work share / 39% repeat-revenue share | ServiceTitan |
| Escalation-window proactive outreach | 51% "getting worse" trigger | Housecall Pro |
| Membership / priority-service plan | 25-95% profit lift per 5-point retention gain | Bain / Reichheld |
| Repair-first dispatch triage | 87% repair job share | Housecall Pro |
What the scorecard looks like month over month
None of the four benchmarks above require new billing software, but they do require someone to pull them from job history on a schedule rather than checking once a year. A monthly view of repeat -work share against the 58% figure, referral share against 71%, and escalation-window contact rate against the 51% figure turns four static numbers into a trend line - and a trend line is what actually tells a plumbing shop whether last quarter's retention effort worked, rather than a single point-in-time snapshot that could be noise.
Water-heater age segmentation adds a fifth, more mechanical check: any customer whose unit is approaching or past the 12.0-year gas or 9.6-year electric median found in the DOE-funded study above is a candidate for a proactive inspection call, independent of whether they have called in recently. That is a lifecycle signal a subscription-billing platform cannot generate on its own - it comes from the install-date field already sitting in most plumbing dispatch software. Neither check requires waiting for an association to publish a plumbing-specific benchmark - both can be built this month from data a shop already owns, which is the honest takeaway of a category with no ACCA-equivalent census of its own.
| Monthly tracking metric | 2026 benchmark | Trend direction to watch |
|---|---|---|
| Repeat-work share of completed jobs | 58% | Rising vs. flat vs. falling quarter over quarter |
| Referral share of new business | 71% | Rising vs. flat vs. falling quarter over quarter |
| Contacts made during the escalation window | 51% of calls originate here | Share proactively reached before failure |
| Customers flagged by water-heater age | 12.0 yr gas / 9.6 yr electric median | Count reached vs. count overdue |
Frequently Asked Questions
How much of a plumbing company's revenue comes from repeat customers?
ServiceTitan's 2023 Residential Service Contractor Market Report (2022 data), a survey of more than 1,000 residential contractors across trades including plumbing, found repeat customers made up 58% of completed work and 39% of annual revenue, with word-of-mouth referrals contributing 71% of business volume. The figures are contractor-wide rather than plumbing-only, but plumbing is one of the trades sampled and the mechanism - a returning customer costs nothing to re-acquire - applies directly to drain, water-heater and leak-repair work.
Are most plumbing jobs repairs or full replacements?
Housecall Pro's 2026 State of Home Service Spending report found repairs made up roughly 87% of plumbing jobs on its platform in the quarter measured - a share nearly identical to HVAC's 88%, which suggests the repair-over-replacement pattern is structural across residential trades, not specific to one system type.
What triggers a homeowner to call a plumber in 2026?
Housecall Pro's homeowner survey of 1,100-plus U.S. respondents found plumbing was the single most-cited system homeowners plan to repair or replace in 2026, named by 28% of respondents - ahead of appliances (25%), exterior work (23%), HVAC (20%), electrical (18%) and roofing (14%). The leading trigger across systems was an active failure (58%), not a planned project (38%), meaning most plumbing calls are still reactive rather than scheduled.
Does a membership or maintenance plan change plumbing retention?
No plumbing-specific vendor study publishes a membership renewal rate the way ACCA does for HVAC, but the same underlying research applies: Bain & Company's Reichheld work found a 5-percentage-point increase in retention lifts profit by 25% to 95%, because acquisition cost is front-loaded and margin compounds on repeat visits. A plumbing membership plan is the mechanism that converts a one-off drain-cleaning customer into that repeat-visit economics.
Should a plumbing marketing budget prioritize referrals or repeat-visit follow-up?
Both, and the ServiceTitan data argues they reinforce each other: 71% referral share and 39% repeat-revenue share come from the same 1,000-contractor survey population, meaning a customer who returns for a second job is also a more likely referral source. A plumbing shop chasing only new-customer acquisition is leaving the higher-margin half of that equation unmanaged.
Sources
ServiceTitan - Residential Service Contractor Market Report (2023, 2022 data)
ServiceTitan - 2026 Residential State of the Trades Report
Housecall Pro - 2026 State of Home Service Spending Report
Bain & Company - Loyalty Rules (Reichheld retention-profit research)
OSTI (DOE-funded) - Using National Survey Data to Estimate Lifetimes of Residential Appliances


