Table of contents

No published source gives plumbing contractors a single correct percentage of revenue to budget for demand generation - but ServiceTitan's own 1,000-contractor Commercial Sales and Marketing Report and WordStream's search ad data show exactly where referral, paid and organic dollars are already landing, and how long the sales cycle actually runs before that spend pays back.
Key Takeaways
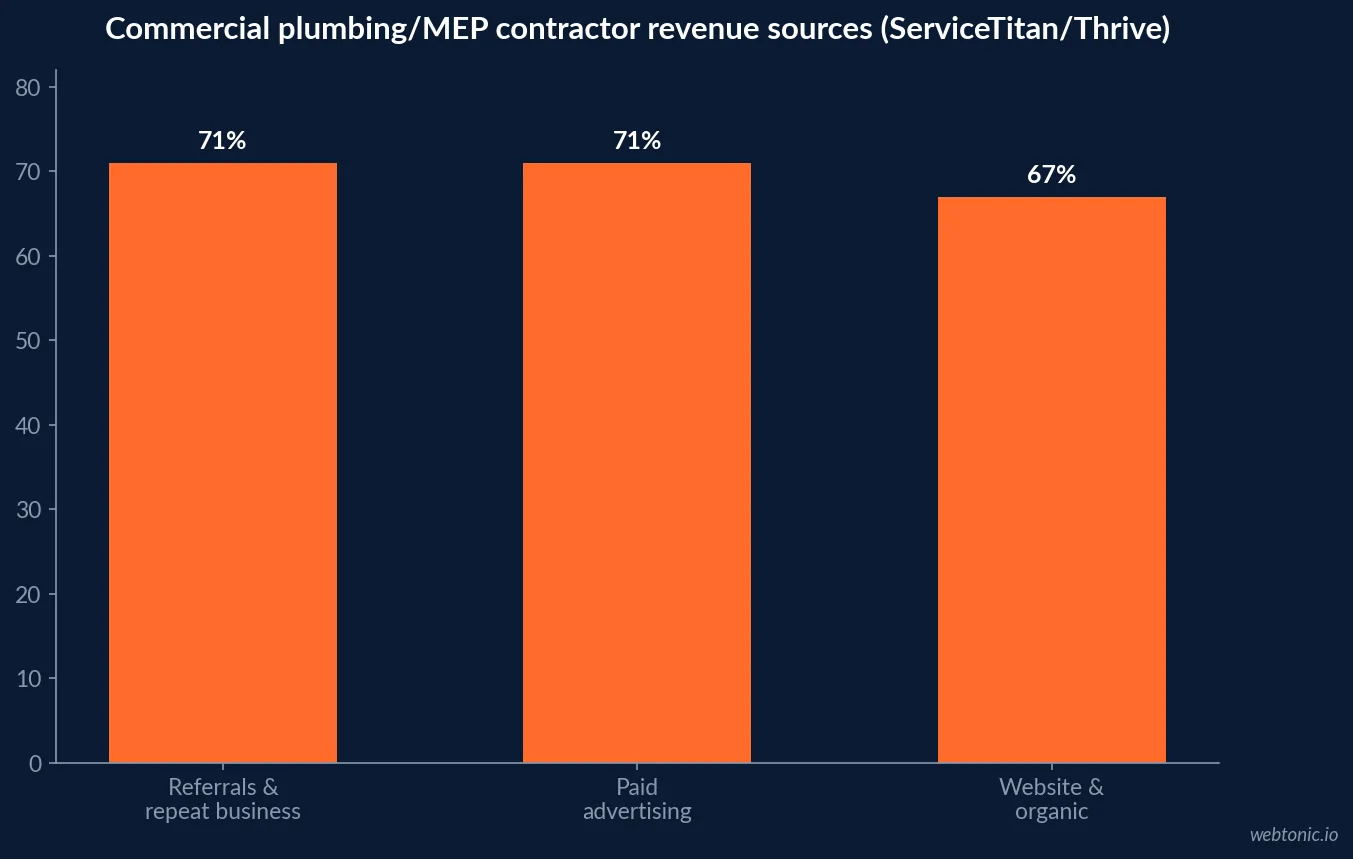
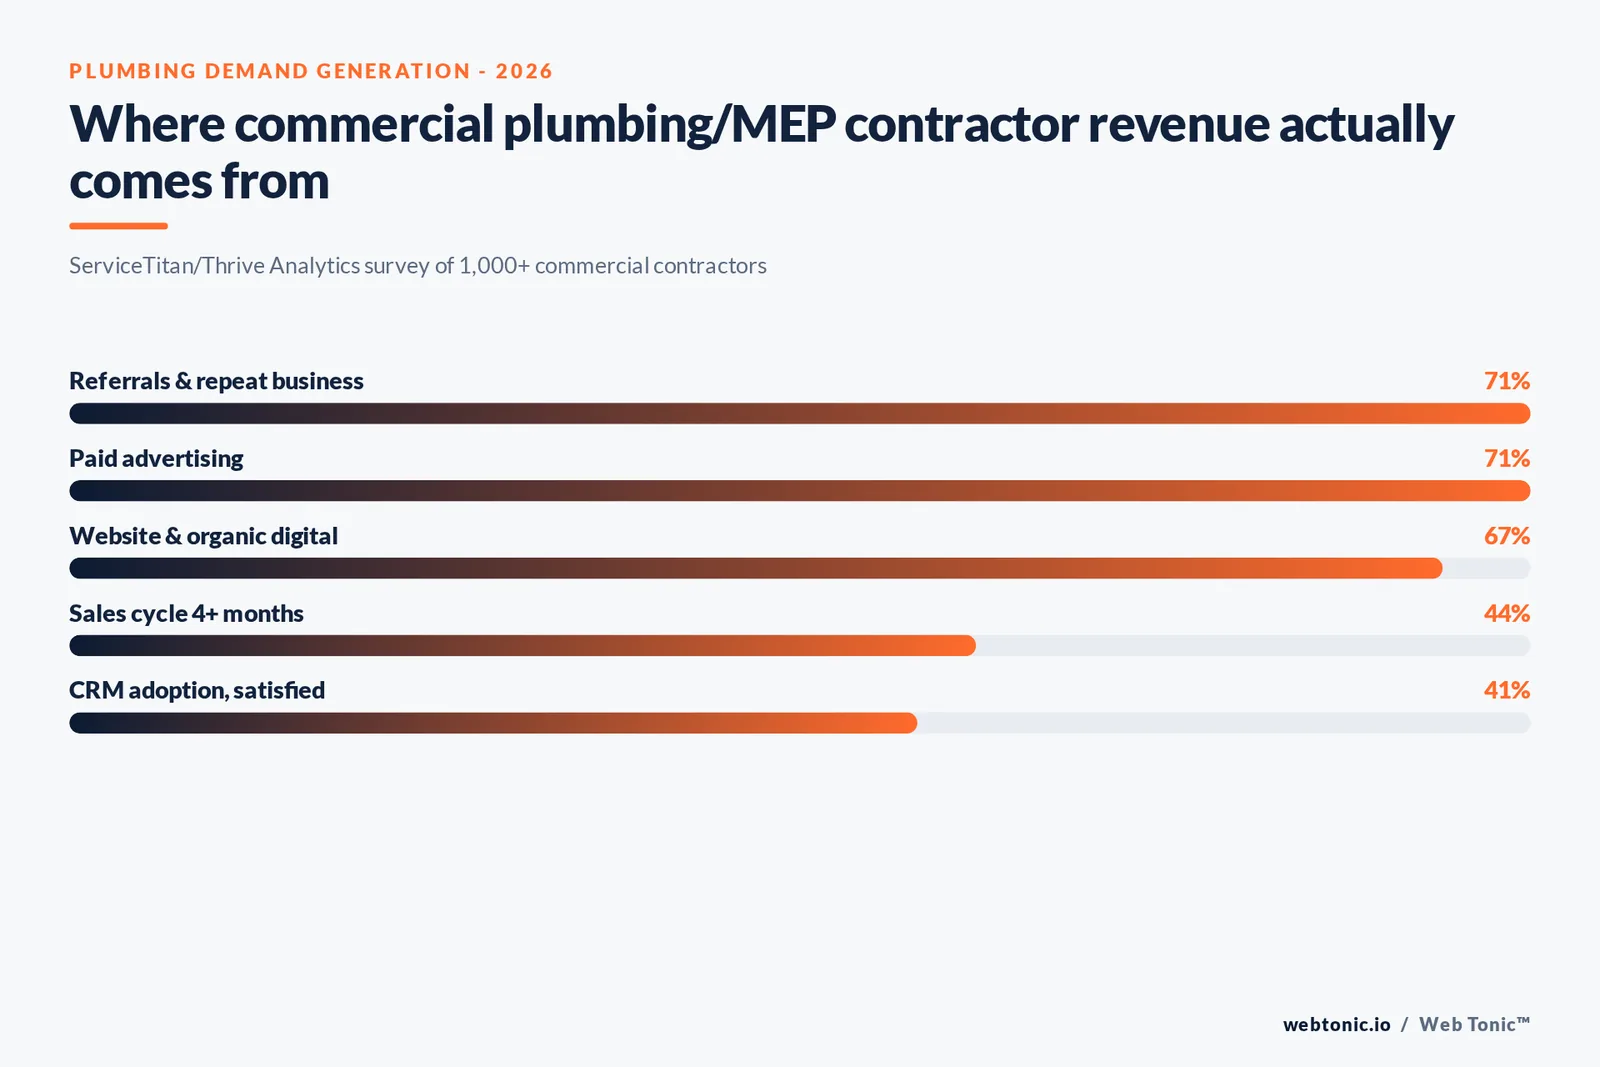
- 71% of commercial contractors (mechanical, electrical, plumbing) rely on referrals and repeat business as a crucial revenue source.
- 71% also cite paid advertising as a crucial revenue source - the two tie.
- 67% cite website and organic digital marketing.
- Top marketing priorities: brand awareness (66%), expanding digital marketing (66%), generating leads (41%).
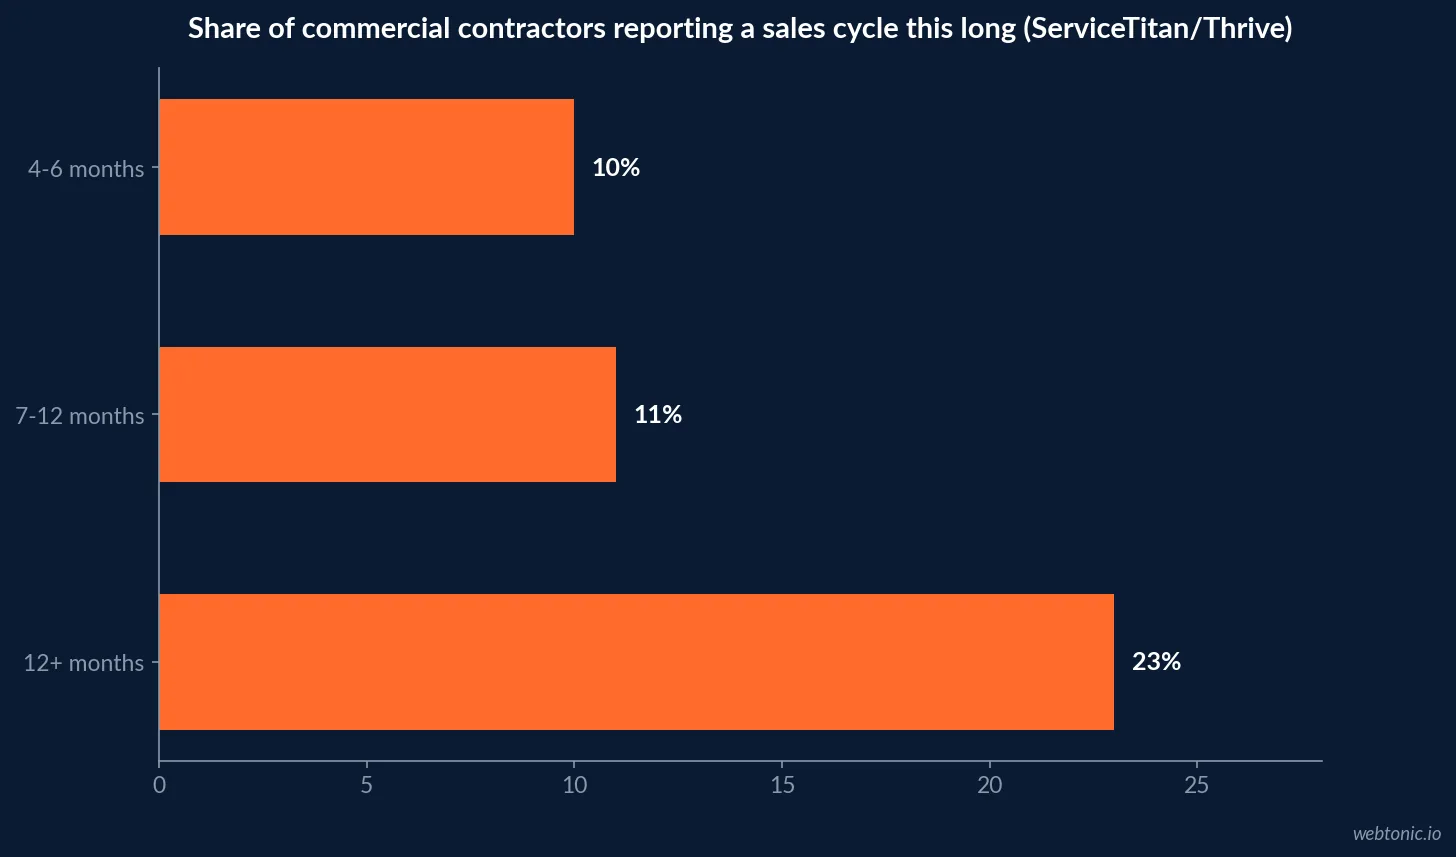
- 44% of commercial businesses report a sales cycle of four months or longer.
- 23% report a sales cycle exceeding 12 months.
- 78% of commercial contractors have adopted a CRM, but only 41% are satisfied with it.
- 57% of commercial contractors spend nearly half their time on non-selling activities.
- Average 2025 plumbing search-ad cost per lead: $129.02.
- Average plumbing search-ad conversion rate: 7.63%, above the 7.33% category average.
- Average plumbing click-through rate: 4.97%, the second-lowest of 16 home-services subcategories.
- Average plumbing cost per click: $10.49.
- Only 29% of commercial contractors currently use AI agents in the sales process.
- Among AI users, 58% apply it to sales content and personalization.
- Cross-trade reference point (HVACR, ACCA): 12%+ of revenue on marketing links to 9% net profit vs. 5% below that threshold.
Where plumbing and commercial-trade revenue is actually reported to come from
ServiceTitan's first annual Commercial Sales and Marketing Report, conducted by Thrive Analytics across more than 1,000 commercial sales and marketing contractors primarily in mechanical, electrical and plumbing, found the majority rely on referrals and repeat business (71%) and paid advertising (71%) as a crucial source of revenue, with website and organic digital marketing (67%) close behind. No single channel dominates the reported mix - the three sit within four points of each other, which is itself the clearest published argument against betting a plumbing demand-gen budget on one channel alone.
| Revenue source cited as crucial (ServiceTitan/Thrive, n=1,000+ commercial contractors) | Share citing it |
|---|---|
| Referrals & repeat business from existing customers | 71% |
| Paid advertising | 71% |
| Website & organic digital marketing | 67% |
| Increasing brand awareness (top marketing priority) | 66% |
| Expanding digital marketing initiatives (top marketing priority) | 66% |
| Generating leads (top marketing priority) | 41% |
What one plumbing search-ad lead costs today
LocaliQ's 2025 Home Services Search Ads Benchmarks put the average plumbing cost per lead at $129.02, with a 7.63% conversion rate - above the 7.33% home-services average - and a $10.49 cost per click. Plumbing's click-through rate, at 4.97%, is the second-lowest of the 16 home-services subcategories LocaliQ tracks, meaning fewer of the impressions convert to a click, but a larger share of the clicks that do land go on to convert. That combination argues for tighter keyword and ad-copy targeting over broad reach, if paid search is the channel being budgeted.
| 2025 plumbing search-ad benchmark | Plumbing | Home services average |
|---|---|---|
| Click-through rate | 4.97% | n/a (subcategory-level only) |
| Cost per click | $10.49 | $7.85 |
| Conversion rate | 7.63% | 7.33% |
| Cost per lead | $129.02 | $90.92 |
Why the sales cycle length changes how a budget should be judged
The same ServiceTitan/Thrive report found 44% of commercial businesses report a typical sales cycle of four months or longer - 10% at 4-6 months, 11% at 7-12 months, and 23% exceeding 12 months. A demand generation budget evaluated on a 30- or 60-day payback window will look like it is underperforming against a sales cycle that routinely runs a year, which is a measurement-window problem more than a spend-level problem. On top of that, 57% of commercial contractors report spending close to half their time on non-selling activities, which slows how fast a generated lead actually gets worked.
The CRM and measurement gap sitting under every budgeting decision
78% of commercial contractors surveyed have adopted a CRM, but only 41% report being satisfied with it - 37% cite a lack of industry-specific features, 29% cite high cost, and 22% cite limited reporting capabilities. A CRM that cannot cleanly report source-of-lead data makes any channel-mix budgeting decision a guess dressed up as a number. AI adoption in the sales process is still early - only 29% of respondents use AI agents at all, and among those that do, the leading uses are sales content and personalization (58%), lead scoring and qualification (43%), and automating CRM data entry (43%).
| CRM and process gap (ServiceTitan/Thrive, commercial contractors) | Figure |
|---|---|
| CRM adoption | 78% |
| Satisfied with current CRM | 41% |
| Cite lack of industry-specific CRM features | 37% |
| Cite high CRM cost | 29% |
| Cite limited CRM reporting | 22% |
| Currently use AI agents in the sales process | 29% |
Why the commercial plumbing buying pattern looks closer to B2B
Commercial and mechanical-electrical-plumbing (MEP) buying decisions typically involve a facility manager, a budget owner and sometimes a general contractor - closer to a B2B purchase than a homeowner calling about a leak. Demand Gen Report's 2024 B2B Buyer's Survey - a cross-industry benchmark, not a plumbing-specific study - found the modern B2B purchase involves an average of six to ten decision-makers across multiple departments, and that 26% of organizations are now including more people in the decision process while 20% are spending more time researching before committing. ServiceTitan's own 44% figure for commercial sales cycles of four months or longer is consistent with that broader B2B pattern, even though the Demand Gen Report figures themselves describe general B2B purchasing, not plumbing specifically.
| Buying committee signal | Figure | Source |
|---|---|---|
| Typical B2B decision-makers involved (cross-industry) | 6 to 10 | Demand Gen Report 2024 B2B Buyer's Survey |
| Organizations including more people in the decision | 26% | Demand Gen Report 2024 B2B Buyer's Survey |
| Organizations spending more time researching | 20% | Demand Gen Report 2024 B2B Buyer's Survey |
| Commercial contractors with a 4+ month sales cycle | 44% | ServiceTitan / Thrive Analytics |
Why nonresidential work skews the plumbing demand-gen mix toward B2B tactics
IBISWorld data, cited in ServiceTitan's Plumbing Industry Statistics roundup, values the U.S. plumbing market at approximately $121.5 billion, with revenue that has actually declined at a 2.1% CAGR over the past five years even as related segments like plumbing fixtures ($107.62 billion globally, growing at a 7.8% CAGR) and plumbing pipes (growing at a 14.69% CAGR through 2028) expand. The same data shows nonresidential construction - hotels, stores, warehouses, office buildings - makes up just over two-thirds of the US plumbing industry's revenue. That single figure is the strongest published argument for why a plumbing contractor's demand generation plan cannot look purely residential: most of the category's dollars sit inside exactly the longer, multi-stakeholder commercial buying pattern described above, not the single-decision-maker homeowner call.
| Plumbing industry context (IBISWorld, via ServiceTitan) | Figure |
|---|---|
| U.S. plumbing market size | ~$121.5 billion |
| 5-year revenue CAGR | -2.1% |
| Nonresidential construction share of industry revenue | ~67% ("just over two-thirds") |
| Global plumbing fixtures & fittings market | $107.62 billion, +7.8% CAGR to 2028 |
| Plumbing pipes industry growth | +14.69% CAGR to 2028 |
Put simply: a plumbing contractor doing meaningful commercial volume is not really running one demand generation program, but two running in parallel - a fast, trigger-driven residential program built around speed-to-lead and call handling, and a slower, multi-stakeholder commercial program built around relationships, referrals from general contractors, and content that survives a longer evaluation window. Budgeting the two the same way, off the same monthly cost-per-lead spreadsheet, is one of the more common and avoidable mistakes the data above points to.
Setting the budget without an invented percentage
The honest answer to "what should a plumbing contractor budget for demand generation" is that no cited source publishes one universal number - the closest adjacent cross-trade reference is ACCA's HVACR finding that 12%+ of revenue on marketing links to 9% net profit versus 5% below that line, which should be read as directional, not a plumbing-specific rule. What is well documented for plumbing and its commercial-trade neighbors is the channel split (referrals, paid and organic within four points of each other), the real cost of a paid-search lead ($129.02), and a sales cycle long enough that budgets need to be judged over quarters, not weeks. Our growth marketing practice builds that mix and payback model against a contractor's own numbers, and our data and analytics practice fixes the CRM reporting gap first; talk to us for a plan sized to your CRM data, not an industry-wide average.
Frequently Asked Questions
Is there a single percentage-of-revenue figure plumbing contractors should budget for demand generation?
No single figure is published specifically for plumbing, and any page claiming one exact number should be read skeptically. The closest adjacent benchmark is ACCA's Contractor of the Future study (HVACR contractors, a closely related trade): average marketing spend of 6% of revenue, with contractors investing 12%+ reporting 9% net profit versus 5% for the rest. Treat that as a directional cross-trade reference, not a plumbing-specific rule, when setting a budget.
Where does plumbing contractor revenue actually come from, by channel?
ServiceTitan's first annual Commercial Sales and Marketing Report, fielded by Thrive Analytics across more than 1,000 commercial contractors in mechanical, electrical and plumbing, found the majority rely on referrals and repeat business from existing customers (71%) and paid advertising (71%) as a crucial revenue source, followed by website and organic digital marketing (67%). All three matter; none is reported as sufficient alone.
How competitive is paid search specifically for plumbing leads?
LocaliQ's 2025 Home Services Search Ads Benchmarks put the average plumbing cost per lead at $129.02, with a 7.63% conversion rate and a $10.49 cost per click - plumbing has the second-lowest average click-through rate (4.97%) of the 16 home-services subcategories tracked, but a conversion rate above the $90.92-CPL category average, meaning clicks that do land tend to convert reasonably well.
How long is a typical plumbing sales cycle, and why does that matter for budgeting?
For the commercial segment specifically, ServiceTitan's report found 44% of businesses report a typical sales cycle of four months or longer (10% at 4-6 months, 11% at 7-12 months, 23% exceeding 12 months). A demand generation budget built around a 30-day payback expectation will look like it is failing against a sales cycle that is actually this long - the budgeting error is often a measurement-window error, not a spend-level error.
What is the biggest reported gap between plumbing/commercial contractor CRM investment and CRM results?
ServiceTitan's report found 78% of commercial contractors have adopted a CRM, but only 41% report being satisfied with it - 37% cite a lack of industry-specific features, 29% cite high cost, and 22% cite limited reporting. That gap matters for demand generation because a CRM that cannot report clean source-of-lead data makes any channel-mix budgeting decision a guess rather than a read of real numbers.
Sources
ServiceTitan - Commercial Sales and Marketing Report (Thrive Analytics)
LocaliQ - 2025 Search Ad Benchmarks for Home Services
WordStream - Google Ads Benchmarks 2025
ACCA - Inside the Contractor of the Future Study
Invoca - Home Services Lead Conversion Benchmarks Report 2026
Demand Gen Report - Rethinking Buyer Engagement in Modern B2B Marketing (2024 B2B Buyer's Survey)
ServiceTitan - Plumbing Industry Statistics (IBISWorld)