Table of contents
Plumbing is a $191.4 billion US market with roughly 129,000 businesses and no company holding more than 5% share. Nobody wins it on scale, so the fight is memory: which name a homeowner recalls when water is on the floor. Below are the branding numbers worth budgeting against in 2026 — and the ones that are softer than they look.
Key Takeaways
- Consistent brand presentation is associated with roughly 23% higher revenue (later research says up to 33%), yet only about 25% of companies enforce their own brand guidelines.
- Plumbing top-3 Google Maps businesses carry a median 1,343 reviews at a 4.79 median rating — the second most review-competitive trade after HVAC.
- 76.6% of local service businesses already sit at 4.8 stars or higher, so rating is table stakes; velocity is the edge.
- More than half of consumers pick a home services provider within four hours, and 90% expect a response inside 24 hours.
- 88% would choose a business that replies to all reviews, versus 47% for one that never replies.
- Realistic asset costs: logo $300–$1,500, partial wrap $1,500–$2,500, full wrap $2,000–$5,000.
The Market Your Brand Is Competing In
Branding advice is worthless without the industry context. Plumbing is huge, fragmented and margin-thin at the median, which is exactly the profile where recognition compounds.
| Benchmark | 2026 figure | Why it matters to branding |
|---|---|---|
| US market size | $191.4B (3.1% five-year CAGR) | Large enough that local memory, not scale, decides winners |
| Businesses | ~129,000 | No company above 5% share — recognition is winnable locally |
| Firms under five employees | ~74% | Most competitors have no brand system at all |
| Median net margin | 2–8% | Top performers run 20–35%; pricing power follows trust |
| Gross margin band | 45–65% | Well-branded operators sit at the upper end |
| Urgent service calls | 70–80% | Decisions are fast and memory-driven, not researched |
| Segment mix | Residential $68.9B / commercial $56.2B | Two audiences, two brand registers |
Fast decisions are the whole argument for brand investment: 71% of homeowners calling about a burst pipe or sewage backup book with the first contractor who answers, regardless of price. Under those conditions, branding is not decoration — it is what makes yours the number they dial first. For the search side of the same problem, see our plumbing SEO statistics.
What the Brand Consistency Research Really Says
Almost every branding statistic in circulation traces to two sources published between 2016 and 2021. They are useful and widely quoted; they are also marketer surveys, so quote them with the scope attached.
| Claim | Figure | Source scope |
|---|---|---|
| Revenue lift from consistent presentation | ~23% | Demand Metric / Lucidpress survey, 2016 |
| Upper revenue estimate | up to 33% | Lucidpress update, 2019 |
| Credit consistency with 10–20% of growth | 68% of respondents | Lucidpress survey, 2021 |
| Companies dealing with off-brand content | 81% | Same research programme |
| Companies enforcing guidelines consistently | ~25% | Brand governance research |
| Revenue loss from inconsistency | ~23% | Same dataset, inverted framing |
The honest read: the effect direction is well supported, the magnitude is not measured the same way twice, and the enforcement gap is where plumbing companies actually lose. If only a quarter of companies with guidelines enforce them, a truck, a shirt, an invoice and a Google profile that all match is a genuine local differentiator.
How Homeowners Judge a Plumbing Brand
Brand perception in this trade is assembled from reviews, response speed and physical presence long before anyone reads your tagline.
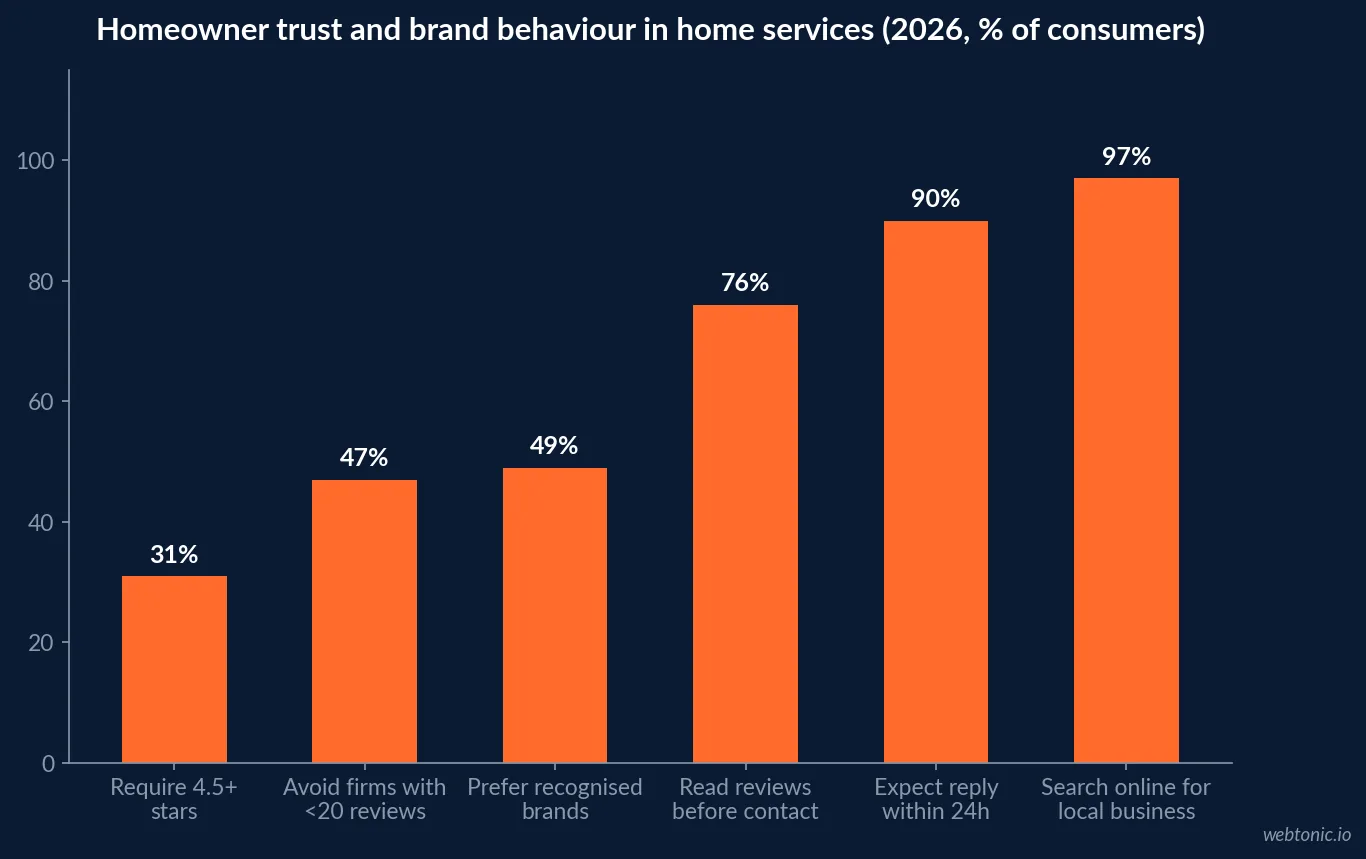
- 97% of consumers search online for local businesses, and 76% read reviews before contacting a home service business.
- 92% consider reviews before hiring, and 81% use Google to read them.
- 47% will not use a business with fewer than 20 reviews; 31% require 4.5 stars or better.
- 88% would choose a business that responds to all reviews against 47% for one that responds to none.
- 36% consult two review sites and 41% use three or more, so consistency across platforms is itself a trust signal.
- 49% say they prefer buying from brands they recognise, and 45% now use generative AI tools for local recommendations.
Review Volume Is the Hard Brand Metric
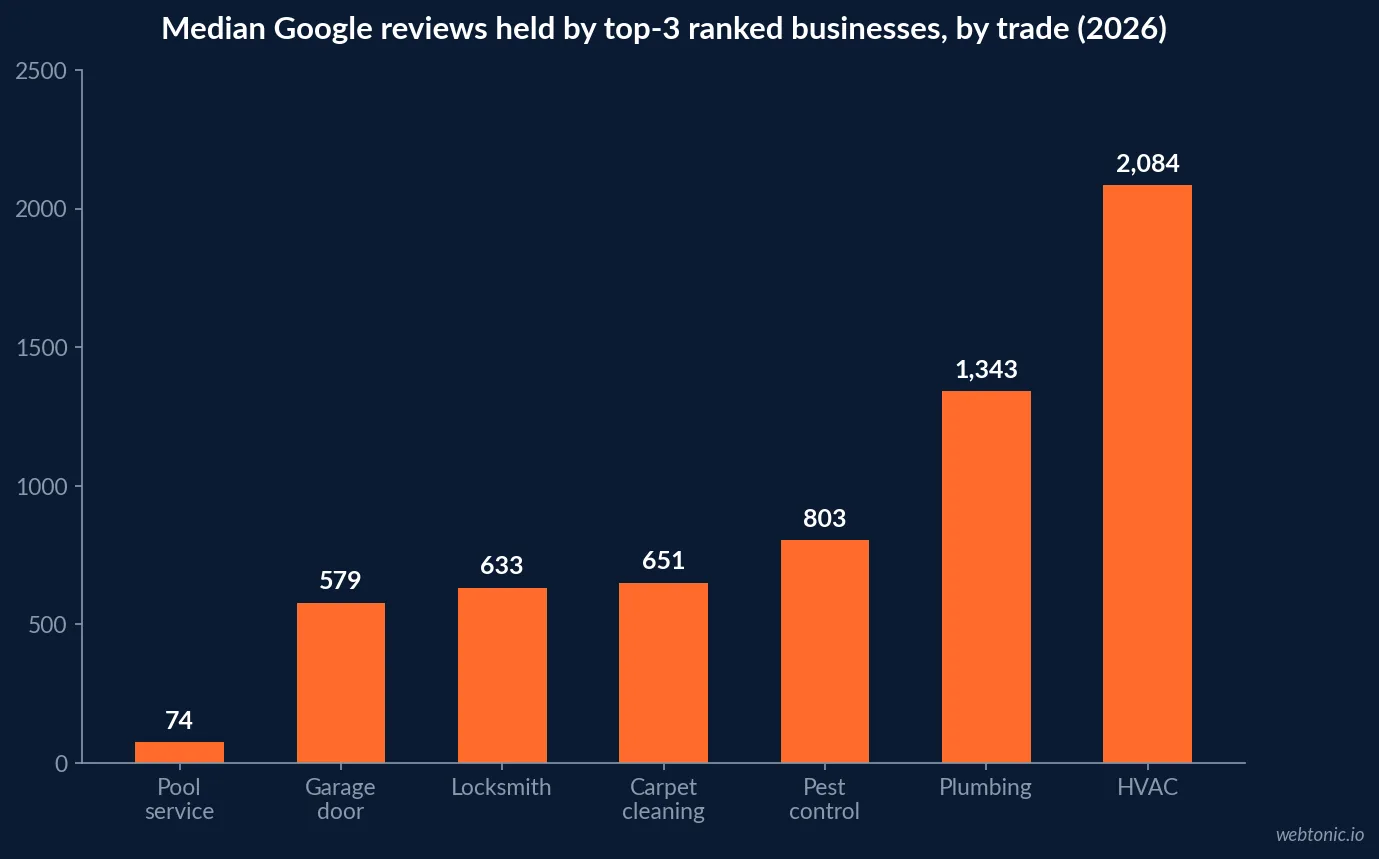
Reviews are the only brand asset with a published competitive threshold. A 2026 study of 7,481 businesses across 25 US cities measured the median review count of the current top-3 Google Maps results by trade.
| Trade | Median reviews of top 3 | Median rating |
|---|---|---|
| HVAC | 2,084 | 4.84 |
| Plumbing | 1,343 | 4.79 |
| Pest control | 803 | 4.83 |
| Carpet cleaning | 651 | 4.87 |
| Locksmith | 633 | 4.80 |
| Garage door | 579 | 4.91 |
| Pool service | ~74 | — |
Two structural facts change how you spend. First, the typical business holds only 165 reviews while 23% hold 500 or more — the distribution is brutally skewed. Second, position is not purely count: map-pack leaders in local service categories typically earn 1 to 3 new reviews per week, and a shop with 30 reviews and 10 in the last 90 days routinely outranks one with 150 and none in 18 months. Set a target of 2 to 4 new reviews weekly above a 4.5 average and treat it as a brand KPI, not a marketing chore.
Colour and Visual Identity: Useful, Overstated
Blue owns plumbing for two reasons: it maps to water, and it is the most trusted colour in branding research, preferred by 57% of men and 35% of women. The widely repeated statistics around colour are lab and survey findings, so use them as guardrails.
| Claim | Figure | How to use it |
|---|---|---|
| Brand recognition attributable to colour | up to 80% | Lock one primary colour across every surface |
| Buyers naming colour a main selection factor | 85% | Do not let a rebrand change your recognised colour |
| Snap judgements based on colour | ~90% | Prioritise legibility on wraps and signage |
| Blue-dominant sites and phone conversion | reported +40% | Directional; test your own call CTAs |
| Palette weighting rule | 60/30/10 | Primary, secondary, accent for CTAs |
The practical constraint nobody quotes is physics: identity has to hold at highway speed on a moving van and still read on a 40mm phone icon. That is why the highest-performing plumbing marks are a short wordmark, one dominant colour, and a phone number at 60% to 70% of the height of the name — the only element on the vehicle that makes the phone ring.
What a Plumbing Brand Package Costs
Realistic 2026 pricing, in the order that returns money fastest.
| Asset | Typical cost | Notes |
|---|---|---|
| Freelance logo (vector files) | $300–$1,500 | Sweet spot; includes print-ready SVG |
| DIY logo generator | $0–$100 | Usually PNG only; $150–$300 to redraw for a sign shop |
| Full van wrap | $2,000–$5,000 | Highest-return surface |
| Partial van wrap | $1,500–$2,500 | Best value for a first truck |
| Yard signs, shirts, badges | ~$500 | Ties the person at the door to the van |
| Worked package | ~$4,000 over five years | Logo, partial wrap, shirts and signs |
The payback math is unglamorous and convincing: with residential tickets commonly $300 to $600 and a drain clear at $175 to $400, two or three jobs a month traced to "I saw your truck" cover a $4,000 package many times over. Contractors also have a spend benchmark to check against — marketing at 5% to 10% of gross revenue, where below 5% is under-investment and sustained above 12% signals broken unit economics.
Where Brand Meets Paid Acquisition
Recognition is not a soft metric once you buy leads. A recognised name lowers what you pay for the same job because more people search for you by name and more of your leads convert on the phone.
| Channel | Typical plumbing cost per lead | Brand dependency |
|---|---|---|
| Google Local Services Ads | $53 (43.9% book rate) | High — badge, reviews and response speed decide the match |
| Meta Ads | ~$45 | High — creative recall does the work |
| Performance Max | $82 | Medium |
| Shared marketplaces (Angi etc.) | $85, weak close rates | Low — brand is stripped out |
| Non-branded Google Search | $183 | Medium — landing page trust signals matter |
| Referral / repeat | ~$0 | Entirely brand-driven |
That spread is the business case: the cheapest lead in the table is the one your brand already earned. Everything else is rented attention. If you are building the paid side alongside the brand, our growth marketing team and Google Ads specialists work the same funnel.
A 90-Day Plumbing Brand Checklist
- Weeks 1–2: settle the identity — one wordmark, one primary colour, vector files, and a positioning line that does not sound like every competitor.
- Weeks 2–4: apply it to the highest-return surfaces first: wrap, yard signs, uniforms, invoices. Print a $5 test proof before a $400 batch.
- Weeks 3–6: align every digital surface — Google Business Profile category set to "Plumber", same name, same photos, licence number visible.
- Weeks 4–12: run the review engine: ask after every job, reply to all reviews inside 24 hours, hold 2 to 4 new reviews per week above 4.5 stars.
- Ongoing: measure branded search volume, call answer rate and share of revenue from repeat and referral. Those three move together, and they are what the 23% consistency figure looks like in a real P&L.
Track it in one place rather than by anecdote — see our data intelligence services.
Residential and Commercial Need Two Brand Registers
The same logo has to sell to a homeowner at 11pm and to a property manager on a Tuesday morning. Residential plumbing services are a $68.9 billion segment and commercial $56.2 billion, with new construction adding $16.1 billion — and the trust cues barely overlap.
| Brand element | Residential emphasis | Commercial emphasis |
|---|---|---|
| Primary proof | Reviews, star rating, neighbourhood presence | Licences, bonding, certifications |
| Response promise | Answer now — 70–80% of calls are urgent | Scheduled SLA and reporting |
| Visual weight | Wrap, yard signs, uniforms | Proposal documents, capability pages |
| Ticket reference | $300–$600 typical job | $1,200–$15,000 per ticket |
| Retention driver | Memory and recognition | Contract terms and reporting cadence |
Practical implication: keep one visual identity, split the messaging. A commercial capability page that leads with review count reads as consumer-grade to a facilities buyer, and a residential landing page that leads with bonding capacity means nothing to a homeowner with a flooded basement.
Brand Metrics Worth Reporting Monthly
- New reviews per week against the 2–4 target, and 90-day velocity, not lifetime count.
- Review response rate — the gap between 88% and 47% consumer preference lives here.
- Branded search volume, the cleanest proxy for whether recognition is compounding.
- Share of revenue from repeat and referral, the zero-cost end of the lead table.
- Call answer rate, because the first contractor to answer wins 71% of emergency jobs.
- Marketing as a share of revenue, held inside the 5–10% band.
None of these require new software, and together they turn "branding" from a taste argument into a set of numbers a plumbing owner can defend.
Frequently Asked Questions
Does branding actually increase revenue for a plumbing company?
The most-cited research links consistent brand presentation to a revenue increase of about 23%, with a later update putting it as high as 33%, and 68% of surveyed companies credited consistency with 10% to 20% of their revenue growth. Treat those as directional survey findings, not causal proof. The harder plumbing-specific number is margin: IBISWorld-based reporting puts gross margins at 45% to 65%, and well-branded operators sit at the top of that band while median net margins run only 2% to 8%.
How many Google reviews does a plumber need to rank in the map pack?
In a 2026 study of 7,481 businesses across 25 US cities, the median review count of the current top-3 Google Maps businesses was 1,343 for plumbing — second only to HVAC at 2,084. Plumbing's median rating is 4.79, and 76.6% of all sampled businesses already hold 4.8 stars or higher, so rating is table stakes and volume plus recency is the differentiator.
What should a plumbing company spend on a logo?
A usable freelance logo runs $300 to $1,500 with print-ready vector files. Cheap generators typically export low-resolution PNGs, so a sign shop needs the mark redrawn for another $150 to $300. Against a $10,000 to $50,000 startup budget, a four-figure logo is a rounding error — but it only earns money once it appears on a wrap, signage and uniforms.
Which brand assets pay back fastest in plumbing?
In order of return: the van or truck wrap (a full wrap runs $2,000 to $5,000, a partial $1,500 to $2,500), yard signs at active jobs, uniforms and ID badges so the person at the door matches the van, then invoices, door hangers and finally the website header and Google Business Profile.
What colours do plumbing brands use, and does it matter?
Blue dominates because it reads as water and as trust, and it is the most preferred colour in branding research. Widely cited studies attribute up to 80% of brand recognition to colour and report 85% of buyers naming colour as a main selection factor. These are survey and lab findings, so use them to avoid an unreadable palette rather than to predict revenue.
Sources
Simpro — plumbing industry statistics 2026
CallJolt — plumbing revenue, jobs and market data
PlumbingSEO.agency — plumber income and market benchmarks
Smarfle — Google review benchmarks by industry
RepuClinic — review benchmarks for local service businesses
Plumbing Growth — building a plumbing brand in 2026
Mujgos — plumbing logo and brand asset costs
Cube Creative — colour psychology in home service branding
DashoContent — brand consistency statistics and sourcing
Elev8 Operations — contractor marketing statistics 2026