Table of contents

X is the cheapest large-scale reach in paid social and the worst place in social to be discovered by a shopper. For a phone or tech retailer that combination has exactly one high-value use: the hours around a launch, when the entire category is already arguing about specifications in public.
Key Takeaways
- Reported X CPM spans $2.09 to $6.46 depending on dataset.
- Reported X CPC spans $0.18 to $2.00 by targeting competitiveness.
- Median CPA benchmarks sit at $18.50–$21.55.
- Median cost per engagement is $0.03–$0.13.
- X CPC of $0.74 compares with Meta at $1.41.
- Awareness CPMs of $4–$8 compare with Meta's $8–$18.
- X captures only 0.2% of global digital ad spend.
- Monthly users are reported between 388M and 611M.
- Daily active users are about 251 million.
- Advertising reach is roughly 557.5 million.
- The audience is 63.7% male globally.
- 25–34 is the largest age group at 37.5%.
- 82% of X traffic is mobile.
- About 500 million posts are published daily.
- The algorithmic feed generates 78% of all impressions.
- Only 16% of social users use X for product discovery.
- 63% of X users are there for news and current events.
- X users are 32% more likely to try new products than non-users.
- Only 4% of marketers rate X ads brand safe.
- 29% of marketers plan to cut X spend in the coming year.
- Average reported ROI is $2.70 per dollar spent.
The cost picture, and why sources disagree by 3x
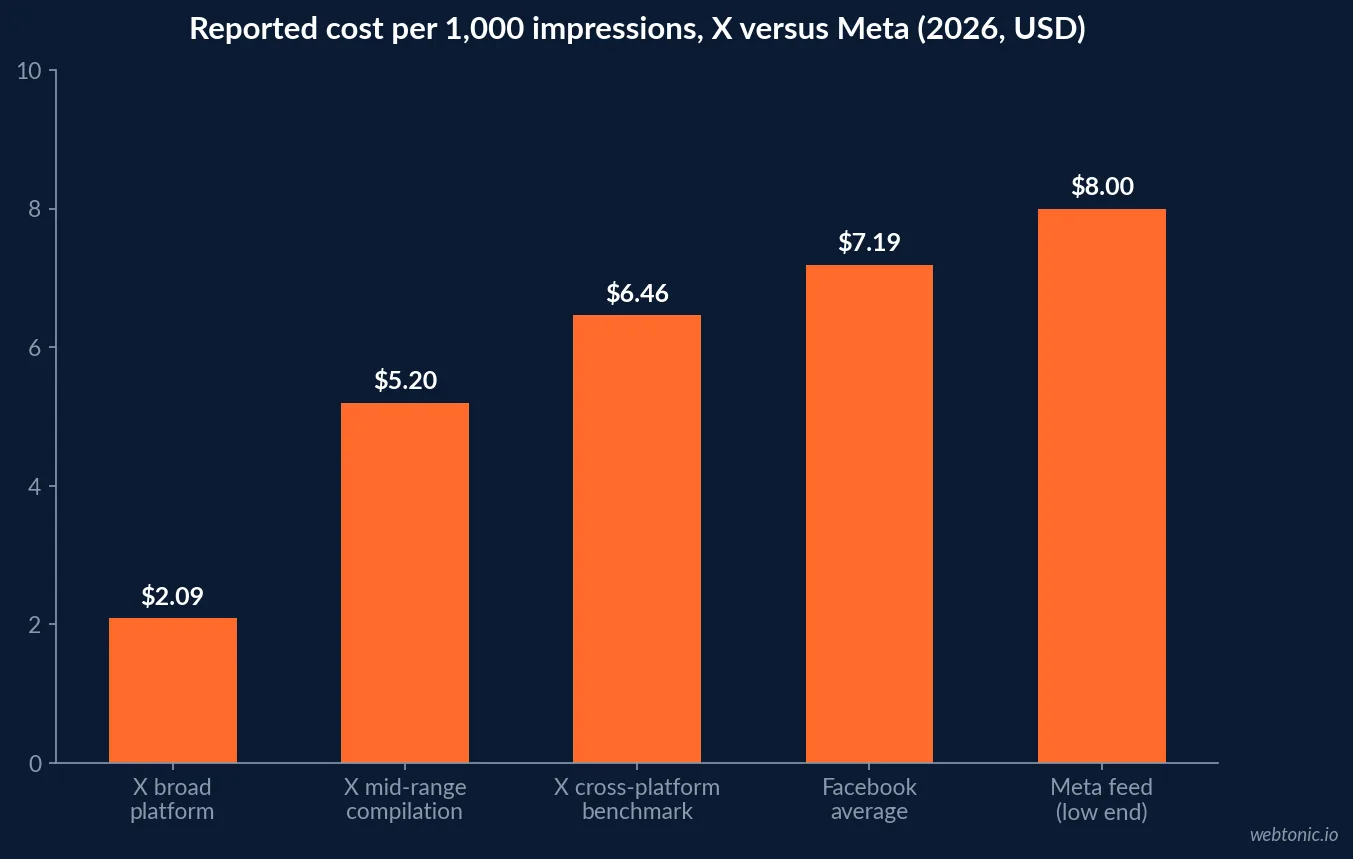
Nothing about X pricing is settled, so publish the scope alongside the number. The spread below is not measurement error — it is the difference between broad awareness inventory and competitive tech-audience targeting.
| Dataset / scope | CPM | CPC | CPA | What is being counted |
|---|---|---|---|---|
| Broad platform median | $2.09 | $0.18 | $21.55 | All objectives, heavy awareness mix |
| Mid-range compilation | $5.20 | $0.85 | $18.50 | Mixed objectives, 2.1% CVR |
| Cross-platform benchmark | $6.46 | $0.74 | — | Compared against Meta CPC $1.41, CPM $7.19 |
| Practitioner ranges | $4–$8 | $0.50–$2.00 | — | Awareness CPM; CPE $0.03–$0.20 |
| Competitive tech targeting | — | $0.75–$2.00 | — | Finance, SaaS, tech decision-makers |
| Timeline Takeover | flat buy | — | — | From $25,000+ per day |
Two structural facts explain the floor. X captures only 0.2% of worldwide digital ad spend — against 14.6% for Facebook and 7.1% for TikTok and Douyin — so the auction is thin. And one practitioner case documented 9 million impressions for $4,000 at roughly $0.44 CPM, with 77,600 clicks at $0.27. Prices that low are a symptom of advertiser absence, not of superior efficiency.
The audience: right ages, wrong intent
Demographically X looks promising for device retail. Behaviourally it does not. SocialNexis reports 251 million daily active users, an ad audience that is 63.7% male, and age concentration in the two brackets that buy the most handsets.
| Audience attribute | Value | Relevance to phone & tech retail |
|---|---|---|
| 25–34 share of ad audience | 37.5% | Peak flagship and financing bracket |
| 18–24 share | 32.1% | Mid-range, refurbished, accessories |
| Under 35 combined | ~70% | Aligns with the category's core buyer |
| Male share | 63.7% | Skews with historical tech-spec engagement |
| Mobile share of traffic | 82% | Creative must be phone-first by default |
| US $70–99k household share | 26% | Plus 25% above $100k — real purchasing power |
| Product discovery usage | 16% | The problem: Instagram is 61%, Facebook 60% |
| Primary use case | 63% news and current events | Buy the moment, not the browse |
Enrich Labs is blunt about the discovery gap: 16% of social users turn to X for product discovery, and only 5.5% of marketers use it for influencer campaigns. Against that, The Global Statistics documents X users as 32% more likely to try new products and 39% more likely to purchase advertised products than non-users. Both are true: intent is low in aggregate and high in context.
Launch day is the use case
Smartphone launches are one of the few consumer events that still happen live on X. Keynotes, leaks, pre-order queues, teardowns and complaint threads all run in real time, and roughly 500 million posts a day pass through the platform. That is the window where keyword and conversation targeting outperforms interest targeting anywhere else.
| Launch-window tactic | Why it works on X | Cost signal |
|---|---|---|
| Keyword targeting on model names | Intent is expressed in plain text, in the hour it forms | CPC $0.75–$2.00 in contested tech terms |
| Conversation targeting around keynotes | Buys the audience already watching | Awareness CPM $4–$8 |
| Trade-in and pre-order offer replies | Answers the question being asked publicly | CPE $0.03–$0.13 |
| Video under 15 seconds | Video outperforms static by 2–3x on engagement | Video-view CPM $3–$6 |
| Timeline Takeover on launch day | Category-level share of voice for 24 hours | $25,000+ flat |
| Retargeting site visitors post-launch | Recovers the research-then-compare path | CPA median $18.50–$21.55 |
True Interactive reports average X ROI at $2.70 per dollar spent — roughly 40% above the cross-media average but below social media averages — with the strongest returns in time-sensitive, culturally resonant campaigns. That is precisely the launch scenario, and precisely not the always-on catalogue scenario. Creative discipline matters more here than budget; our performance creative team treats these as news assets, not evergreen ads.
The platform risk you are underwriting
Cheap inventory has a cause. SocialPilot and industry reporting put the trajectory plainly.
| Indicator | 2022 baseline | 2025–2026 | Direction |
|---|---|---|---|
| Annual revenue | $4.4B | ~$2.6B (2024) | Down more than 40% |
| Advertising revenue | $4.5B (2022) | $1.8–2.26B | Recovering slowly, +7–16.5% |
| Peak ad revenue reference | $4.51B (2021) | — | Roughly half of pre-acquisition scale |
| Marketers rating X brand safe | — | 4% | Kantar, 1,000 senior marketers |
| Marketers planning to cut spend | 26% | 29% | ~1 in 8 planning full exit |
| Monthly active users | — | ~557M (−4.9% YoY) | First sustained decline post-acquisition |
| Subscription revenue | — | ~$1B ARR | Diversifying away from ads |
For a retailer, the practical implications are three. Never build a channel dependency on X: treat it as a launch and moment budget that can be zeroed without breaking the plan. Second, decide the brand safety question at leadership level before media planning, because 4% confidence is not a media metric. Third, benchmark against your own alternatives rather than against X's history — audience reporting alone ranges from 388 million to 611 million monthly users depending on the definition, so any modelling built on a single headline number is fragile.

How X compares with the rest of the mix
The cross-platform read for device retail is that X wins the impression price and loses the conversion infrastructure. AdLibrary notes most DTC and lead-gen brands keep 80–90% of paid social budget on Meta, and that X earns budget only when the product category lives in active cultural conversation. Phones qualify for about six weeks a year.
| Platform | Typical CPC | Typical CPM | Role for a device retailer |
|---|---|---|---|
| X (Twitter) | $0.18–$2.00 | $2.09–$6.46 | Launch moments, keyword intent, share of voice |
| Meta | $0.80–$3.00 | $8–$18 | Always-on prospecting and retargeting |
| TikTok | ~$0.62 | $4.10–$16.20 | Accessories, creator content, Shop |
| $5–$8 | ~$33 | B2B and enterprise device fleets only | |
| Google Search | ~$1.15 (electronics) | — | Harvests the demand the others create |
Sequencing matters more than platform choice. Search captures the intent a launch campaign creates, which is why we plan the two together in our growth marketing engagements and pressure-test the split with the same benchmarks we publish for Google Ads costs. If X is your cheapest reach and Search is your cheapest conversion, the mistake is asking either one to do the other's job. Our Meta Ads benchmarks cover the always-on side of that split.
A test plan sized to the risk
- Cap the test at a launch window rather than a quarter. Spend where $2.70 ROI is plausible, not where the category browses.
- Budget $20–$50 a day for awareness tests and $50–$100 a day for conversion tests — the documented thresholds for meaningful data.
- Lead with keyword and conversation targeting on model names, not interest categories.
- Ship video under 15 seconds; it outperforms static by 2–3x on engagement, and the first 3 seconds decide the outcome.
- Track CPE ($0.03–$0.13) for share-of-voice objectives and CPA ($18.50–$21.55) for conversion objectives — never one for the other.
- Hold Meta at 80–90% of paid social until X proves incremental purchases, not cheaper impressions.
- Review the brand safety decision quarterly given 4% marketer confidence and 29% planning cuts.
- Expect 82% mobile delivery and design every asset for a phone screen held one-handed.
Creative rules the data supports
X is a text-native, mobile-native, fast-scrolling environment, and the format benchmarks reflect that. Video outperforms static image ads by 2–3x on engagement rate, the practical ceiling for direct response sits between 6 and 15 seconds, and the first 3 seconds decide whether the rest is watched at all. Engagement rates themselves are brutally low by social standards: the median across industries is 0.015% per post, influencers average 0.39%, and text posts lead all formats at 0.48% against 0.13% for link posts.
| Creative decision | Evidence | Application to devices |
|---|---|---|
| Video over static | 2–3x engagement advantage | Camera samples, durability clips, unboxings |
| 6–15 second cuts | Best direct-response window | One feature, one price, one link |
| Avoid bare link posts | 0.13% vs 0.48% for text | Put the spec claim in the post copy itself |
| Reply-level engagement | CPE as low as $0.03 | Answer spec and price questions publicly |
| Vertical-first framing | 82% mobile delivery | Never repurpose a landscape TV cut |
| Algorithmic feed dominance | 78% of impressions | Paid distribution, not follower reach |
The last row is the one most retail teams miss. Because the algorithmic feed produces 78% of impressions and only 22% of users default to a chronological timeline, follower count is close to irrelevant to reach. Whatever organic presence a retailer has built, distribution on launch day is bought.
What X should never be asked to do
Three jobs belong elsewhere. Catalogue prospecting: with 16% product-discovery usage and no mature shopping surface, X cannot replace Meta or TikTok for evergreen product demand. Lead generation for B2B device fleets: X's visitor-to-lead conversion of 0.69% trails LinkedIn's 2.74%, even though LinkedIn charges 7–10x the click price — the cheaper click does not survive the conversion gap at low volume. And last-click attribution: conversion rates of 1–3% on traffic campaigns mean small samples and noisy reporting, so a two-week test will rarely produce a defensible verdict on its own.
Used correctly, the channel is narrow and genuinely useful: cheap, precisely-timed reach against a young, male-skewed, mobile audience that is 32% more likely to try new products, in the exact hours when the category is the news. Used as a general-purpose retail channel, it produces cheap impressions and expensive customers.
Frequently Asked Questions
What do X ads cost in 2026?
Published benchmarks differ by roughly 3x depending on what is being counted. Broad platform datasets report a CPM of $2.09 and a CPC as low as $0.18, mid-range compilations report a CPC of $0.74–$0.85 with a CPM of $5.20–$6.46, and practitioner ranges for competitive tech and finance targeting reach $0.75–$2.00 per click. Median CPA sits at $18.50–$21.55 and median cost per engagement at $0.03–$0.13.
Is X cheaper than Meta for a tech retailer?
On reach, consistently. X CPC averages $0.74 against Meta's $1.41, and X CPM averages $6.46 against Facebook's $7.19; awareness CPMs of $4–$8 compare with Meta's $8–$18. But a $10 Meta CPM producing $0.80 CPAs beats a $5 X CPM producing $2.50 CPAs, and most DTC advertisers still keep 80–90% of paid social budget on Meta.
Who is actually on X in 2026?
Estimates range from 388 million monthly users to 611 million depending on the definition, with 251 million daily active users and an advertising reach around 557.5 million. The audience skews male at 63.7%, concentrates in 25–34 (37.5%) and 18–24 (32.1%), and 82% of traffic is mobile. In the US, 26% of users come from $70–99k households.
Do people use X to discover products?
Rarely, and this is the platform's core weakness for retail. Only 16% of social media users use X for product discovery, against 61% for Instagram and 60% for Facebook. X users are documented as 32% more likely to try new products and 39% more likely to buy advertised products than non-users, but 63% come for news and current events, not shopping.
What is the honest risk of advertising on X?
Brand safety and volatility. Only 4% of marketers considered X ads brand safe in Kantar's survey of 1,000 senior marketers, 29% plan to cut X spend (up from 26%) and nearly one in eight plan to exit entirely. Ad revenue fell from $4.4 billion in 2022 to $1.8–2.26 billion in 2025. The cheap inventory exists because of that exodus.
Sources
Searchlab — X (Twitter) Statistics 2026
SocialNexis — X (Twitter) Statistics 2026
SocialPilot — X (Twitter) Statistics 2026
HeyOz — Are X (Twitter) Ads Worth It in 2026
The Global Statistics — X Advertising Statistics 2026
Pryani — X (Twitter) Ads Strategy Benchmarks
Enrich Labs — Twitter/X Benchmarks 2026
AdLibrary — X Ads vs Meta Ads 2026
True Interactive — Where X Stands with Advertisers
Twitter10k — X Lead Generation Ad Benchmarks
Onclusive — X (Twitter) Statistics 2026