Table of contents

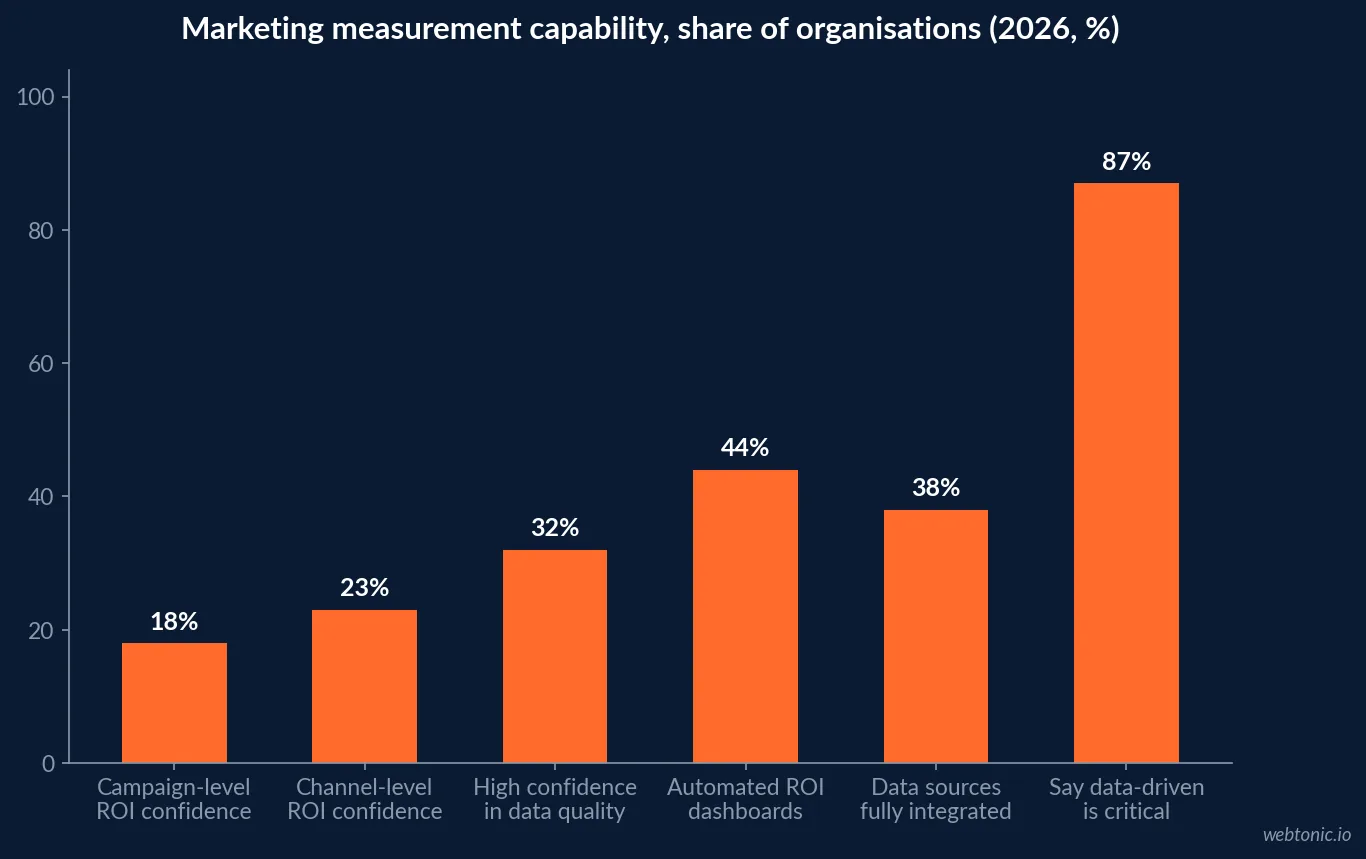
87% of marketing leaders call data-driven decisions critical to strategy, and only 32% say they trust their own data. For phone and tech retailers running thin hardware margins across stores, marketplaces and a webshop, that gap is where the budget quietly leaks.
Key Takeaways
- 87% of marketing leaders say data-driven decisions are critical.
- Only 32% report high confidence in their data quality.
- 73% of CMOs increased analytics budgets in the past 12 months.
- Just 44% of organisations have automated marketing ROI dashboards.
- Only 23% can measure ROI by channel with high confidence.
- 18% can do it at campaign level.
- 56% of analyst hours go to data plumbing, 9% to strategy.
- Analytics leaders lose 11.4 hours a week to manual data prep.
- 67% of teams say data quality issues affect campaign decisions.
- Enterprises average 12 marketing data sources; 38% are fully integrated.
- Retail BI monetisation maturity sits at 52.3%, the cross-industry median.
- Retail dashboard coverage reaches 84–89% while monetisation stalls at 52–63%.
- 45% of retailers use AI weekly or more; 11% are ready to scale it.
- Average paid conversion under-reporting is 38.4%, about 39% in electronics.
- Consumer electronics ecommerce converts at 2.65% on a $185 order.
- Electronics runs 72.4% mobile traffic but roughly 35% mobile revenue.
- Analytics-mature organisations report 23% higher marketing ROI.
- Payback on analytics infrastructure averages 8–14 months.
Reporting benchmarks at a glance
These are the numbers worth pinning above a reporting roadmap. Sources are practitioner surveys and aggregated benchmark studies, not vendor case studies.
| Metric | 2026 benchmark | What it tells a retailer |
|---|---|---|
| Say data-driven decisions are critical | 87% | Intent is universal, so it is not a differentiator |
| High confidence in data quality | 32% | Trust, not tooling, is the constraint |
| Have automated ROI dashboards | 44% | Automation is still a majority gap |
| Can measure channel ROI confidently | 23% | Most channel calls are educated guesses |
| Analyst week spent on data plumbing | 56% | The cost centre hiding inside reporting |
| Analyst week spent on real analysis | 9% | The part that changes decisions |
| Marketing data sources per enterprise | 12 | Every unintegrated source is a variance |
| Sources fully integrated | 38% | Dashboards inherit the gaps |
| Average conversion under-reporting | 38.4% | Dashboards understate paid performance |
Where the reporting hours actually go
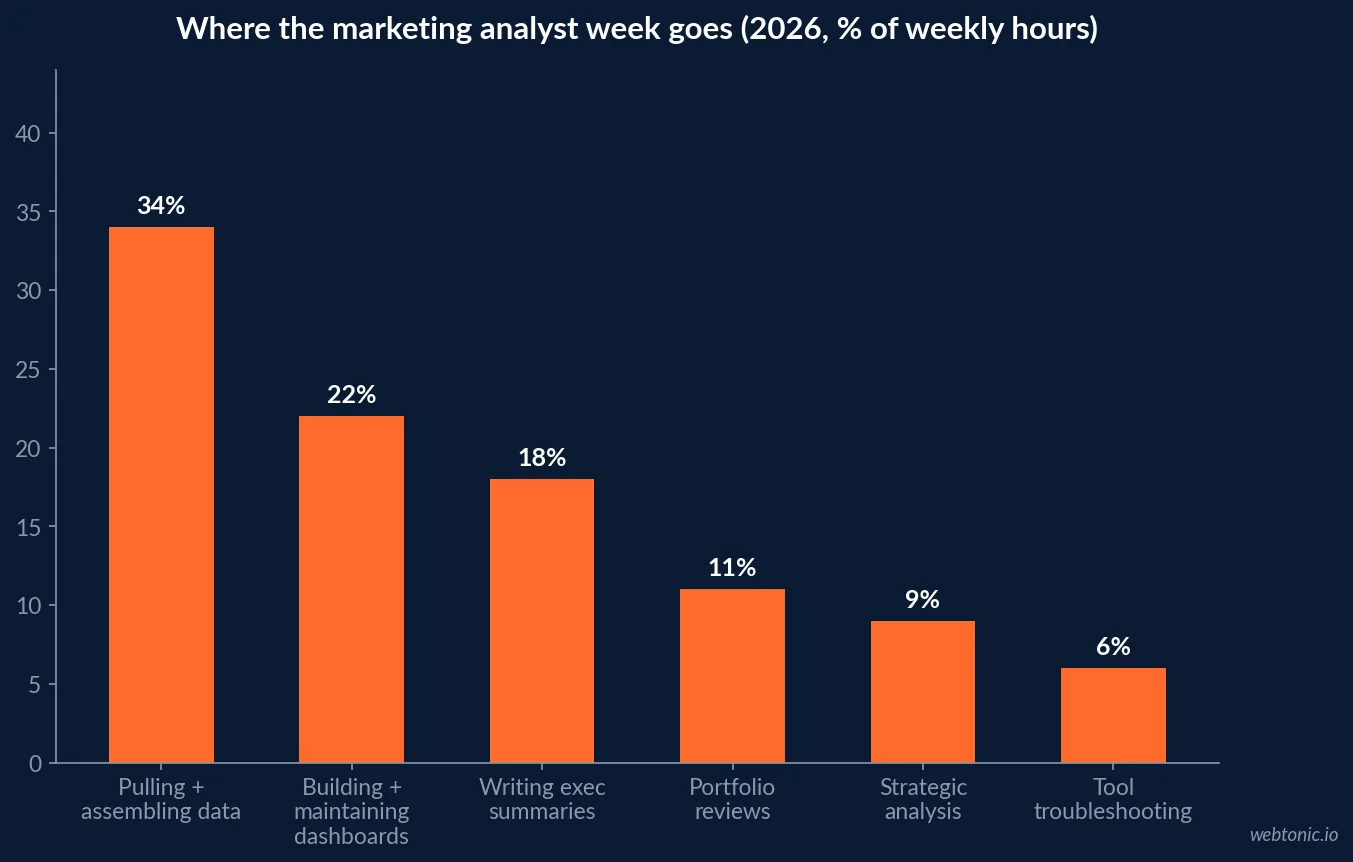
An audit of 12 marketing teams ranging from 5 to 50 clients produced the most useful time breakdown published this year. Pulling and assembling data from platforms took 34% of the week, building and maintaining dashboards 22%, writing executive summaries 18%, portfolio reviews 11%, tool troubleshooting 6% — and genuine strategic analysis 9%. The largest team in the sample was worse, at 70% plumbing and 5% strategy, because complexity scales faster than headcount.
The in-house picture matches. Analytics leaders report 5.1 hours a week on manual data cleaning and 6.3 hours on ad hoc report pulls, 11.4 hours total, while 31% of the week goes to reactive stakeholder requests and only 19% to data strategy. Delegating routine dashboard maintenance recovers 7–9 hours a week in the same benchmark. For a retailer, the practical reading is that the first dashboard project should remove work, not add a tab.
| Activity | Share of analyst week | Typical failure mode |
|---|---|---|
| Pulling and assembling platform data | 34% | Exports copy-pasted into a template |
| Building and maintaining dashboards | 22% | Templates break when an API changes |
| Writing the executive summary | 18% | Narrative written after the deadline |
| Cross-account portfolio reviews | 11% | Nobody spots the account going sideways |
| Tool and integration troubleshooting | 6% | Connector failures found by the client |
| Strategic analysis | 9% | The only line that earns margin |
Retail analytics maturity: dashboards yes, decisions no
A 2026 mid-market survey put retail BI monetisation at a 52.3% median, exactly at the cross-industry mean, while process optimisation scored 84–89%. In plain terms: most retailers have dashboards, and far fewer wire predictive signals or automated responses into operations. Monetisation jumps from 38% in the $10M–$100M revenue band to 68% in the $250M–$1B band, which is where assortment planning and markdown optimisation get real budget.
Adoption of AI on top of that base is broad and shallow: 45% of retailers use AI weekly or more but only 11% say they are ready to scale it, and while 56% of marketing teams use AI-powered analytics, just 29% can quantify its ROI. Teams that do report a 64% reduction in time-to-insight and 28–35% better forecast accuracy. The global retail analytics market sits near $10–12 billion, with 2030–2031 forecasts between $4.97 billion for software and services alone and about $20.65 billion for the broader definition — a reminder to check what a market-size headline is counting.
The eight numbers a phone retailer should actually watch
Device retail has thin hardware margin and fat attachment margin, so a dashboard built around sessions and clicks will mislead. Anchor it to the category benchmarks instead.
| KPI | Consumer electronics benchmark | Why it belongs on page one |
|---|---|---|
| Conversion rate | 2.65% (top 20%: 4.80%) | Sets the ceiling on any traffic investment |
| Average order value | $185 | Decides which channels can ever pay back |
| Cart abandonment | 74.5% | The cheapest recoverable revenue in the stack |
| Repeat purchase rate | 21.5% | Accessories and trade-in economics live here |
| Customer retention | 24% | Distinguishes a base from a traffic habit |
| Search CPA | $48.50 | Compare against margin, not against CPC |
| Mobile share of traffic vs revenue | 72.4% vs about 35% | Explains most 'mobile is broken' arguments |
| Tracking health (platform vs orders) | Target variance under 10% | Everything else is unreadable without it |
The mobile split is the one most dashboards get wrong. Electronics draws 72.4% of sessions on phones but takes only about 35% of revenue there, against a 51% retail average, because a $900 handset is researched on mobile and bought on desktop or in store. Report mobile as an assist channel and the CPA conversation changes.
Why the dashboard and the till disagree
Analytics platforms attribute events, not orders. If a purchase event does not fire because of an ad blocker, a declined consent banner or a broken script, the order does not exist in the model: a shop with 100 orders can show 70 purchase events and the missing 30 land in direct or nowhere. Average paid conversion under-reporting measured across advertisers is 38.4%, and roughly 39% in electronics specifically.
That is why 67% of teams say data quality problems affect campaign decisions and why 42% of CRM records carry at least one defect. The fix is unglamorous: one reconciliation view that compares platform-reported conversions, analytics conversions and back-office orders every week, with the variance published rather than argued about. Teams investing in measurement name marketing mix modelling (40%), AI creative testing (37%) and A/B testing (36%) as their next 12-month priorities, but none of those survive an unreconciled base.
Reporting cadence that fits device retail
Refresh rates should follow decisions. Weekly reports are too slow for a launch week or a fast-moving accessory line, and hourly refreshes on a quarterly brand metric are theatre. Only 42% of marketing teams are projected to reach real-time analytics by 2027, so the realistic target for most retailers is a fast daily core with a monthly narrative.
| Cadence | What it should carry | Decision it enables |
|---|---|---|
| Near-real-time | Spend pacing, stock-outs, site errors | Stop paying for what cannot be bought |
| Daily | Blended CAC, orders, top creative, CVR | Budget and creative rotation |
| Weekly | Channel margin, reconciliation variance, cohort repeat rate | Reallocation and offer changes |
| Monthly | Contribution margin, retention, MMM read | Mix and inventory planning |
| Quarterly | Incrementality tests, brand tracking, LTV by cohort | Structural strategy changes |
The half of the business dashboards usually ignore
Device retail is still mostly a physical trade, and most marketing dashboards stop at the checkout. More than 80% of retail shopping still happens in store, 86% of buyers research online before buying offline and 80% visit the website during an in-person journey, so a dashboard reporting only ecommerce revenue is grading a fraction of the outcome.
The cheapest bridge is a collection metric. Click-and-collect is forecast at $177.9 billion in 2026, up 15.3%, and it converts better than the chain average: 3.4% for buy-online-pickup-in-store and 4.1% for curbside against 2.9%. Because a collection order is an online event with an offline fulfilment, it gives the reporting layer a clean join between paid media and the shop floor without a loyalty programme, a matched-list upload or a survey question at the till.
| Offline signal | Benchmark | How to get it into the dashboard |
|---|---|---|
| Buy online, pick up in store | 3.4% conversion rate | Tag as a distinct conversion action |
| Curbside collection | 4.1% conversion rate | Separate from shipped orders |
| Research online, buy offline | 86% of buyers | Store locator and directions as micro-conversions |
| Website use during a store visit | 80% of journeys | In-store wifi or QR-tagged sessions |
| Calls to a store | Highest-intent local action | Call tracking with duration thresholds |
Tool spend versus tool use
The same 12-team audit compared what teams pay for with what they open. Looker Studio led daily use at 83% on the lowest cost; Funnel.io showed 25% daily use with 75% considering a downgrade, and Databox 33% use with 67% considering a swap. Stack rationalisation is usually a bigger margin win than a new licence, and the same survey found teams do not own their measurement agenda: 52% say an external data team defines data strategy while only 31% involve the CMO.
| Reporting tool | Daily use rate | Considering a change |
|---|---|---|
| Looker Studio (with connectors) | 83% | 0% |
| Agency-style client reporting suite | 75% | 17% |
| Data pipeline / connector tool | 67% | 42% |
| White-label reporting platform | 50% | 50% |
| Dashboard-as-a-service tool | 33% | 67% |
| Enterprise data warehouse layer | 25% | 75% |
How to build the reporting layer in the right order
- Reconcile before you visualise. With 38.4% average under-reporting, a beautiful dashboard on a broken base is worse than a spreadsheet.
- Kill the plumbing first. 56% of analyst time is assembly; automate that before adding a single new chart.
- Cap the source list. Enterprises average 12 sources with 38% integrated — connect fewer, properly.
- Report margin, not revenue. On a $185 order with hardware margin, a $48.50 search CPA is a different story per category.
- Split mobile traffic from mobile money so the 72.4% versus 35% gap stops looking like failure.
- Write the narrative once a week. Executive summaries take 18% of analyst time for a reason: they are what gets read.
- Judge maturity by monetisation. Retail scores 84–89% on dashboards and 52–63% on acting on them.
Reporting that survives a quarter is an engineering job before it is a design job. That is how our data intelligence team sequences it, alongside the paid work in Google Ads and Meta Ads where the numbers get spent — if your dashboard and your accounting disagree, tell us by how much.
Frequently Asked Questions
How much time do marketing teams lose to building reports instead of reading them?
In an audit of 12 marketing teams, 34% of weekly analyst hours went to pulling and assembling data and 22% to building or repairing dashboards — 56% on plumbing, against 9% on strategic analysis. Analytics leaders separately report losing 11.4 hours a week to manual data preparation and ad hoc report pulls, and describe only 23% of the week as strategic.
What should a phone or tech retailer put on a weekly marketing dashboard?
Eight numbers cover most decisions: blended CAC, contribution margin after ad spend, store-level assisted revenue, conversion rate against the 2.65% consumer electronics benchmark, average order value against $185, mobile versus desktop revenue split (electronics is 72.4% mobile traffic but only about 35% mobile revenue), repeat purchase rate against 21.5%, and one tracking-health metric such as the ratio of platform-reported to back-office orders.
How often should a retail marketing dashboard refresh?
Match the refresh rate to the decision, not the tool. Daily is enough for budget pacing and creative rotation; peak trading weeks and launch days need near-real-time inventory and spend views. Only 42% of marketing teams are projected to have real-time analytics by 2027, and weekly reports are already too slow for fast-moving device categories.
Why do dashboards and finance disagree about revenue?
Because they count different events. Analytics platforms attribute events, not orders: if the purchase event does not fire because of a blocker, a consent decline or a script error, the order is simply missing from the model. Average paid conversion under-reporting runs 38.4%, and about 39% in electronics. Reconcile every dashboard to the order system once a week and publish the variance.
Does dashboard maturity actually pay?
The correlations are consistent across studies: analytics-mature organisations report 23% higher marketing ROI, 31% better customer acquisition cost and are 2.7x more likely to exceed revenue targets, with an 8–14 month payback on analytics infrastructure. Treat those as directional: the causation runs both ways, since disciplined companies build better dashboards.
Sources
Marketing analytics statistics 2026, 140+ data points
Reporting stack audit of 12 marketing teams
Head of analytics time management statistics 2026
Supermetrics Marketing Data Report 2026
BARC Data, BI and Analytics Trend Monitor 2026
Retail analytics maturity survey 2026
Retail analytics statistics 2026
Retail analytics software and services market report
Ecommerce attribution: events versus orders
Consumer electronics marketing benchmarks 2026
Mobile revenue share by ecommerce vertical 2026