Table of contents

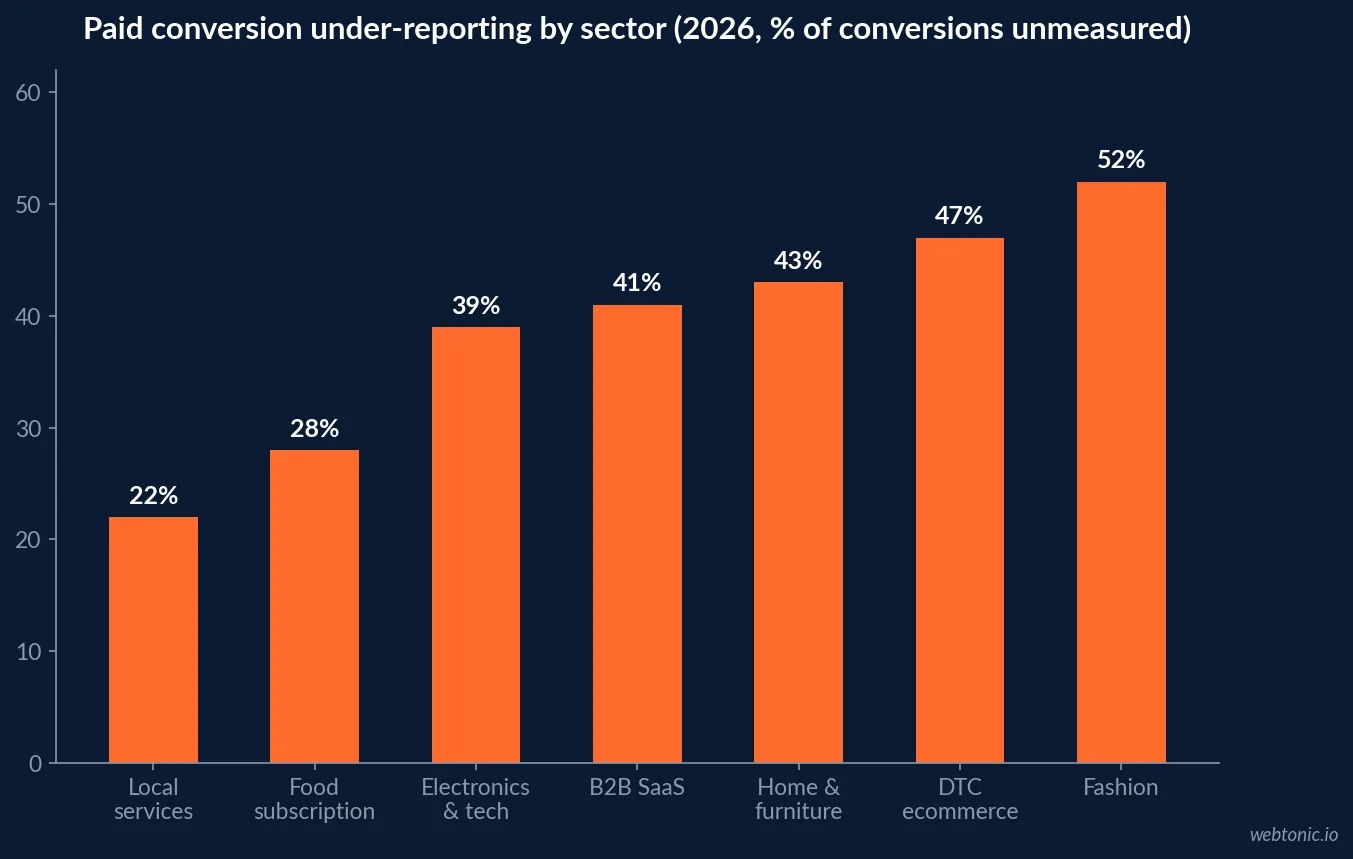
Advertisers are under-reporting paid conversions by an average of 38.4% in 2026, and electronics sits at -39% — which means the average phone or tech retailer is making budget decisions on roughly six of every ten conversions it actually earned.
Key Takeaways
- Average paid-ad conversion under-reporting is 38.4% in 2026.
- Electronics and tech shows a -39% reporting gap.
- Reported conversions fell 38.4% while actual conversions grew 13%.
- Full server-side tracking recovers 71% of lost conversions.
- Client-side GA4 alone recovers just 8%.
- Only 19% of brands have full server-side tracking.
- Server-side adoption grew from 11% in 2023 to 43% in 2026.
- Accurate signal returns 14–22% lower Meta CPMs and 8–18% lower Google CPCs.
- Platform ROAS runs 2.3x above marginal truth on average.
- Performance Max over-reports by 2.8–4.1x.
- Meta signal loss averages 32%; Google Ads 11%.
- Multi-touch attribution adoption reached 47%, last-touch still 41%.
- MMM adoption tripled from 9% in 2023 to 26% in 2026.
- Retail (brick and online) MMM adoption is 71%.
- MMM crosses 50% adoption above $10 million marketing spend.
- Only 33% of leaders call their attribution data mostly accurate.
- iOS ATT opt-out remains near 85%.
- Reported iOS conversions on Meta are about 64% of actual.
- 64% of third-party-domain checkouts lose attribution by default.
- Consumer electronics converts at 2.65% on a $185 average order.
- Mobile is 72.4% of electronics traffic but only 61% of orders.
- Over 80% of shopping still happens in-store.
- Teams improving attribution report +33% ROI and -29% CAC.
The Size of the Measurement Gap
The clearest 2026 dataset on this quantifies the gap directly. A survey of 2,400 marketers cross-validated against $18 million of measured spend found average conversion under-reporting of 38.4%, an electronics and tech gap of -39%, and 47% of marketers cutting or planning to cut paid spend because of performance declines that had not actually happened.
| Sector | Reporting gap | Read for tech retail |
|---|---|---|
| Fashion / apparel | -52% | Worst case, heavy iOS skew |
| Beauty / personal care | -48% | Impulse, mobile-first |
| DTC ecommerce (all) | -47% | Upper bound for direct sellers |
| Home / furniture | -43% | Considered purchase, long window |
| B2B SaaS | -41% | 87-day sales cycles outrun cookies |
| Electronics / tech | -39% | The benchmark to plan against |
| Food / grocery subscription | -28% | Logged-in, first-party rich |
| Local services | -22% | Simplest journeys |
The distortion compounds: reported conversions dropped 38.4% between April 2025 and March 2026 while actual conversions grew 13%. Teams reading dashboards concluded their channels had collapsed. Among brands with full server-side implementation, paid budgets grew 14% year over year at efficient measured CAC; among those on inadequate tracking, budgets shrank 9% — often for no real reason.
Recovery Rates by Tracking Stack
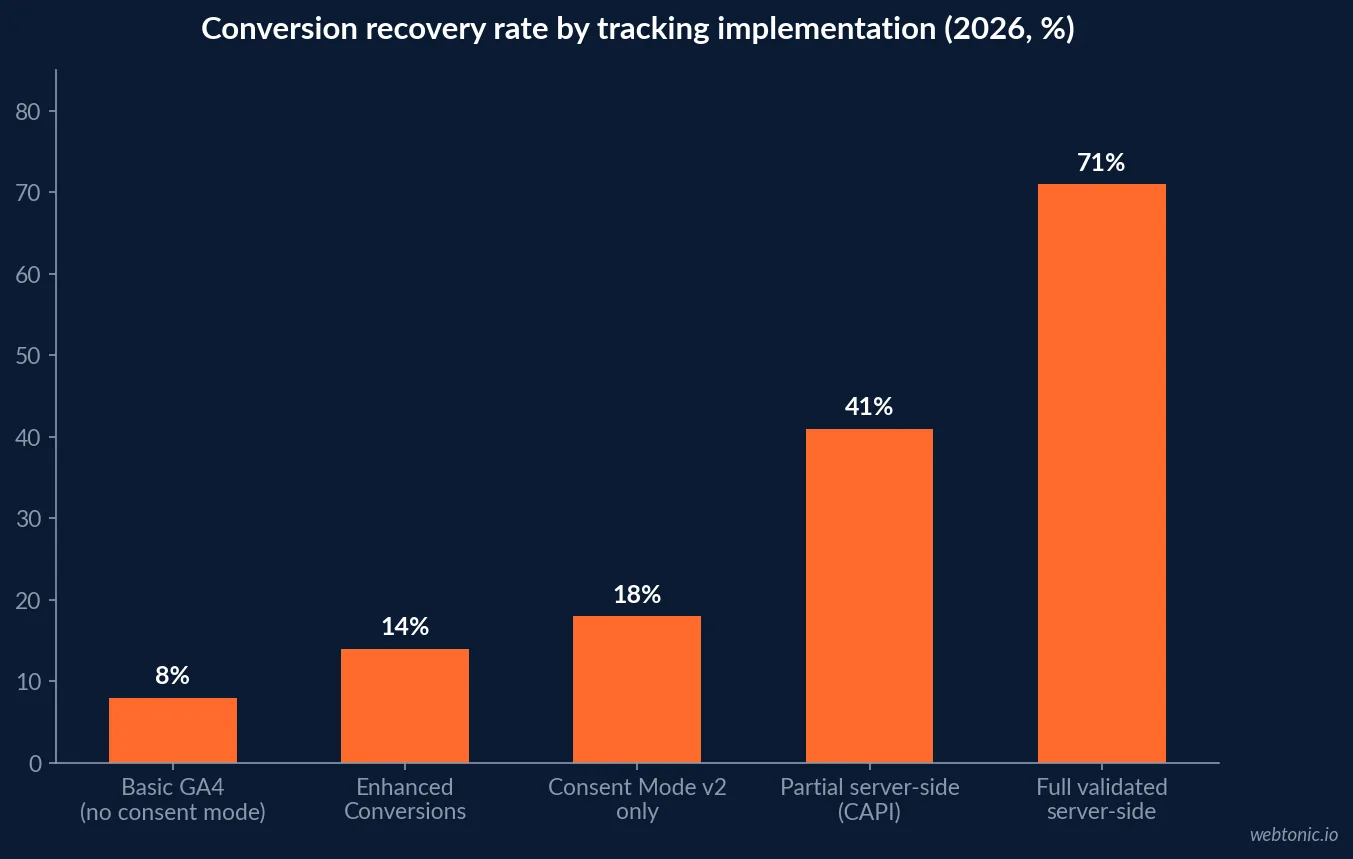
The remedy is unusually well quantified. Brands on full server-side tracking recover 71% of cookie-deprecated conversions, partial server-side 41%, Consent Mode v2 alone 18% and client-side GA4 8%. Only 19% of brands are in the top tier, and 49% sit at client-side plus Consent Mode v2 or worse.
| Tracking implementation | Avg recovery | Adoption | Practical cost |
|---|---|---|---|
| Full server-side GTM (validated) | 71% | 19% | $5,000–$10,000 setup, $190–$510/month |
| Partial server-side (CAPI only) | 41% | 24% | Low, but leaves web gaps |
| Client-side + Consent Mode v2 | 18% | 31% | Configuration effort only |
| Client-side + Enhanced Conversions | 14% | 11% | Requires hashed first-party data |
| Basic GA4, no consent mode | 8% | 18% | Free and misleading |
| No functioning tracking | 0% | 8% | Flying blind |
The commercial argument is not reporting hygiene, it is bid quality. Accurate conversion feeds produce 14–22% lower Meta CPMs, 8–18% lower Google Ads CPCs and 31–47% lower effective CAC, with typical payback in 30–60 days above $25,000 of monthly media. Consent rates average 71% overall and 76% in ecommerce, so most of the gap is technical rather than legal.
Model Adoption: MTA, MMM and the Hybrid Middle
Multi-touch attribution adoption reached 47% in 2026 against 31% in 2023, MMM tripled from 9% to 26%, and 41% still run last-touch — totals exceed 100% because most mature teams run two models in parallel. Attribution-capable teams spend 23% more on martech and report 1.6x larger marketing-sourced pipeline.
| Annual marketing spend | Share running MMM | Recommended stack |
|---|---|---|
| Under $2 million | 11% | MER plus platform ROAS, server-side tracking |
| $2–10 million | 28% | Add post-purchase survey and quarterly holdouts |
| $10–25 million | 54% | MTA for tactics, light MMM for allocation |
| $25–100 million | 72% | Hybrid MTA + MMM, dedicated measurement owner |
| Over $100 million | 89% | Continuous MMM with geo experiments |
MMM went mainstream for a specific reason: 43% of adopters cite signal loss as the primary trigger and 38% credit Google’s open-source Meridian release with collapsing entry costs from six-figure consulting engagements to weeks of in-house work. That is the change that made modelling viable for mid-market retailers rather than only for CPG.
Why Platform Dashboards Disagree With Reality
| Channel | Signal loss | ROAS over-reporting | Attribution note |
|---|---|---|---|
| Meta | 32% (range 18–48%) | 2.1–3.5x | CAPI recovers 41% of post-ATT signal |
| Performance Max | Included in Google | 2.8–4.1x | Worst offender; brand search absorbed |
| Google Ads (search) | 11% (range 5–22%) | 1.4–2.2x | Branded search inflates credit |
| TikTok | 24% (range 14–35%) | 1.8–2.8x | iOS reporting at 61% of actual |
| Email (Klaviyo) | 6% | Fully first-party | Cleanest channel in the stack |
Branded search is the specific trap for device retailers. Across brands running MTA, MMM and lift tests on the same campaigns, branded paid search took 28% of MTA credit, 9% under MMM and only 4% in lift tests, while untracked TV drew 0% in MTA against 18% in MMM. Of the 31% of brands that ran an incrementality test, 68% found a channel with negative incrementality and 24% cut branded search spend afterwards.
The Device-Specific Problem: Mobile Traffic, Desktop Money
Consumer electronics has the widest device split in retail, and it breaks single-device attribution. Mobile is 72.4% of electronics traffic but only 61% of orders, desktop is 25.1% of traffic and 37.5% of orders, conversion averages 2.65% on a $185 order, and cart abandonment sits at 74.5%. Electronics is one of the last desktop-revenue-majority verticals at roughly 35% mobile revenue against a 51% retail average.
| Device metric (electronics) | Traffic share | Order share | Attribution consequence |
|---|---|---|---|
| Mobile | 72.4% | 61.0% | Discovery device; loses ATT signal |
| Desktop | 25.1% | 37.5% | Conversion device; takes last-click credit |
| Tablet | 2.5% | 1.5% | Rounding error |
| Mobile bounce rate | 54.2% | — | Inflates mobile inefficiency in reports |
| Desktop bounce rate | 39.8% | — | Flatters desktop channels |
| Cart abandonment | 74.5% | — | Most journeys never fire a purchase event |
Because research happens on a phone and purchase on a laptop, the paid social that generated demand is systematically under-credited and direct or organic over-credited. That is a cross-device identity problem, not a channel performance problem, and it is why we build data intelligence layers before touching bid strategy.
The Offline Half Nobody Measures
Attribution debates fixate on pixels while most revenue happens in a store. Over 80% of shopping still occurs in-store, and offline outlets held 56.71% of the consumer electronics retail market in 2025. 91% of consumers shop omnichannel, 86% research online before buying in-store, 80% visit a retailer’s website as part of an in-person journey, and omnichannel customers spend 16% more per order.
| Omnichannel signal | Figure | Measurability |
|---|---|---|
| Consumers shopping omnichannel | 91% | Partially, via loyalty ID |
| Research online, purchase in-store | 23–86% depending on definition | Weak — needs survey or geo lift |
| Click-and-collect sales, 2026 | $177.9 billion, up 15.3% | Strong — digital start, POS end |
| BOPIS conversion rate | 3.4% versus 2.9% chain average | Strong |
| Curbside pickup conversion | 4.1% | Strong |
| BOPIS shoppers buying extra in-store | 14–85% by study | Needs basket-level POS join |
| Omnichannel retention | 89% versus 33% single-channel | Requires identity resolution |
Retail chains offering curbside pickup converted at 4.1% in 2025 against a 2.9% Top 1000 average, and BOPIS chains at 3.4%, up from 3.2% in 2021. For attribution purposes those journeys are gold: they begin with a trackable click and end with a POS record, which makes them the cheapest bridge a device retailer has between ad spend and store revenue.
What Better Attribution Is Reported to Return
Only 33% of marketing leaders describe their attribution data as mostly accurate, 44% still rely on last-touch, teams overestimate their own precision by 20–30%, and those that improve accuracy report +33% marketing ROI and -29% customer acquisition cost. 84% of leaders name first-party data a top priority and 47% of B2B marketers now run server-side tracking.
The credible mechanism behind the +33% is unglamorous: budget moves off over-credited channels onto under-credited ones. It is a reallocation gain, not a magic lift, which is exactly why it is repeatable.
A Measurement Stack for Phone and Tech Retail
- Reconcile before you model. If GA4 purchases sit more than 15% below order-system counts, the data cannot drive budget decisions.
- Go server-side first. 71% recovery against 8% is the largest single-step improvement available.
- Fix third-party checkout tracking. 64% of checkouts on external domains lose attribution by default; server-side recovers 87% of those.
- Assume iOS blindness. ATT opt-out stays near 85% and reported iOS conversions run at 64% of actual on Meta.
- Discount platform ROAS by default. Plan against the 2.3x average over-report and test Performance Max hardest.
- Add MMM at $10 million. Adoption jumps to 54% at that threshold because that is where payback appears.
- Instrument click-and-collect deliberately. A 3.4–4.1% converting journey with a POS endpoint is the offline bridge.
- Run one incrementality test a quarter. 68% of testers found a negative-incrementality channel.
If your paid search reporting looks suspiciously strong, that is usually branded search absorbing demand it did not create — the same pattern we unpick in our Google Ads cost analysis, and the first thing our Google Ads team tests on a new account. Send us your numbers if the dashboard and the bank do not agree.
Frequently Asked Questions
How much of a tech retailer's conversions go unmeasured in 2026?
A survey of 2,400 marketers cross-validated against $18 million of measured spend puts average paid-ad conversion under-reporting at 38.4%, with the electronics and tech sub-sector at -39%. Reported conversions in Google and Meta accounts fell 38.4% between April 2025 and March 2026 while actual conversions grew 13% — the gap is measurement, not demand.
Does server-side tracking actually recover lost conversions?
Yes, and the spread is large. Brands on full server-side tracking recover 71% of cookie-deprecated conversions, partial server-side 41%, Consent Mode v2 alone 18%, and standard client-side GA4 just 8%. Brands feeding accurate data back see 14–22% lower Meta CPMs, 8–18% lower Google CPCs and 31–47% lower effective CAC. Setup runs $5,000–$10,000 and typically pays back in 30–60 days above $25,000 of monthly spend.
Should a tech retailer use multi-touch attribution or marketing mix modelling?
Both, at different spend levels. Multi-touch adoption reached 47% in 2026 and MMM 26%, up from 9% in 2023, with 33% running an explicit hybrid. MMM adoption is 71% among brick-and-online retailers and 54% of brands above $10 million of annual marketing spend, but only 11% below $2 million — that threshold is the practical dividing line.
Why do platform ROAS numbers overstate performance?
Because they count correlation as credit. A study of 150 brands found platform-reported ROAS averaging 2.3x higher than marginal ROAS measured through incrementality tests, with Performance Max the worst offender at 2.8–4.1x over-reported and Meta at 2.1–3.5x. Of the 31% of brands that ran an incrementality test, 68% found at least one channel with negative incrementality.
How do you attribute an in-store phone sale to an online ad?
Imperfectly, and the offline share is the biggest blind spot: over 80% of shopping still happens in-store while offline outlets held 56.71% of consumer electronics retail in 2025. The usable bridges are click-and-collect and BOPIS, which start digital and end in the POS — BOPIS converts at 3.4% against a 2.9% chain average, and click-and-collect sales are projected at $177.9 billion in 2026.
Sources
Cookieless tracking statistics 2026
Marketing attribution statistics 2026
Attribution reality: 150-brand study 2026
MMM adoption rate 2026
AI versus traditional attribution accuracy study
AMW marketing attribution statistics
Consumer electronics marketing benchmarks 2026
Mobile revenue share by ecommerce vertical 2026
Omnichannel statistics 2026
Digital Commerce 360 omnichannel conversion 2026
Ecommerce attribution guide 2026