



Table of contents
Key Takeaways
- Electronics email open rate averages 29.3% with a 1.85% click rate across 183,000+ brands — slightly below the 31% all-industry average but with higher click engagement than health and beauty (Klaviyo, 2026).
- Retail and e-commerce email marketing delivers $45 ROI for every dollar spent, making it the second-highest-returning industry behind travel and hospitality at $53 (Omnisend, 2026).
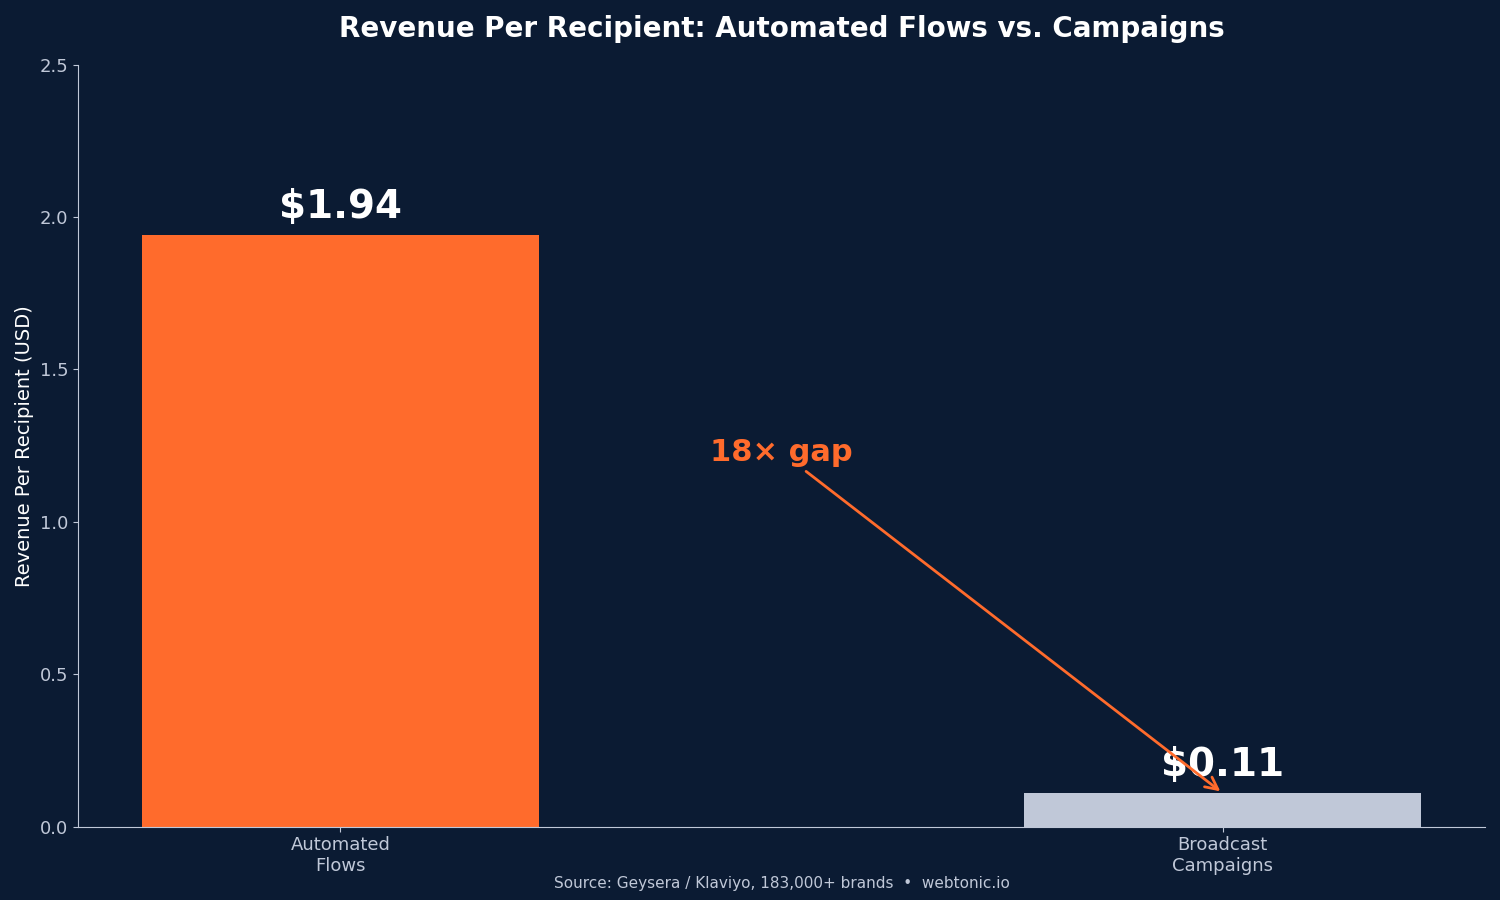
- Automated email flows earn $1.94 per recipient versus $0.11 for campaigns — an 18x revenue gap that makes flow optimization the highest-leverage email initiative for tech retailers (Geysera / Klaviyo, 2026).
- Phone accessories convert at 3.4% e-commerce conversion rate, significantly above the 1.9% consumer electronics average — driven by necessity purchases and lower price points (ATTN Agency, 2026).
- Abandoned cart email flows convert at 8–12% median with top performers reaching 15–22%, delivering $3–$8 revenue per recipient at median and $12–$25 for top-quartile brands (GOSH Digital, 2026).
- Automated emails drive 37% of all email-generated sales from just 2% of total sends, confirming that flow architecture outweighs campaign volume for revenue generation (Omnisend, 2026).
Email remains the highest-ROI channel for phone and tech retailers — delivering $45 for every dollar spent in the retail sector. Yet most electronics brands underinvest in the lever that matters most: automated flows rather than broadcast campaigns. These statistics cover the open rate benchmarks, revenue-per-recipient data, and automation performance that email marketing teams need to optimize campaigns for tech retail audiences.
Phone and Tech Retail Email Marketing at a Glance
| Metric | Value | Source |
|---|---|---|
| Electronics avg. open rate | 29.3% | Klaviyo, 2026 |
| Electronics avg. click rate | 1.85% | Klaviyo, 2026 |
| Top 10% open rate (all industries) | 45.1% | Klaviyo, 2026 |
| Retail email ROI per dollar | $45 | Omnisend, 2026 |
| Automated flow RPR | $1.94 | Geysera / Klaviyo, 2026 |
| Campaign RPR | $0.11 | Geysera / Klaviyo, 2026 |
| Phone accessories conversion rate | 3.4% | ATTN Agency, 2026 |
| Automated share of email revenue | 37% | Omnisend, 2026 |
Open Rate and Click Rate Benchmarks by Industry
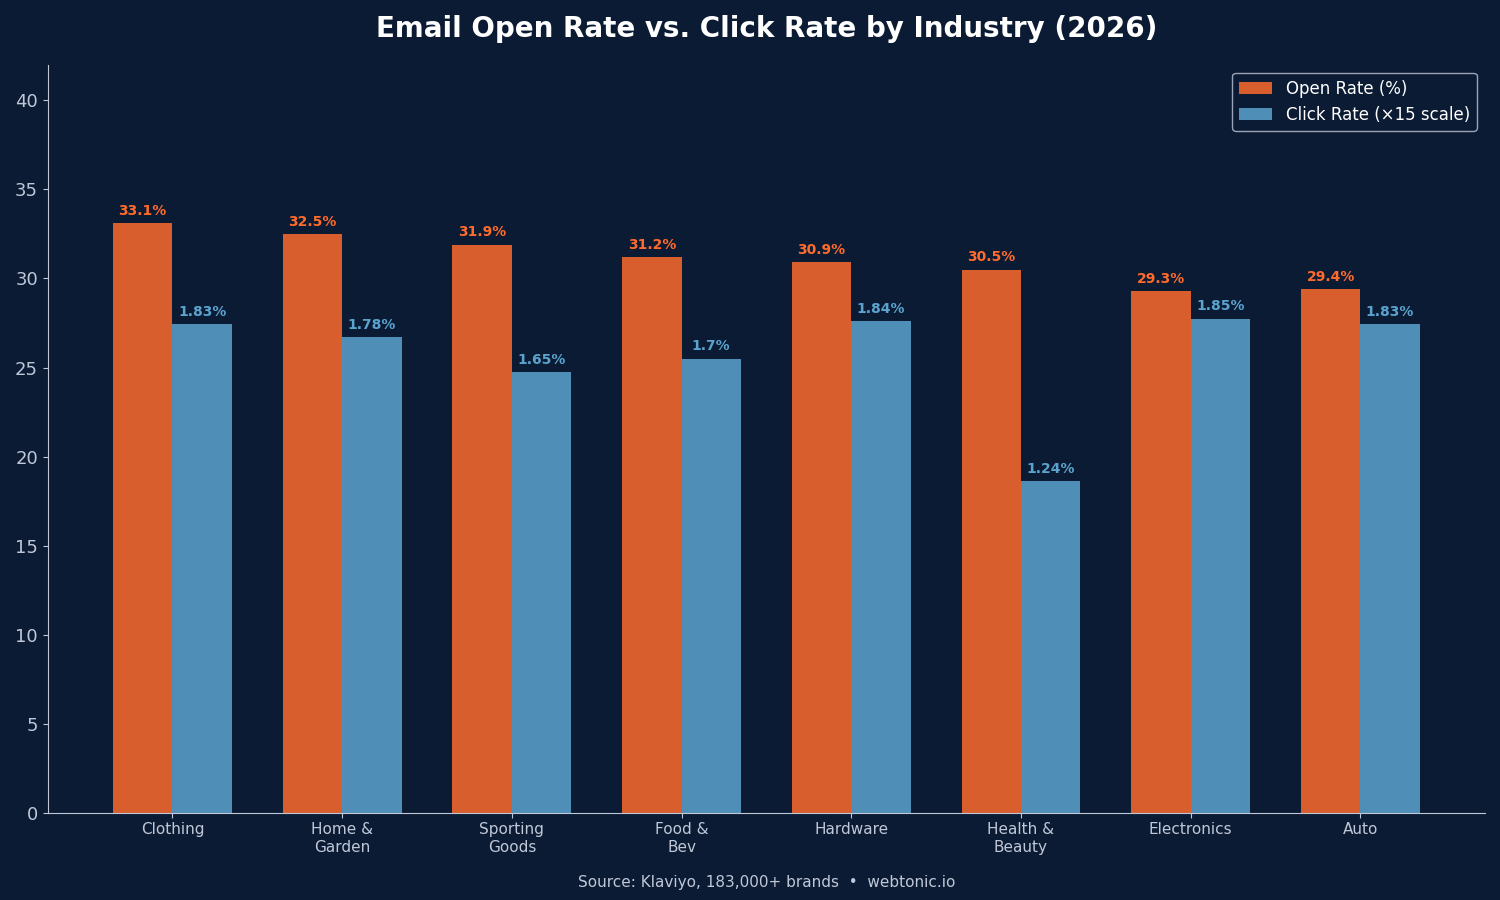
Klaviyo's 2026 benchmark report, based on data from over 183,000 brands, provides the most comprehensive view of email engagement across industries. Electronics sits slightly below the all-industry average on open rate but performs well on click rate.
| Industry | Open Rate | Click Rate |
|---|---|---|
| Clothing & Accessories | 33.1% | 1.83% |
| Home & Garden | 32.5% | 1.78% |
| Jewellery | 32.5% | 1.60% |
| Sporting Goods | 31.9% | N/A |
| Food & Beverage | 31.2% | 1.70% |
| Hardware & Home Improvement | 30.9% | 1.84% |
| Health & Beauty | 30.5% | 1.24% |
| Electronics | 29.3% | 1.85% |
| Automotive | 29.4% | 1.83% |
| Office Supplies | 28.9% | 1.88% |
| Mass Merchant | 28.7% | 1.77% |
Electronics achieves the third-highest click rate at 1.85%, trailing only office supplies (1.88%) and hardware (1.84%). This signals that while fewer electronics subscribers open emails — likely due to inbox competition and lower send frequency — those who do engage are highly intent-driven. For phone retailers, this means list hygiene and segmentation matter more than volume: a smaller, engaged list will outperform a large, disengaged one on every revenue metric.
Revenue Per Recipient: The Metric That Matters Most
Automated flows earn $1.94 per recipient versus $0.11 for broadcast campaigns — an 18x gap (Geysera / Klaviyo, 2026). This single data point should reshape how phone and tech retailers allocate their email resources. The 2026 median across 183,000+ brands is $6.86 per subscriber per year (Omnisend, 2025–2026).
CustomersAI analyzed 740 million emails and $300 million in revenue across 619 brands and found that flow-dominant brands earn $0.90 per email sent versus $0.24 for campaign-dominant brands — a 3.75x efficiency difference. Average revenue per contact sits at $0.45, with the top tier significantly higher.
For electronics and phone accessory brands specifically, GOSH Digital reports revenue per recipient between $0.05–$0.10 for campaigns, below the all-industry median. This lower RPR reflects electronics' longer purchase cycles and higher price points, which compress email-driven impulse purchases. The solution is not more campaigns but better flows — particularly post-purchase cross-sell and lifecycle sequences that nurture high-value repeat buyers.
Email Automation Performance for Tech Retail
Automated emails drive 37% of all email-generated sales despite making up only 2% of total sends (Omnisend, 2026). This ratio makes automation the single highest-leverage investment in any email program.
| Flow Type | Median Conversion | Top Quartile | Revenue Per Recipient |
|---|---|---|---|
| Abandoned Cart | 8–12% | 15–22% | $3–$8 median |
| Welcome Series | 5–8% | 10–15% | $1.50–$4 |
| Post-Purchase Cross-Sell | 3–5% | 8–12% | $2–$6 |
| Back-in-Stock Alert | 5–6% | 18–22% | High-intent triggers |
| Browse Abandonment | 2–4% | 6–10% | $1–$3 |
| Win-Back / Re-engagement | 1–3% | 4–7% | $0.50–$2 |
GOSH Digital's 2026 DTC benchmark report shows that winning abandoned cart flows contain 4–5 emails over 7–10 days, while top quartile flows extend to 5–7 emails over 7–14 days. For phone retailers, back-in-stock alerts convert at 5–6% on average but top stores reach 18–22% (Storebeep, 2026) — making them essential for high-demand product launches like new phone models or limited-edition accessories.
E-Commerce Conversion Rates by Tech Subcategory
Not all phone and tech retail products convert equally. ATTN Agency's 2026 benchmark data breaks down conversion rates by electronics subcategory, revealing significant variation driven by purchase complexity and price point.
| Subcategory | Conversion Rate | Conversion Driver |
|---|---|---|
| Phone Accessories | 3.4% | Necessity, low price, impulse-friendly |
| Gaming Gear | 2.6% | Enthusiast audience, brand loyalty |
| Consumer Electronics (avg.) | 1.9% | Comparison shopping, high AOV |
| Smart Home | 1.7% | Education required, integration concerns |
| Electronics & Technology (broad) | 2.1% | Mixed intent, specification research |
Phone accessories at 3.4% convert nearly double the consumer electronics average of 1.9%. The pattern is clear: lower price points and necessity-driven purchases compress the decision cycle, making email-driven promotions more effective. Smart home products at 1.7% require more educational content in email sequences — product setup guides, compatibility checks, and integration tutorials — to overcome buyer hesitation. For retargeting campaigns that feed into email flows, matching ad messaging to these subcategory dynamics improves both initial click-through and downstream email conversion.
Email Marketing ROI Compared to Other Channels
Email consistently outperforms every other digital marketing channel on return on investment. The industry average email marketing ROI sits at $36–$42 for every dollar spent — a 3,600%–4,200% return (Omnisend, 2026). Retail and e-commerce specifically earn $45 per dollar, trailing only travel and hospitality at $53. For comparison, Google Ads returns approximately $8 per dollar, making email roughly 5x more efficient as a revenue channel.
| Industry | Email ROI per Dollar |
|---|---|
| Travel, Tourism & Hospitality | $53 |
| Retail & E-commerce | $45 |
| Marketing, PR & Advertising | $42 |
| Software & Technology | $36 |
| Media & Publishing | $32 |
Omnisend merchants on paid plans averaged $79 for every dollar spent in 2025 — nearly double the industry benchmark. This premium performance comes from platform-specific optimizations: automated flow architecture, advanced segmentation, and send-time algorithms that maximize open rates. For phone and tech retailers, the message is clear — channel investment matters, but the execution platform amplifies returns dramatically.
List Size, Segmentation, and Deliverability Impact
Email list size directly impacts conversion rates. Acceleroi's 2026 Shopify benchmark data reveals a stark pattern: lists with 0–10K subscribers convert at 6–10%, while lists exceeding 200K subscribers convert at only 1.2–2.4% — even with identical messaging. The gap is driven by engagement decay and deliverability degradation at scale.
Segmentation closes most of this gap. Brands that segment by purchase history, browse behavior, and engagement recency maintain 4–6% conversion rates even at large list sizes. For phone retailers managing customer databases that span device buyers, accessory purchasers, and trade-in participants, segmentation is not optional — it is the difference between profitable email programs and inbox irrelevance. The average revenue per subscriber per year sits at $6.86 across all e-commerce brands (Omnisend, 2025–2026), but segmented programs routinely deliver 2–3x that figure.
Electronics brands send an average of 0.84–0.98 emails per week (TargetBay), with a promotion placement rate between 6–9%. This cadence is lower than fashion or food brands, reflecting the longer consideration cycle for technology purchases. The strategic implication: fewer, more targeted sends outperform high-frequency blasts in electronics. Each email should provide genuine value — product comparisons, compatibility guides, or exclusive launch access — rather than generic promotional content that trains subscribers to ignore the brand.
Email Best Practices for Phone and Tech Retailers
- Prioritize flow architecture over campaign volume. Automated flows deliver 37% of revenue from 2% of sends. Build abandoned cart, welcome, post-purchase, and back-in-stock flows before scaling campaign frequency.
- Target $1.94+ RPR on automated flows. Campaign RPR of $0.11 is the baseline; the 18x gap between campaigns and flows means every dollar invested in flow optimization compounds faster than campaign improvements.
- Segment by subcategory behavior. Phone accessories (3.4% conversion) require different email strategies than consumer electronics (1.9%) or smart home (1.7%). Use purchase history and browse behavior to match content to decision stage.
- Optimize for click rate, not open rate. Electronics achieves 1.85% click rate — third-highest across industries — suggesting subscribers who engage are high-intent. Focus on compelling CTAs and product-specific content rather than subject line gimmicks.
- Deploy back-in-stock alerts for launches. With 5–6% average conversion and 18–22% for top stores, back-in-stock emails are the highest-converting automated flow for phone retailers during new model releases and accessory launches.
Related reading
- Phone & Tech Retail Marketing Attribution Statistics: What 2026 Data Shows
- Phone & Tech Retail Marketing Dashboards: 48 Reporting Statistics for 2026
- Phone & Tech Retail Analytics Statistics
- Email Marketing services at Web Tonic
Frequently Asked Questions
What is the average email open rate for electronics brands?
The average email open rate for electronics brands is 29.3% (Klaviyo, 2026), based on data from 183,000+ brands. This is slightly below the 31% all-industry average. The top 10% of performers across all industries achieve a 45.1% open rate, indicating significant room for improvement through better segmentation and send-time optimization.
What ROI does email marketing deliver for retail brands?
Retail and e-commerce email marketing delivers an average of $45 for every dollar spent (Omnisend, 2026), the second-highest industry ROI behind travel ($53). Brands using optimized automation platforms report even higher returns — Omnisend merchants on paid plans averaged $79 per dollar spent in 2025.
How much revenue do automated email flows generate?
Automated flows generate 37% of all email revenue from just 2% of total sends (Omnisend, 2026). Revenue per recipient for automated flows averages $1.94 versus $0.11 for campaigns — an 18x gap. Flow-dominant brands earn $0.90 per email sent compared to $0.24 for campaign-dominant brands (CustomersAI, 2026).
What email conversion rate should phone retailers target?
Abandoned cart flows convert at 8–12% median with top performers reaching 15–22% (GOSH Digital, 2026). For phone accessories specifically, e-commerce conversion averages 3.4% — nearly double the 1.9% consumer electronics average (ATTN Agency). Back-in-stock alerts convert at 5–6% on average and 18–22% for top stores (Storebeep).
How many emails should an abandoned cart flow contain?
Winning abandoned cart flows contain 4–5 emails over 7–10 days at the median level, with top-quartile brands extending to 5–7 emails over 7–14 days (GOSH Digital, 2026). Revenue per recipient at median sits at $3–$8, while top-quartile brands generate $12–$25. The key is progressive urgency and product-specific creative variation across the sequence rather than repeating the same discount offer.
Sources
Klaviyo — 2026 Email Marketing Benchmarks by Industry
Omnisend — Email Marketing ROI 2026 Benchmarks
Geysera / Klaviyo — Revenue Per Recipient Analysis 2026
CustomersAI — 2026 Klaviyo Email Marketing Benchmark Report
GOSH Digital — DTC Email Benchmarks 2026
ATTN Agency — E-Commerce Conversion Rate Benchmarks 2026
Storebeep — Back-in-Stock Notification Benchmarks 2026
SearchLab — Email Marketing Statistics 2026
TargetBay — Consumer Electronics Email Marketing Strategies
GOSH Digital — Klaviyo Benchmarks by Industry 2026


